

 Font size:
The new state budget that takes effect Oct. 1 will likely be the final piece of fiscal policy Gov. Gretchen Whitmer authorizes before she leaves office. It’s a good time to review her policy accomplishments in office — specifically, in fiscal matters, dollars and cents. Her ability to veto legislation and line items in the budget makes her the chief policymaker, and a big part of the state’s business is determining how much to tax and where to spend. So how is state tax and spending policy different now compared to eight years ago, before the governor took office?
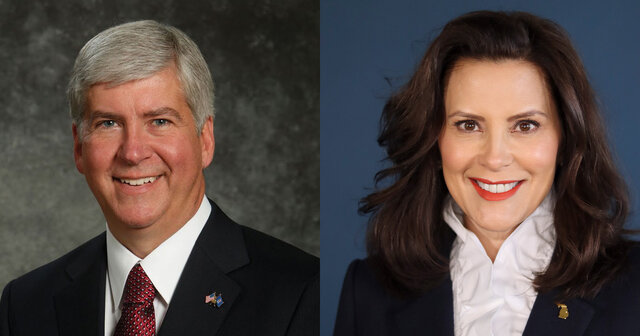
The trends in state taxing and spending are remarkably similar to those of her predecessor, Rick Snyder, a judgment I am sure will please no one. When you look at how much the state budget grew and where the money went during each governor’s tenure, broad forces far beyond the governor’s political party play a substantial role.
Fiscal policy makes up only a portion of a governor’s record, and other policy questions can have their own, substantial impact. Snyder signed a right-to-work bill into law while Whitmer repealed it, for instance. There have been many other such reversals, so the two governors are not the same. Still, in fiscal policy, they have many similarities.
State spending is up over Whitmer’s term. The new budget authorizes $50.3 billion to be spent from state sources (which excludes federal funds), up from $33.1 billion in her first budget. This is a 14% increase when adjusted for inflation.
The top expenditures from state funds are for schools and Medicaid, and spending increased more on these priorities than on any other. State spending on the school aid budget increased by $6.0 billion, an 8.5% increase when adjusted for inflation. The Health and Human Services budget, which includes the state’s portion of financing Medicaid, grew by $4.1 billion, a 15% increase when adjusted for inflation. One of the reasons that state lawmakers spend so much on Medicaid is that spending state dollars on it brings in even more federal matching funds. While state funding for the department increased by $4.1 billion, federal funding for it increased by $9.1 billion, or an 11% increase with inflation.
Funding is up for schools, but the number of kids in public schools has dropped by around 100,000 students over Whitmer’s terms. Total school funding, including from all local, state and federal sources, increased from $15,200 per student to $23,900 per student, a 22% gain when adjusted for inflation. It’s a pity that increased spending didn’t improve state performance. Michigan’s fourth grade reading scores dropped from 32nd in the nation to 44th over Whitmer’s time in office.
While the number of people eligible for Medicaid increased from 2.5 million people to 3.2 million people following the pandemic, it has since dropped back to 2.5 million people. Trends for Medicaid enrollees are similar. In other words, enrollment has returned to its pre-pandemic level, but the state spends even more.
Fixing the roads was the cornerstone of Whitmer’s 2018 campaign. She can take some credit for making progress on that pledge. State transportation funding increased from $3.6 billion to $6.0 billion, a 25.3% increase after inflation. The percentage of reviewed roads deemed in good or fair condition increased from 61% to 68%. Administrators expect that they are fixing roads as fast as they deteriorate.
The increase in road quality comes from making roads a priority for the state’s growing revenue. Whitmer’s early request for $2.5 billion in tax hikes to spend $1.9 billion on roads didn’t get legislators’ approval. No legislator even introduced a bill to do what Whitmer asked. Lawmakers did shift the sales tax — which largely went to schools — to a per-gallon tax on fuel, which is mainly spent on roads. But since the replacement tax raises a similar amount of revenue as the sales tax, so few people have noticed a difference at the pump.
The amount of spending on pork projects, where individual legislators direct money to local governments and nonprofits of their choice, increased substantially during Whitmer’s two terms. Her eight budgets authorized $4.6 billion in such projects.
Schools, Medicaid, roads and pork were her major budgetary priorities. She also made fiscal policy through the tax code.
Lawmakers approved an increase in marijuana taxes in the 2025 legislative deal, with the revenue going to roads. But that and other tax hikes were a minor part of the compromise. Of the increase in spending on roads, 80% came from repurposing existing taxes and 20% came from tax hikes.
Indeed, replacing the sales tax on fuel with a fuel tax was the biggest change in tax policy during her time in office, and even that switch was close to revenue-neutral. Lawmakers made only a few other changes. The sales tax remains at 6%, the income tax at 4.25%, the corporate income tax at 6% and cigarette taxes at $2 per pack.
The Mackinac Center filed a legal challenge to Whitmer’s interpretation of an income tax trigger that brought the rates back up to 4.25% after being down to 4.05% for a year, but her views prevailed in court.
Whitmer increased the state’s Earned Income Tax Credit, which provides tax credits against the income tax for families with children, even those with middle class incomes. As a “refundable” tax credit, families may receive a check rather than merely see their tax obligation decrease. The threshold for the credit increased from 6% of federal levels to 30% of federal levels. (Just don’t call it a tax cut.) She also exempted pension income — but not other types of retirement income — from state income taxes.
Whitmer found money for business subsidies, largely outside of the normal budget process. She has authorized $8.6 billion for that purpose, and only $1.1 billion was through the budgets initially approved each year. Much of the money comes through supplemental spending bills and through tax code changes.
For instance, the latest addition to the Mackinac Center business subsidy scorecard was a law that authorizes $1.6 billion in “tax capture” to be paid to developers. What is tax capture? Cash. But it’s not something that gets its own line item in annual budgets.
Michigan’s subsidy apparatus is also another area where extra money did not lead to better outcomes. Companies that received one of Whitmer’s major deals promised to create 20,595 jobs. But thus far, they have delivered 602 jobs, according to the latest state reports.
Whitmer increased the state’s transportation debts, though the larger debts for unfunded pension debts declined. Combined unfunded liabilities for the school and state pension funds declined from $39.2 billion to $29.2 billion. The debts would have been even less had the governor not redirected pension debt payments to her other priorities. It’s good that the state is catching up on its debts under Whitmer, but she made no special effort to pay down pension debt.
If we look past basic partisanship, the records show Whitmer’s similarities with her predecessor, Rick Snyder.
On the broad strokes, the size of the state budget increased by similar amounts during both administrations. State spending increased by 14% in Whitmer’s two terms compared to 11% in Snyder’s two terms. Each administration saw many changes in tax policy, economic growth, and legislative leadership. Even so, their bottom line spending increases show that they increased the budget by more than inflation, and by similar amounts.
Whether the state taxes and spends more than the rate of inflation demonstrates each governor’s position on the growth of the state government, and the two governors enacted similar spending increases.
Their priorities for extra spending were the same: roads, schools and Medicaid. Road funding increased from $2.0 billion to $3.6 billion during Snyder’s terms, a 62% increase when adjusted for inflation. Road funding increased from $3.6 billion to $6.0 billion in Whitmer’s terms, a 25% increase when adjusted for inflation. State spending on schools is up 9% during Whitmer’s tenure compared to 7% in Snyder’s. Spending on the Department of Health and Human Services was up 27% during Snyder’s time in office and 15% during Whitmer’s.
Both raised taxes to pay for roads, but mostly they increased road funding without tax hikes.
Here is a smaller but noteworthy similarity: They both grew the rainy day fund by $1 billion.
Whitmer largely continued the tax policies enacted by Snyder. Notice that while Whitmer reversed many laws enacted during the Snyder administration, she did not change the state’s business tax policies. Snyder replaced the Michigan Business Tax with a corporate income tax that raised much less revenue. Whitmer continued this policy. Other major state taxes — the personal income tax, the sales tax, the State Education Tax — are levied at the same rates as when Snyder left. Even the state Supreme Court says that the income tax phase-down is a continuation of a policy enacted during the Snyder Administration.
Where there are differences in tax policy, it is not on rates, but preferences in the tax code. Whitmer gave income tax exemptions for pension income but not for other retirement income, Snyder’s tax changes gave exemptions for all senior income. Whitmer increased the Earned Income Tax Credit, and Snyder decreased it.
Whitmer also continued rather than reversed state pension funding policy. Snyder began prefunding retiree health care benefits in the state systems, and such benefits have been fully prefunded during Whitmer’s term.
There are significant differences between the governors’ fiscal policies, however.
There was only $113 million in pork projects authorized during Snyder’s term compared to $4.6 billion in Whitmer’s term.
Whitmer cared more than Snyder about business subsidies and corporate welfare. Snyder signed $2.5 billion in business subsidies into law; Whitmer signed $8.6 billion into law.
Snyder didn’t have to deal with the COVID-19 pandemic, nor the extra money from the federal government that went with it.
The amount of outstanding bonds for transportation decreased from $1.5 billion to $500 million in Snyder’s term and increased to $2.8 billion in Whitmer’s term.
These differences in fiscal policy are important but are relatively small, considering the $50 billion and more the state authorizes in taxes and spending each year.
Note that this is the record of the policies authorized. It is not a review of what their ideal policies may have been. Governors are restrained. They don’t always get what they ask for, and legislators get to write the laws that the governor signs into law. Whitmer saw her party have majorities in the Legislature for only two years while Snyder had party majorities for all eight years. Perhaps their fiscal policies would have diverged more had the legislatures been different during their terms.
Still, total spending increased by similar amounts under both governors. And their top spending priorities were the same. That is remarkable.
There are reasons for the similar records, despite the partisan differences. Michigan operates with a balanced budget requirement, and lawmakers tend to authorize as much as they collect in revenue. Basic tax policy remained unchanged during the Whitmer administration, and thus the spending trend was largely explained by economic trends. Policymakers cut taxes during the Snyder administration, but economic growth generated similar levels of revenue growth under both governors.
It is unsurprising that schools and Medicaid were the biggest spending priorities in both administrations because the politics behind the spending are similar. More school funding was popular during the 2010s and remains so in the 2020s. Matching funds from the federal government remained a potent factor in Medicaid during both governors’ terms.
Their positions on road funding were also similar. Both Whitmer and Snyder faced expected declines in the quality of roads around the state without finding more resources. Both governors asked for tax hikes but didn’t get them. Both found compromises with legislators that largely increased road funding without raising taxes.
When state taxes generate more revenue, there is little demand to increase taxes further, which can explain why Snyder’s tax policies continued through Whitmer’s tenure. Whitmer made a series of calls to increase some taxes — fuel taxes, landfill taxes, digital advertising taxes — but could not get legislators to enact them. She also did not ask legislators to raise taxes during her Democratic trifecta years. Lawmakers then had lots of revenue available from state surpluses, robust economic growth, and extra revenue from federal COVID transfers, all decreasing the political demand to increase taxes.
In other words, getting legislators to vote for tax hikes is hard even for Democratic legislators who might be more sympathetic to tax hikes than Republicans. Balanced budget requirements mean that state fiscal trends tend to be set by economic factors outside of a governor’s discretion.
Economic forces, political opportunities and popularity are important factors that determine policy. Governors get to act differently within an environment but are subject to the same climate.
While the rhetoric employed by both governors is very different, their records are similar if we look at the broad strokes of their taxing and spending policies. The state’s fiscal policies resemble where they stood when Whitmer’s era began. She increased state spending by a similar amount as her predecessor and spent the increases on largely the same things.
Get insightful commentary and the most reliable research on Michigan issues sent straight to your inbox.

The Mackinac Center for Public Policy is a nonprofit research and educational institute that advances the principles of free markets and limited government. Through our research and education programs, we challenge government overreach and advocate for a free-market approach to public policy that frees people to realize their potential and dreams.
Please consider contributing to our work to advance a freer and more prosperous state.