Cigarette smuggling is a significant and growing challenge for policymakers. Intended to reduce smoking and generate revenue, high excise taxes create powerful incentives for tax evasion and avoidance. This illicit trade undermines public health goals, deprives governments of substantial revenue and distorts legal markets. This report quantifies the extent of the problem through 2023 and highlights how state and federal policy — including flavor bans and cigarette tax hikes — have reshaped smuggling patterns nationwide.[*]
California now tops New York as America’s top inbound smuggling state.[†] New York had long been America’s king of smuggled cigarettes. California raised cigarette taxes by $2.00 per pack in 2017 and banned popular flavored cigarettes like menthol in late 2022. These policies created large incentives for people to smuggle more cigarettes into the Golden State.
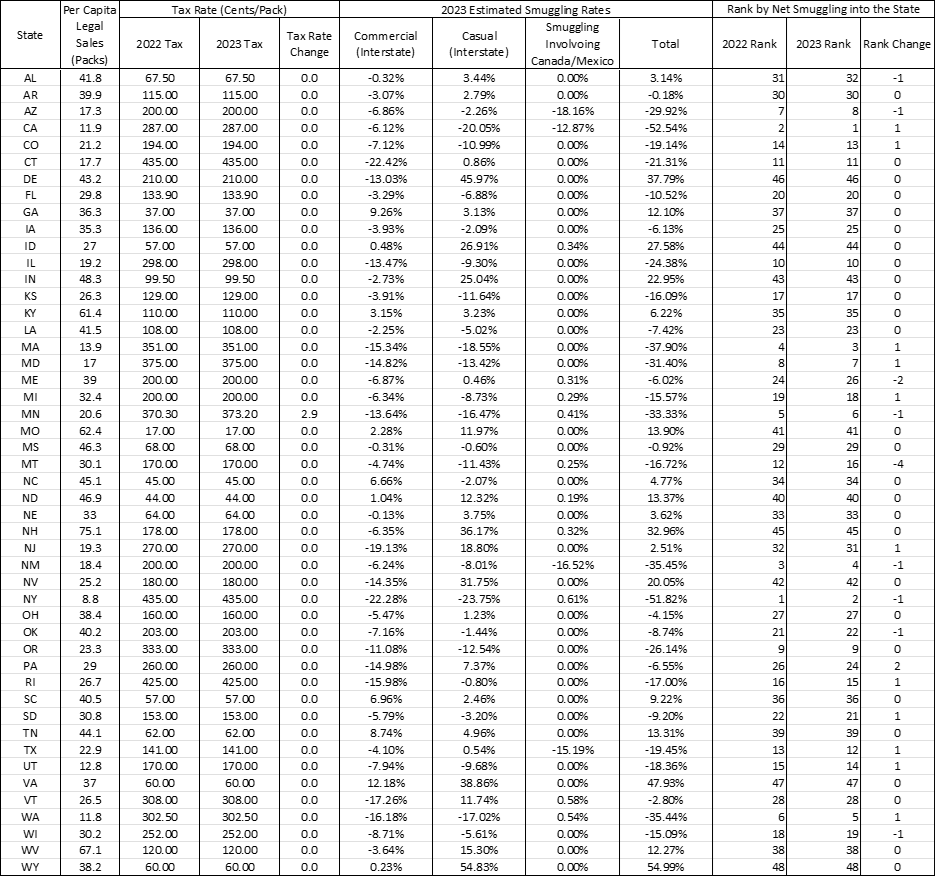
Using data through 2023, our most recent estimates shows that California (53%), New York (52%), Massachusetts (38%), New Mexico (36%) and Washington (35%) have the highest inbound smuggling rates. Prohibitions on flavored products, such as menthol cigarettes in Massachusetts and California, contributed to those states’ high smuggling rates. Our model estimates that banning the sale of menthol flavored cigarettes leads to an increase in smuggling into the state by 26 percentage points.
The top five export states for smuggled cigarettes are Wyoming (55%), Virginia (48%), Delaware (38%), New Hampshire (33%) and Idaho (28%). For every 100 cigarettes purchased and consumed in Wyoming, an additional 55 are smuggled out. For every 100 cigarettes bought and smoked in Virginia, another 48 are smoked elsewhere, and so on.
Our model also enables us to estimate the impact of smuggling on states’ tax revenue. The top five states for excise tax losses due to smuggling are California, New York, Texas, Illinois and Minnesota. California loses nearly $1.5 billion each year from untaxed, smuggled cigarettes. New York is second, missing out on $813 million in potential tax revenue.
On the opposite end of the spectrum are states that generate more revenue thanks to cigarettes purchased there for the purpose of smuggling. Virginia, Indiana, New Hampshire and Delaware rake in tens of millions. Virginia’s treasury gained more than $62 million and Indiana received $61 million in 2023.
Michigan’s smuggling rate is now below 16%, a much lower figure than estimates indicated in previous years. Our 2008 report showed the state’s smuggling rate to be nearly 35% of total consumption. That has drifted downward as other states hiked their cigarette taxes, sometimes dramatically. Michigan has held its cigarette tax at $2.00 per pack since 2004.
The findings presented here reinforce that steep tax differentials, product prohibitions and regulatory restrictions drive illicit markets. Policymakers should weigh these unintended consequences when considering new tax increases or bans on tobacco products. Excessive taxation and prohibitions lead to negative unintended consequences, such as reduced tax revenue and large-scale and dangerous smuggling effort.
[*] The Mackinac Center for Public Policy has published three previous reports in concert with the Tax Foundation on the subject of cigarette taxes and related smuggling since 2008. This fourth study is designed to update that work. It reflects the many changes in cigarette excise tax rates, our own use of North Carolina as a source state for long-distance smuggling, new products, regulations and consumer preferences since 2016, the year of our last full study.
[†] Each study performed by the Mackinac Center contains a statistical model that attempts to isolate the degree to which tax evasion and avoidance (what we call "smuggling") occurs in the United States and from Mexico or to Canada.
The Mackinac Center for Public Policy published its first study about cigarette tax evasion and avoidance — what we call “smuggling” — in 2008.[1] It used a robust statistical model to measure cigarettes smuggling in the United States. In cooperation with the Washington, D.C.-based Tax Foundation, we published updated results based on this model. This is our fourth full report on cigarette taxes and smuggling.
Cigarette taxes are meant to discourage smoking and raise tax revenue for state governments. But the large differences in tax rates among states create incentives for tax evasion and avoidance. This tension between revenue generation, public health goals and market distortions is key to understanding the illicit cigarette trade in the United States.
We have updated the results of our model’s output each year as publicly available data becomes available. The model relies on data that is lagged by two years. In addition to these smaller, annual updates, we have published full studies on cigarette smuggling in 2010 and 2016.[2]
This edition updates our annual estimates but with a tweak to our statistical model to better reflect market realities. These include accounting for flavor prohibitions and the increasing popularity of vaping. We also modified how the model calculates the impact of source states — those that smugglers use as a source for purchasing less expensive cigarettes due to these states’ relatively low tax rates.
The increasing popularity of nicotine vaping products is an issue that needs to be addressed more fully. Vaping rates affect sales, consumption and tax revenue of combustible cigarettes. These vaping products are also smuggled with combustible cigarettes and other tobacco products.
Early evidence indicates that both flavored combustible cigarettes and flavored vaping products are finding their way into markets where they are prohibited, such as Massachusetts and California. Evidence from California suggests that nearly as many people are using these illegal products as were before the prohibition took effect. Many of the smuggled goods are of international origin.
Recent academic research on cigarette smuggling continues to demonstrate that the United States maintains a sizeable market in smuggled cigarettes. Publicized large arrests also provide a lengthy stream of anecdotal evidence of an active illicit market.
The persistence of smuggling underscores the limits of tax policy as a tool for behavior change. This study shows how illicit trade patterns respond to state and federal policy changes. It provides policymakers with a framework for anticipating and potentially mitigating the unintended consequences of tax and regulatory decisions.
The statistical model deployed for this study is known as a residual model. It calculates the difference between how many cigarettes are purchased legally in a state, based on the tax data generated from these sales, and what people report on federal smoking surveys. Sales data from one state, for instance, might show that state residents purchased 100 million packs of cigarettes in a year, but survey data about smoking rates might suggest that 150 million packs were smoked in that state. If there were no smuggling, these numbers would be the same. But there is a large difference between these two figures in many states. The difference between the two — our residual — must be explained. We, and other scholars, lay it at the foot of tax evasion and avoidance.
The model categorizes cigarette trafficking into two types: casual and commercial. Casual smuggling involves the purchase of cigarettes in lower-taxed jurisdictions (state, reservation, country) for personal use. Some states, like Minnesota, tolerate a small amount of cross-border cigarette shopping, while other states do not.[3] Commercial smuggling refers to delivering large shipments of untaxed cigarettes or ones purchased from lower-taxed states to higher-taxed states.
The model accounts for the impact of state prohibitions on tobacco products, such as bans on menthol and minty flavored cigarettes. We also changed how the model deals with source states for commercial smuggling. It no longer uses North Carolina as a representative source state to measure commercial smuggling.[*] We instead use the average tax rate of six tobacco-growing states with relatively low cigarette taxes. These are Virginia, Maryland, Georgia, North Carolina, South Carolina and Kentucky. These tweaks improved the model but did not dramatically impact the results.
In addition to these changes, we feel compelled to explain the impact of smuggling at the Mexican border. The border is crossed with illicit product and not just into the United States from Mexico. Research and recent reports show that the United States has been the source of illicit product smuggled into Mexico, some of which — according to the General Accountability Office — has been smuggled back into the United States.
Mexico is also important to our discussion for another reason. We have long believed — and reported — that our statistical model may misattribute a portion of inbound cigarette traffic to the United States-Mexico border. It is possible, even probable, that much in the way of international traffic showing up in our model’s output is actually passing through the American Southwest’s system of bonded warehouses, duty free stores and Free Trade Zones.
The model and recent changes are explained more fully under the section titled, “Appendix A: The Econometric Analysis.”
[*] When we wrote our first study, North Carolina charged just 35 cents in excise taxes per pack. It also had no tax stamp affixed to cigarette packs. This meant that there was no identifying feature to show that taxes had been paid on the product. This made it easier for smugglers to resell cigarettes from North Carolina in other states with no tax stamp or by affixing a low-tech counterfeit stamp to fool buyers and law enforcement. North Carolina also appeared in other academic literature as a source state for low-cost cigarettes that we reviewed while building our model. Orzechowski, William and Walker, Robert, “The Tax Burden on Tobacco: Historical Compilation Volume 59, 2024,” Orzechowski & Walker, 2025, v.; Jerry G. Thursby and Marie C. Thursby, “Interstate Cigarette Bootlegging: Extent, Revenue Losses, and Effects of Federal Intervention” (National Bureau of Economic Research, June 1994), https://perma.cc
This literature review covers pertinent academic research published between the start of 2016 through Nov. 15, 2025.[*] The review below is presented in reverse chronological order.[†]
“Cigarette Trafficking in New York City: Now and Then” was published in the journal Tobacco Control in 2025. Seven scholars from the Rutgers Institute for Nicotine and Tobacco Studies and Rutgers School of Public Health collaborated to produce it.
The methodology for this study replicates the research methods used by previous scholars’ discarded-cigarette-pack analyses in New York City. This was done to provide a longer timeline for measuring any changes in tax evasion and avoidance. The researchers collected discarded cigarette packs across 30 census tracts in the five New York City boroughs in February 2024 and then examined each pack for a tax stamp to determine if and where taxes were paid on the cigarettes.[4]
One in six (17%) of the littered packs they collected bore the proper city tax stamp.[5] This is a new low, dropping from 39% having the correct stamp in 2011 to 24% in 2015, according to previous collections in New York City.[6]
One in five (20%) packs had no tax stamp at all. But of the other 80%, about half had stamps from distant states or countries. Nearly 30% of the packs collected contained a Georgia tax stamp and 21% came from Virginia.[7] Many of these packs were likely smuggled into New York illegally.
The newest study reports a shift in the source of discarded cigarette packs in New York City. Native American Nation reservations and smokes from Virginia were primary sources, but now that honor falls to the state of Georgia. Of the 252 cigarette packs collected for the 2024 analysis, 28% bore the Peach State’s tax stamp. Virginia tax stamps made up another 21% according to the authors.[8]
The majority (52%) of cigarette packs collected were menthol, a similar finding to a 2015 study.[9] Nearly half of these packs had no tax stamp. Compared to previous collection efforts, there were more menthol packs without a local tax stamp. Researchers also report that the source of menthol cigarettes had changed over the years, however, and that non-local menthol cigarettes were a more dominant feature of collected packs. The authors report that the percentage of discarded packs with the proper local stamp was half that of the 2015 study.[10] Menthol cigarettes are popular tobacco products that are increasingly considered for prohibitions by governments. They will remain a priority for smugglers as a result.[‡]
The findings from this report are important to the updated statistical model used in this latest Mackinac Center report. We tweaked the methodology for handing source states of smuggled cigarettes and for the impact of bans on menthol cigarettes.
The journal Health Economics published “Understanding the Demand-Side of an Illegal Market: A Case Study of the Prohibition of Menthol Cigarettes” in 2025.[11] The authors performed a case study on menthol cigarette bans. Nineteen million Americans smoke menthols, according to the authors.[12] The authors examined the demand for this product by conducting an online survey of adult menthol smokers.[13] Participants were asked what alternatives they would choose if menthols were made illegal, such as non-menthol cigarettes, electronic cigarettes and quitting.
The results suggest that a prohibition on menthol cigarettes “would substantially increase the fraction of menthol smokers who would attempt to quit tobacco product use.”[14] Researchers also found, however, that the demand for illegal menthol products would remain high.[15] They estimate the illegal market for menthol cigarettes could be 59% to 92% the size of the current market and 69% to 100% the market if menthol e-cigarettes are also illegal.[16]
A 2023 study by the consultancy WSPM Group conducted a discarded-packs analysis of California for industry participant Altria Group, Inc. This was after the Golden State imposed a $2 cigarette tax increase in 2017. It also banned menthol and other flavored tobacco products starting in late 2022. The discarded packs analysis collected 15,000 packs from 10 California cities, across 192 ZIP codes, from May through June 2023.[17]
The study found about 28% of the packs were “non-domestic” in origin, with 4% coming from China. Another quarter of the discarded packs were domestic but contained no tax stamp. About 45% of the cigarette packs with tax stamps came from somewhere other than California.[18] Nevada was the top source state, representing 2% of collected packs with tax stamps. Packs with non-domestic stamps totaled 37%, the majority of which were bought in duty-free shops, both in United States and worldwide.[§]
About 21% of packs collected in the WSPM Group survey were either menthol or synthetic menthol cigarettes.[19] Given California’s outright prohibition on selling menthol cigarettes, this figure is particularly striking. Menthol cigarettes made up 25% of legal sales in California prior to the flavor ban, yet the percentage of discarded packs found in 10 Golden State cities was nearly at that level six months after they were made illegal.[20]
“Changes to the Littered Cigarette Pack Environment in New York City between 2011 and 2015,” is a 2020 paper that collected discarded cigarette packs across 30 New York City Census tracks in 2011 and 2015 to measure changes in two time periods, both before and after a 2013 city law mandated a minimum price of cigarettes per pack of $10.50.[21]
The authors reported that packs that were missing the proper city tax stamp increased from 61% of the total packs examined in 2011 to 76% in 2015. Those with unknown or foreign stamps grew from 12% of the total in 2011 to 31% in 2015. The study concluded that trafficking in New York City of cigarettes sourced in the United States increased from 2011 and 2015 as did consumption of foreign sourced cigarettes.[22]
A 2022 study published in Crime, Law and Social Change titled, “Tax Evasion and Illicit Cigarettes in California: Prevalence and Demand Side Correlates,” also examines cigarette pack stamps. It surveyed adult smokers online between March 10 and March 30, 2017.[23] The survey was conducted prior to the Golden State’s imposition of a $2 tax hike on cigarettes and a 2022 ban on flavored products, such as menthol cigarettes.[24]
Researchers found that as much as “one-third of cigarette packs may lack a valid tax stamp and that between 18 and 25% of smokers avoided taxes by bringing cigarettes into the state from elsewhere." Over the course of a year, 36% of smokers avoided taxes by purchasing cigarettes without a California tax stamp.[**]
The study survey also asked questions about electronic cigarette usage, which is prudent to mention here due to the increasing popularity of the product. The study found that those who smoke both combustible cigarettes and use e-cigarettes “are twice as likely to report avoiding taxes and three times as likely to report having purchased possibly untaxed or counterfeit product as smokers who do not use e-cigarettes.”[25]
Another discarded-packs study, titled “Empty Discarded Pack Data and the Prevalence of Illicit Trade in Cigarettes,” was published in 2017 by the consultancy BOTEC Analysis, LLC. It employed a unique dataset collected by Market Survey Intelligence to perform discarded-pack surveys between 2010 and 2014 at the request of Altria Client Services, LLC. The data from those is the backbone of the report’s analysis.[26]
That study provides a range of estimates of tax avoidance and a “minimum verified level of [illicit trade in tobacco products]” in 10 U.S. cities. The minimum level only includes untaxed cigarettes – those lacking a "genuine tax stamp."[27] It does not include “inter-jurisdictional bootlegging of taxed cigarettes, product intended for foreign markets, or brands suspected of being manufactured for illicit sale.”[28] This method is the most conservative approach to measuring illicit trade in tobacco, according to the authors.
They also create broader estimates based on two assumptions and an upper bound estimate of illicit trafficking in tobacco. Their method was based on a 2014 study titled, “Cigarette Trafficking in Five Northeastern US Cities” and published in Tobacco Control. The broader estimates account for "counterfeits, illicit whites, and packs with no stamp, some packs from nonadjacent states ... as well as some foreign packs, intrastate bootlegging to evade local taxes, and cheap whites.”[29] Each measure using different assumptions helps the authors provide a plausible range of illicit trade in tobacco products.
The authors found their verified level of illicit trade was highest in Buffalo at 31% and in New York City at 14%. The more conservative but broader estimates showed the top two cities with illicit tobacco products were, at 40%, New York, and, at 37%, Buffalo.[30] A still broader estimate produced figures of 59% in New York and 40% in Buffalo. The authors’ upper bound estimates for illicit trade tobacco products were highest in Chicago at 70% and New York at 74%.[31]
“Tax Avoidance and Evasion: Cigarette Purchases from Indian Reservations Among US Adult Smokers, 2010-2011” is a 2017 paper published in Public Health Reports. The authors used a sample of nearly 24,500 smokers collected in the 2010-2011 Tobacco Use Supplement to the Current Population Survey to provide state-specific rates at which smokers report buying cigarettes in Native American reservations. This is sometimes referred to as “casual” smuggling, because individuals are evading taxes only on cigarettes for their own personal consumption.[32]
The authors find that nationwide about 4% of non-Native American cigarette smokers report buying from Native American reservations. In six states, at least 15% of smokers report buying cigarettes there. These states are Arizona (21%), Nevada (15%) New Mexico (25%), New York (16%), Oklahoma (30%) and Washington (18%). Michigan, home to the Mackinac Center, saw less than 1% of smokers report having bought cigarettes from Native American reservations.[33]
[*] Each previous study contains its own literature review should the earnest scholar wish to examine a longer sweep of studies published on the subject of cigarette smuggling.
[†] The original 2008 model was built around a lengthy review of academic literature and followed by a peer review by scholars who were unknown to the authors. Each following study also contains a plain language review of academic journals and other articles about cigarette taxes and smuggling.
[‡] The U.S. Food and Drug Administration in 2022 published a proposed regulation to prohibit the flavor menthol in combustible cigarettes nationwide. Given the popularity of menthol flavor this prohibition drew attention of scholars and others. Indeed, during the FDAs comment period on the proposed regulation 175,539 comments were submitted to Regulation.gov, highlighting a number of aspects about the proposed move. These included comments from Mackinac Center for Public Policy and the Washington D.C.-based Tax Foundation, authors of this and previous smuggling studies. Michael LaFaive and Todd Nesbit, “Food and Drug Administration’s Center for Tobacco Products Written Comments for Tobacco Product Standard for Menthol in Cigarettes and Characterizing Flavors in Cigars” (Mackinac Center for Public Policy, July 1, 2022), https://www.mackinac.org
[§] A duty-free shop is one that is exempt from local taxes and can be found on borders and in airports. Illicit cigarette trafficking via duty free stores is a concern identified by the United States General Accountability Office in its own study, which will be reviewed further below. “Empty Packs Survey: USA-CA Q2 2023,” WSPM Group, August 2023, 15, https://perma.cc
[**] The use of the survey approach allowed the researchers to also include demographic characteristics of those who have knowingly engaged in tax evasion and avoidance or believed their source had done so. They report that the results varied but “generally speaking men, younger smokers, those with higher income, high-volume smokers and consumers of menthol cigarettes and e-cigarettes are more likely to engage in some of the suspect behaviors examined.” James E. Prieger, “Tax Evasion and Illicit Cigarettes in California: Prevalence and Demand-Side Correlates,” Crime, Law and Social Change 78, no. 4 (2022): 431, https://doi.org
Mexico is both a recipient of illicit cigarette trafficking and a source of it. Our statistical model of cigarette smuggling contains two variables to measure imports from Mexico and exports to Canada.
According to the model, states bordering Mexico or containing Native American reservations experience significantly more smuggling compared to other states. This is especially true for border and reservation states with higher tax rates. Holding all else constant, a one-dollar tax increase in a state with Indian reservations is associated with an increase in smuggled cigarettes per capita of four percentage points. The same tax increase in a state bordering Mexico increases in-bound smuggling of eight percentage points.
We encourage caution when attributing the entire response to smuggling from Mexico into the U.S. The large number of duty-free stores along the U.S.-Mexico border, custom bonded warehouses and Free Trade Zones along major interstates across Southwestern states are likely contributing to this underground economy as well.[*]
[*] We have long known that law enforcement and others believe that it is possible that the bulk of illicit cigarettes our model ascribes to Mexico may be coming from these facilities. Understanding these facilities is crucial because they may explain our model’s measurements along the Mexican border.
A Free Trade Zone is a specific geographic area in the United States where goods being imported or exported may remain for a time without paying taxes or customs duties, including while goods are manufactured or processed before entering into U.S. commercial streams. A custom bonded warehouse is a facility licensed and monitored by Customs and Border Protection that may act as a weigh station for goods being imported or exported. Goods that are being imported for the express purpose of being re-exported may avoid duties and other taxes altogether. This is known as the “in-bond system.”
The United States Government Accountability Office produced in 2017 a lengthy report of illicit cigarette trafficking at the border and zeroed in on duty-free and bonded warehouses as sources of traffic.[34] Eighty-eight such stores and warehouses dotted the Southwestern border across Texas, California, Arizona and New Mexico.[35] Federal agencies had long recognized that duty-free stores along or near the border may be a source of legal purchases that may get illegally diverted to avoid duty and tax payments.[*]
Duty-free stores in Texas were the dominant sellers of cigarettes. The 2017 report noted that between 2010 and 2015 there were more than 12,800 duty free cigarette transactions exceeding $2,500 each, outpacing other states by a wide margin. New Mexico only had 45 such transactions.[36]
The report identified three major ways U.S. and Mexican taxes are evaded: “(1) diversion from a duty-free store into U.S. commerce; (2) smuggling into Mexico through U.S. ports; and (3) smuggling back into the United States after export to Mexico.”[†]
A 2009 study published in Applied Economics, titled “Demand for Cigarettes in the United States: Effects of Prices in Bordering States and Contiguity with Mexico and Canada,” looked at demand for cigarettes along the U.S. border. The authors found that “having a border with Mexico lowers legal sales in the state sizably,” even when they control for the proportion of the state population that is Hispanic or Latino.[37] They did this to ensure their statistical model is not capturing “the cultural factor of lower smoking among the Latino/Hispanic population.”[38] They believe “that price and non-price factors on the Mexican side of the border are favorable enough for smokers to generate a substantial movement of cigarettes into the adjacent U.S. states.”[39] By nonprice factors the authors speak of availability of different brands and “easier access to youth.”[40]
In addition to using this type of land-based smuggling, smugglers also frequently employ container ships to move product through U.S. ports. In one recent case, two women attempted to smuggle 150,000 cigarettes into California from Mexico through the Long Beach Cruise Ship Terminal via a cruise ship. Customs and Border Protection discovered cigarettes separated into 10 pieces of luggage. The majority were popular U.S. brands, and most of them were menthols. Menthol cigarettes are prohibited for sale in the Golden State, making them a more profitable smuggling item.[41]
[*] This was not the first time the Government Accountability Office addressed this issue. In 1998, it reported that international smuggling was occurring along the border and that the Bureau of Alcohol, Tobacco, Firearms, and Explosives pointed to these duty-free stores “as the primary source of smuggled cigarettes.” “Tobacco Trade: Duty-Free Cigarettes Sold in Unlimited Quantities on the U.S.-Mexico Border Post Customs Challenges” (United States Government Accountability Office, October 2017), 1, https://perma.cc
[†] “Tobacco Trade: Duty-Free Cigarettes Sold in Unlimited Quantities on the U.S.-Mexico Border Post Customs Challenges” (United States Government Accountability Office, October 2017), https://perma.cc
Large smuggling busts provide anecdotal evidence of the proliferation of the illicit cigarette trade. One high-profile case involved the operator of a bonded warehouse and duty-free store out of Texas. The U.S. government filed a forfeiture petition to take possession of nearly 300 million cigarettes that were destined for illegal export into Mexico.[42] These cigarettes were acquired from domestic and overseas sources that the petition noted sold “illicit whites,” cigarettes that are not legal in the market to where they are shipped.[43]
Some brands identified in the petition appear to be manufactured exclusively in Mexico, which suggests that they were exported elsewhere first and then redirected to the United States before attempts were made to smuggle them back into Mexico.[44] Some of the cigarettes were counterfeit ones, designed to look like an authentic product.[45]
According to the forfeiture petition, cigarette traffickers would purchase "sea-shipping containers of cigarettes" from sources inside and outside of the United States. They were delivered to Rio Grand Valley Duty Free in Texas, as permitted through the government's “in-bond system." The cigarettes were then "staged for a period of time" in the United States as duty-free products but later driven across the border to be sold in Mexico.[46]
The in-bond system is run by United States Customs and Border Protection that permits goods to move through commercial channels without a prompt payment of duties. This allows, for example, goods to transit from one port to another (imported into one port and then exported out of the country from another) without imposition of duties. It is here that diversion of products often happens and did in this case.
More research is needed to identify the source of smuggled smokes into the U.S. from around the world, including from Mexico. The Mackinac Center for Public Policy has repeatedly requested help from federal agencies — such as Customs and Border Protection and the Food and Drug Administration — to obtain data on cigarettes that flow into and out of the country via ports, bonded warehouses or Free Trade Zones. Two of the authors (LaFaive, Nesbit) have asked that such data be made available to the public so all scholars may use it to estimate illicit trafficking into the United States.
In a letter to the Food and Drug Administration, LaFaive and Nesbit described their multi-year effort to obtain federal data on cigarette shipments entering and leaving the United States.[*] It began with a 2021 conversation in which a senior Customs and Border Protection official indicated such information existed and encouraged the two to file a Freedom of Information Act request. Despite following this advice and providing specific tariff codes, they received only perfunctory responses replies and were unable to reestablish contact.
LaFaive and Nesbit now urge the FDA to use its interagency influence to secure and publicly release these data — ideally including menthol- and vaping-specific categories — so researchers can build accurate baseline estimates of international tobacco smuggling and evaluate how future regulations may affect illicit markets. The data would benefit all scholars, regulators and policymakers by enabling richer, evidence-based research on tobacco control and enforcement.[47]
[*] An excerpt from this letter can be found in “Appendix B: Request to the Food and Drug Administration.”
The market for cigarettes has changed a great deal since the Mackinac Center first published a report about smuggling in 2008. As one example, two states have prohibited the sale of certain flavored cigarettes, including popular menthol cigarettes. The source of illegal cigarettes for smugglers appears to have changed over time, too.
The popularity of electronic cigarettes, or vapes, has increased dramatically. As a substitute for cigarettes, vapes impact demand for both smuggled and legally purchased cigarettes. Future models may need to accommodate this change in the market.
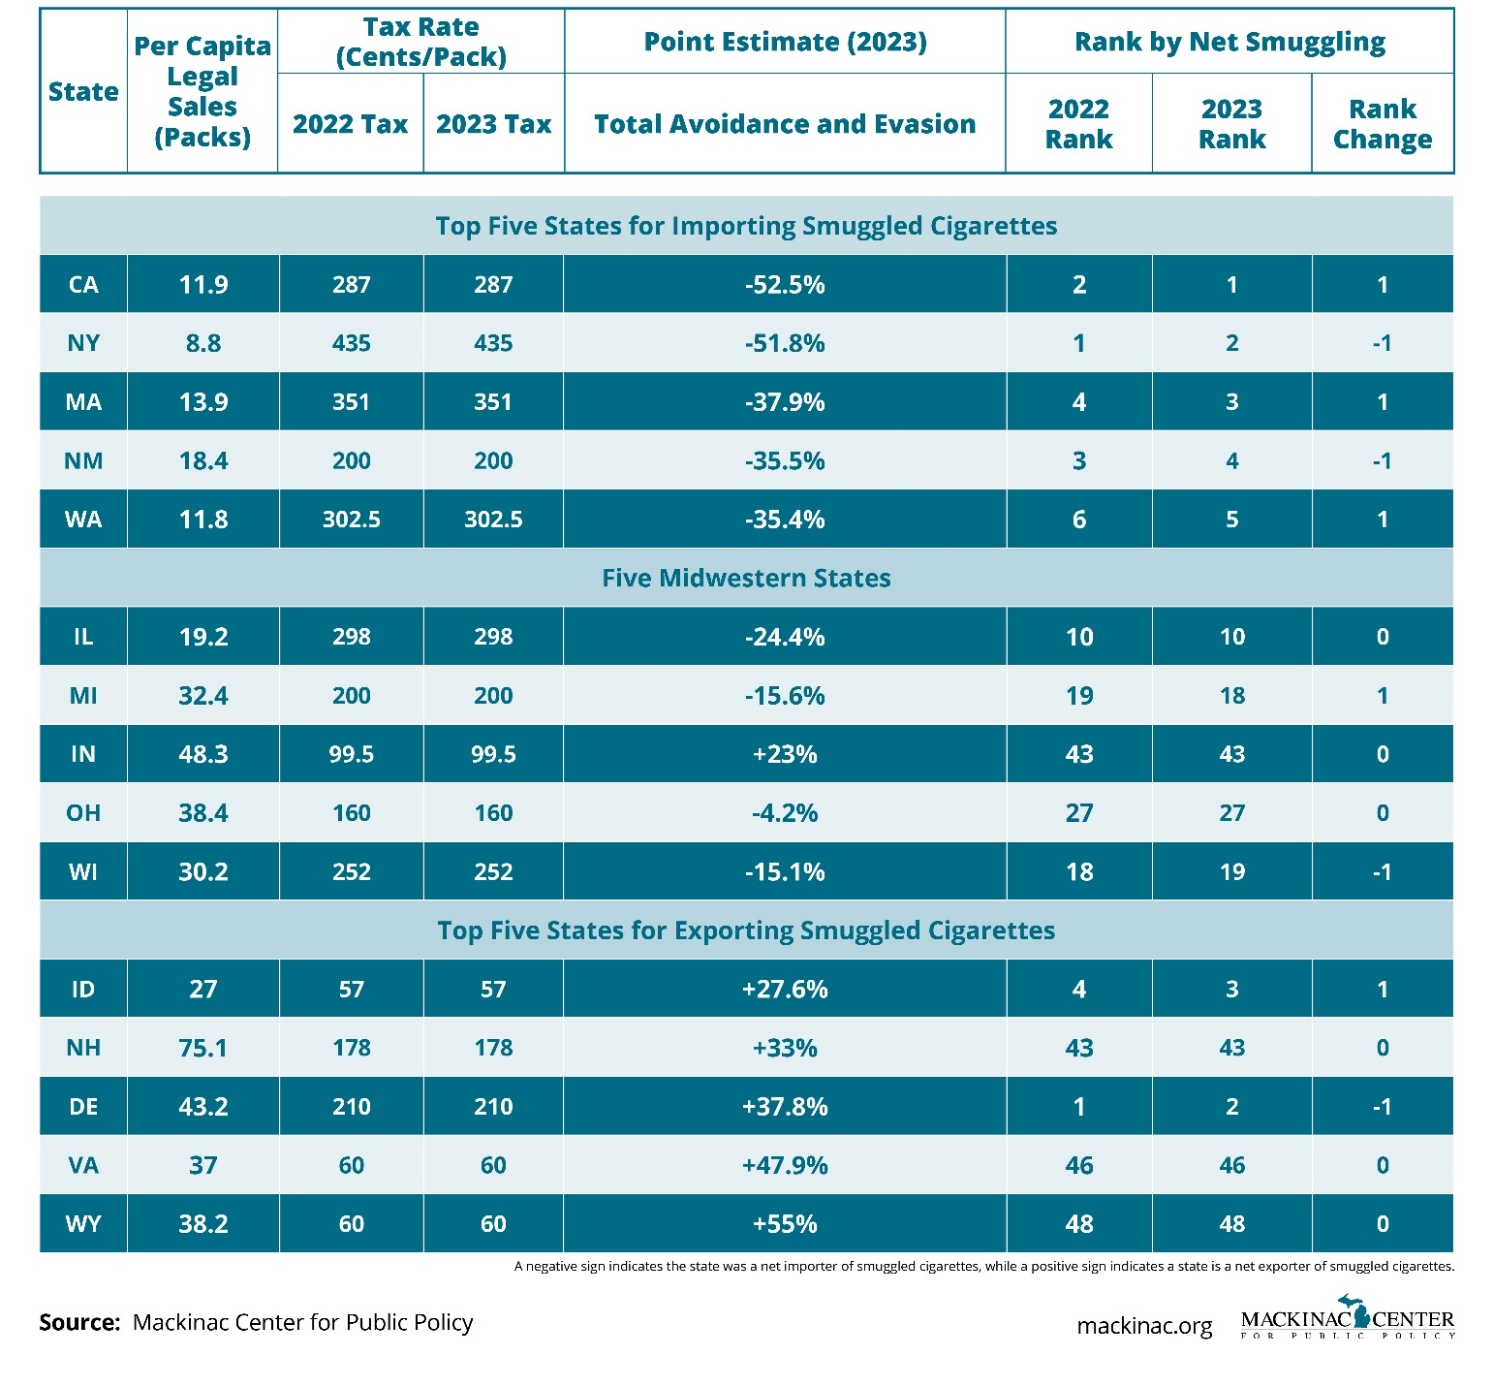
Using data through 2023, our most recent estimates demonstrate that the states with the highest inbound smuggling rates are California (53%), New York (53%), Massachusetts (38%), New Mexico (36%) and Washington (35%).
This study represents the first time that California has topped our smuggling estimates. New York has long been the top smuggling state in the nation. The Golden State knocked New York off its perch likely thanks to the 2017 adoption of a $2 tax hike, combined with a late 2022 ban on certain flavors, including menthol. This ban covered combustible cigarettes and most vaping products.[48]
In Graphic 1, we show the five states with the highest inbound smuggling rates and the five states with the most outbound smuggling, according to our model.
We also highlight the results for the Midwestern states of Wisconsin, Illinois, Indiana, Ohio and Michigan. We do this for three reasons. First, the authors reside in three of these four states. Second, the Mackinac Center for Public Policy is in Michigan. Third, our new model yielded results the reader may find particularly intriguing. For instance, Indiana shows a precipitous drop in legal-paid sales of cigarettes since its July imposition of a $2 per-pack tax increase.
While most states see cigarettes smuggled into them, some states are net exporters of their legally purchased cigarettes. That is, they are a source of lower-priced cigarettes for casual and commercial smugglers.
The top five export states for smuggled cigarettes are Wyoming (55%), Virginia (48%), Delaware (38%), New Hampshire (33%) and Idaho (28%). For every 100 cigarettes consumed in Wyoming, an additional 55 are smuggled out. For every 100 cigarettes consumed in Virginia, another 48 are smuggled out, and so on.
It’s not hard to see why these are top source states. Wyoming’s state excise tax rate is only 60 cents per pack. Five of the six states it borders have higher excise tax rates. The tax rate gap between Wyoming and Colorado, for instance, is $1.64 per pack.[49] There is a lot of money to be saved by shopping in Wyoming.
Idaho is the one state Wyoming touches that has lower cigarette excise taxes. It is closer to California, and its border also touches Washington. It could easily be a supply hub for outbound smuggled cigarettes. Virginia is a low-tax tobacco state and a well-known source for cigarettes smuggled into New York. New Hampshire borders Massachusetts, which has a relatively high cigarette excise tax at $3.51 and has effectively banned the sale of menthol flavored cigarettes.[50]
Michigan’s smuggling rate is now below 16%, a much lower figure than the first estimate using 2006 data. The state’s smuggling rate was nearly 35% then.[51] That has drifted downward over the years as the state’s cigarette tax rate has remained at $2 per pack since 2004. Other states have hiked their own state excise taxes over this period, sometimes dramatically. For example, the state of Illinois raised its excise tax by $1 to $2.98 per pack in 2019.[52]
Indiana recently raised its cigarette excise tax 201% per pack, going from 99.5 cents to nearly $2.995 in July 2025. The newest version of our model estimates that this tax hike would lead Indiana to transition from a net exporter of smuggled cigarettes to a net importer. Through 2023, for every 100 cigarettes consumed in the Hoosier State, another 23 were smuggled out. Our model says that more than 15% of consumption in Indiana going forward will be smuggled in as a function of tax evasion and avoidance.[53]
Legal sales in Indiana have dropped by 34% from June 2025 (just before the tax hike) through September 2025, according to the consulting firm of Orzechowski and Walker.[54] This information is based on tax-paid stamp sales data it collected from the state. This precipitous decline is unlikely to be a result of Hoosiers suddenly kicking the smoking habit overnight. Instead, it is almost certainly a reflection of smokers obtaining their cigarettes (wittingly or otherwise) via tax evasion and avoidance.
We also used our new model to estimate the impact of a proposed Massachusetts cigarette excise tax of $1. This would lift the tax rate from $3.51 to $4.51. The Bay State already has the third highest smuggling rate in the nation at 38%. If this excise tax increase is adopted, our model estimates the rate would leap to 50% of the legal market. Due to the increase in smuggling, expected tax revenues would only increase by 2%, or $6.7 million.[55]
The top five states for casual importers — individuals bringing in untaxed cigarettes purchased elsewhere for personal consumption — are New York (24%), California (20%), Massachusetts (19%), Washington (17%) and Minnesota (17%). The top five exporting states for casual smugglers are Wyoming (55%), Delaware (46%), Virginia (39%), New Hampshire (36%) and Nevada (32%). While New Jersey is not a top five exporting state at 19%, it deserves an honorable mention for one quirky result. Its casual export rate is almost equal to its inbound rate for those cigarettes smuggled commercially, according to our model.
The top inbound rate for those cigarettes smuggled in commercial form — often large-scale operations that move untaxed or low-taxed cigarettes to states with higher tax rates — are Connecticut (22%), New York (22%) New Jersey (19%), Vermont (17%) and Washington (16%). The top export states for cigarettes smuggled out for commercial purposes are Virginia (13%), Georgia (9%), Tennessee (9%), South Carolina (7%) and North Carolina (7%).
Our new model employs the average tax rate of six “tobacco states.” These states have some of the lowest tax rates in the nation and high levels of commercial smuggling. They are Georgia, Kentucky, North Carolina, South Carolina, Tennessee, and Virginia. This provides a better measure of commercial smuggling improves our estimates.
The model also now measures the bans, in Massachusetts and California, on flavored, combustible cigarettes, like menthols. These policies may play role in both casual and commercial trafficking.
We observe that holding all else constant, the average tobacco state smuggles eight percentage points more cigarettes per capita out of the state compared to other states. Further, a one dollar increase in a state’s tax differential with the average tobacco state is associated with a seven percentage point increase in smuggled cigarettes per capita into the state through commercial smuggling.
Bans on flavored products such as menthol cigarettes in Massachusetts and California impact casual smuggling rates in those states. Our model estimates that banning the sale of menthol-flavored cigarettes leads to a 26 percentage point increase in casual smuggling into the state.
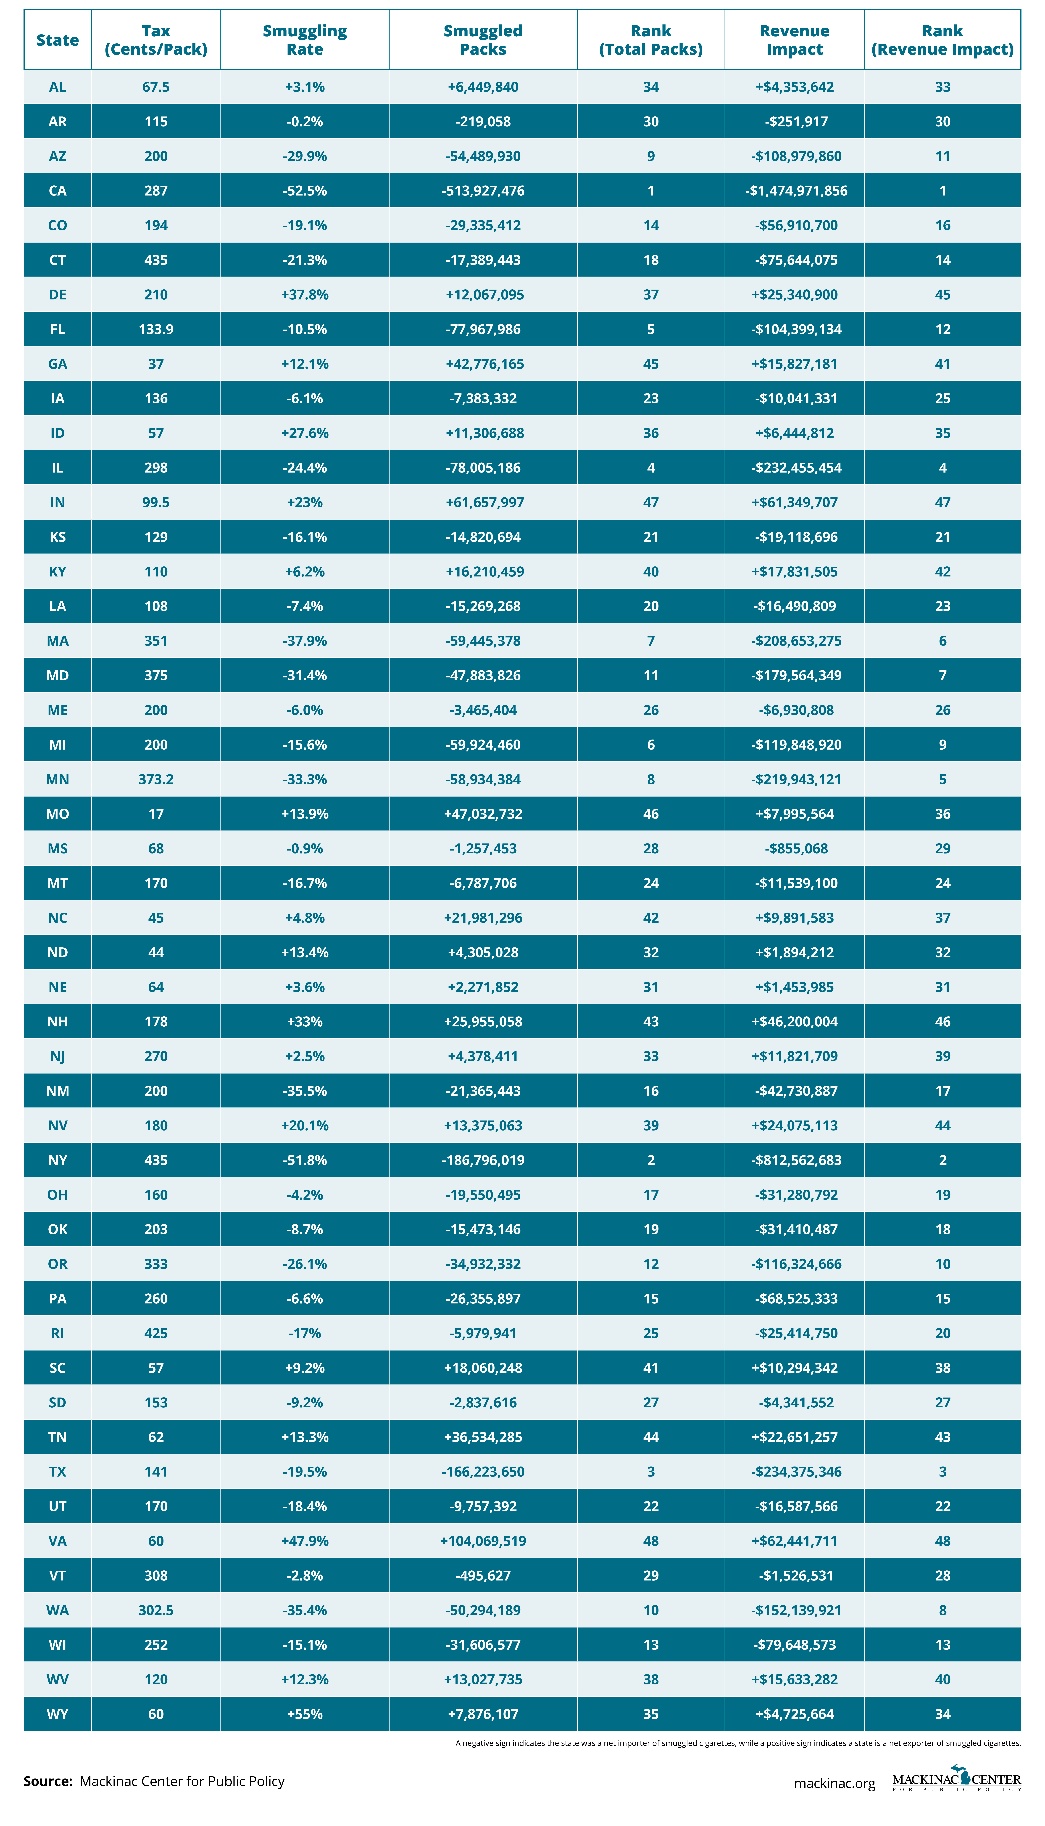
The model also produces figures by state for revenue impacts of smuggling. The top five states for tax losses due to smuggling are California, New York, Texas, Illinois and Minnesota. The figures are staggering. California would have generated nearly $1.5 billion more revenue each year from cigarette taxes on the 514 million untaxed packs consumed in the state each year. New York is second at $813 million in forfeited revenue from 187 million packs of untaxed cigarettes.
On the opposite end of the spectrum are states that generate more revenue thanks to taxes paid on cigarettes purchased within their borders for the purpose of smuggling. Virginia, Indiana, New Hampshire, Delaware and Nevada rake in tens of millions more dollars than they would absent smuggling. The 2023 numbers show that Virginia’s treasury gained more than $62 million on taxes paid for 104 million packs purchased that were exported to other states.
[*] The “2022 Rank” included in the table is based on the updated statistical model and do not match our previously published rankings.
[†] The “2022 Rank” included in the table is based on the updated statistical model and do not match our previously published rankings.
The consumption of vaping products impacts the demand for smuggled combustible cigarettes. Measuring the U.S. vaping market is problematic. Estimates put the illicit market share of vaping products at 90% or greater.[56] Unpacking exactly how the illicit market got so large requires a brief history lesson.
The U.S. Food and Drug Administration began regulating vaping products following the passage of the Family Smoking Prevention and Tobacco Control Act in 2009. This act granted the agency authority over tobacco products and launched a new Center for Tobacco Products within the FDA. The FDA initially attempted to block e-cigarette imports by classifying them as drug delivery devices, but this approach was overturned in the 2010 Sottera v. FDA case.[57] The U.S. Court of Appeals ruled that e-cigarettes should be regulated as tobacco products rather than as pharmaceuticals.[58]
The FDA extended its regulatory authority in 2016 to include all electronic nicotine delivery systems. It issued a new rule that declared all tobacco-related goods, including vaping products, fall under the same regulatory framework as cigarettes. Known as the Deeming Rule, this allowed the FDA to oversee the manufacture, labeling, marketing and distribution of vaping products.[59]
The FDA now required vaping manufacturers to apply for permission to produce any product not on the market before Feb. 15, 2007. Products would only be offered for sale if the FDA approved them.[60] This may have been the tipping point that greatly expanded the thriving black market that exists today.
In a market-based economy, permissionless innovation allows entrepreneurs to create new products and to test those products in the marketplace.[61] If entrepreneurs think consumers want to buy something that is profitable for them to make, they ramp up production and sell their products. When not even consumers want it, the product line fails. This happens repeatedly, with most consumers never knowing about the products that failed.
The FDA stifles this natural market process when it comes to tobacco products by requiring vaping manufacturers to get approval before marketing and selling any products. This slows innovation and raises the cost of participating in the legal marketplace for vaping products. Illicit market producers, on the other hand, gain an advantage over producers trying to play by the FDA rules. Where rule-abiding operators are bogged down by FDA regulatory burdens, black market manufacturers that skirt these rules can start earning back their production costs more quickly through illicit trade.
The FDA has dragged its feet in approving new vaping products for legal sale. It received approximately 26.6 million applications between October 2019 and March 2024. Separate applications are required for every product, including those differing in size, flavor and delivery device. The FDA reviewed only 1.2 million of these applications. Of those 1.2 million, the FDA approved just 30 products. Getting a vaping product approved is about as difficult as winning the lottery: only one in a million applications gets approved.[62]
While statutorily required to provide decisions on applications in 180 days, the FDA failed its mandate.[63] Products can sit for years at the agency without a decision. It took the FDA, for example, four years to issue the first approval of a flavored vaping product — four versions of NJOY Menthol.[64]
Beyond the opportunity cost of waiting to bring products to market, the typical costs for securing FDA approval are enormous. The FDA initially estimated costs upwards of $2.5 million. However, court filings from producers claim the actual costs are closer to $5 million to $8 million per product and can be $100 million per product line, including all devices, flavors and sizes.[65]
Vaping manufacturers need to spend millions of dollars and wait years to hear if they would be allowed to sell their products in the U.S. Illicit operators — especially those in China, with its well-established manufacturing capacity and wholesale distribution networks — can design a new product and have it offered for sale on the black market in the U.S. in a matter of weeks. Illicit products also undercut their legal competitors by not requiring buyers to pay excise taxes.[66]
Perhaps the largest reason for such a large illicit market for vaping products is the FDA’s stance on flavored products. Vaping consumers have demonstrated strong demand for a variety of flavors, not just menthol. Without legally authorized products available for sale, illicit products quickly filled the void to meet demand.
The result of this regulatory bottleneck is a predictable and counterproductive outcome: an illicit market that is larger and more responsive to consumer preferences than the legal one the FDA oversees. By restricting innovation, delaying decisions, and approving only a handful of products federal policy has unintentionally ceded the vaping marketplace to unregulated producers. If policymakers want to reduce illicit trade, improve product safety, and shift consumers toward less harmful alternatives to combustible cigarettes, they will need to rethink their approach.
Smuggling has been part of human existence for millennia, with examples traced back to more than 4,000 years to the Assyrian Empire.[67] Exorbitant taxes and restrictive regulations create incentives for operators to skirt the rules.
Excise taxes — such as those imposed on cigarettes — are a consumption tax targeted to a specific good. The tax is sold as a mechanism for raising government revenue and improving health outcomes by discouraging consumption of cigarettes. Theory, evidence and practical experience show that such excise taxes do raise revenues and dissuade some people from smoking cigarettes.
The story doesn’t end there, however. Government attempts to improve health outcomes and raise revenues created a large, illegal marketplace. This has been fueled by high cigarette excise tax rates and product bans in some states.
This study sizes up the illicit marketplace by examining cigarette excise tax rates, state prohibitions, and smuggling activity. The statistical model to generate these estimates is updated to reflect changes in the marketplace and is the centerpiece of our empirical analysis. It shows key changes in smuggling patterns.
For the first time, California is the state with the highest smuggling rate for inbound traffic, surpassing New York. California’s smuggling rate peaked at 53% of total consumption, edging out the Empire State’s rate of 52%. These states were followed by Massachusetts at 38%, New Mexico at 36% and Washington at 35%. Smuggling rates in these states are driven by high cigarette excise tax rates, bans on menthol or other flavored products or both.
Outbound smuggling, or cigarettes exported from states by consumers or organized crime and transported elsewhere, is concentrated in lower-taxed states. Wyoming is the top export state at 55%. That is, for every 100 cigarettes consumed there, another 55 are smuggled out. Wyoming is followed by Virginia at 48%, Delaware at 38%, New Hampshire at 33% and Idaho at 28%. These states have low cigarette taxes relative to adjacent states.
Michigan represents a distinct improvement: its smuggling rate has fallen from roughly 35% in 2006 to just 16% today. This is very likely a function of maintaining its $2.00 per pack cigarette excise tax rate since 2004, while other states have raised their own.
Indiana raised its own cigarette excise tax rate by a dramatic 201% in 2025 but the impact of doing so will not show up in new estimates for two years due to the lag in data available to scholars. We can, however, use the model to run “what if” scenarios and it tells us that the Hoosier State will go from being a source state for smugglers to a target state. Specifically, 15% of future consumption in the state will be a function of tax evasion and avoidance, or smuggling.
This study’s primary findings are born of a thorough review of academic and other literature and new empirical measures to assess how well-intentioned policies can go awry. The consequences of these policies — lawlessness, criminal violence and other unintended harms — are costly to policymakers, law enforcement and public health and safety. Lawmakers must consider these unintended consequences when fashioning tax policy about cigarettes and other tobacco products.
As we have done in our previous reports on cigarette taxation and smuggling, we use this appendix to motivate and discuss the empirical models and results used to produce casual and commercial smuggling estimates. The results of this study build upon the growing literature detailing the presence of substantial tax-induced smuggling, both casual and commercial. For instance, early work by Thursby and Thursby (2000) find that commercial smuggling accounted for nearly 7.3% of total cigarette sales in the United States in 1990 while Lovenheim (2007) estimates that 13% to 25% of U.S. consumers engage in casual smuggling in the early 2000s.[68]
More recent studies support these general findings. Three studies, published in 2013, 2015, 2019 all estimated a national, upper-bound limit for smuggling (or tax evasion and avoidance or non-compliance) at 21%.[69]
Much of the related literature employs empirical models of representative consumer demand, including such variables as cigarette price, tourism, income, race, religious affiliation and other demographic variables, in addition to the primary variables of interest: tax (or price) differentials; American Indian and military population; and distance from North Carolina. Others have examined the tax-paid stamps on discarded packs in major cities to assess smuggling activity.
The empirical method chosen here differs from that literature. Instead, it follows the two-stage method proposed by LaFaive, Fleenor and Nesbit (2008). We first estimate in-state consumption and then use the residual from that regression as a measure of smuggling. We then take that measure of smuggling (unexplained state sales) and regress it as a function of tax differentials and other commonly employed variables used to describe casual and commercial smuggling. Where our specification of this model differs from the LaFaive, Fleenor and Nesbit (2008) specification is in this second stage. In an effort to continue to improve the accuracy of our estimates, we modestly modify the explanatory variables to better capture over-the-road smuggling and the effects of recent menthol flavor bans.
What follows is a description of the estimation procedure and a discussion of the results. We motivate the key deviations from the LaFaive, Fleenor and Nesbit (2008) specification and provide a comparison of the empirical results. A more thorough description of the empirical specification of LaFaive, Fleenor and Nesbit (2008) can be found in Appendix A of that study.
Legal per-adult, tax-paid cigarette sales (hereafter, per-adult sales) can be defined as the sum of in-state consumption and net smuggling, as presented in Equation 1:
PCSalesit = Consit + NetSmugit
where PCSales is per-adult cigarette sales, Cons represents the in-state per-adult consumption, NetSmug is the per-adult number of packs of cigarettes exported to residents of other states minus the number of packs imported by residents of the home state from other states or other jurisdictions (including Indian reservations and military bases), and i and t indicate state and year.
Our first-stage regression equates to a naive version of Equation 1, in that we do not control for any smuggling. Instead, we include only measures of in-state consumption on the right-hand side of the equation. If the smuggling of cigarettes is not prominent, then sales within the state will be approximately equal to in-state consumption. However, if smuggling is a prominent feature of the cigarette market, such a naive model will explain only a small percentage of the variation in per-adult sales, resulting in residuals of large magnitude. The sign and magnitude of the residuals from the estimation of the naive model are of particular interest to us. Specifically, for low-tax states, the naïve model will systematically under-predict actual sales (positive residual), as consumers from other states travel across state borders to purchase cigarettes in the lower-tax state. Thus, actual sales in the low-tax state will exceed the amount indicated by in-state consumer demand. Similarly, the model will systematically over-predict actual sales for high-tax states (negative residual), as in-state residents choose to purchase cigarettes in nearby lower-tax states, from Indian reservations or military bases, or from illegal markets.
In order to estimate our naïve model of per-adult tax-paid cigarette sales, in-state per-adult consumption must first be characterized. We define in-state per-adult consumption by Equation 2:
Consit = Smokeit * Intensityit / Rit
where Smoke is the smoking prevalence in the state (the percent of the adult population in the state who are smokers), Instensity is the average number of packs consumed during a year by smokers in the state, and R is a parameter between zero and one; dividing by R would therefore correct for the under-reporting of smoking prevalence.
Data on smoking prevalence is available from the Centers for Disease Control and Prevention through its Behavioral Risk Factor Surveillance System. Unfortunately, data regarding smoking intensity is not readily available. LaFaive, Fleenor and Nesbit (2008) observe that smoking intensity at the national level declined roughly linearly from 1995 to 2006 and assume that smoking intensity does not vary significantly across states. Consistent with LaFaive, Fleenor and Nesbit (2008), we employ a linear trend to capture the variation in smoking intensity through time, as indicated in Equation 3:
Consit = Smokeit * f(Trendt)
where f(Trend) represents the above-described linear function of smoking intensity and its systematic under-reporting.
We estimate our naive model of per-adult sales using state-level data for the U.S. continental states for the period 1990-2023. LaFaive, Fleenor and Nesbit (2008), LaFaive and Nesbit (2010) and LaFaive, Nesbit and Drenkard (2016) exclude North Carolina from their samples because it is modeled as the primary source of commercially smuggled cigarettes in the second stage regression.[70] Given the changes implemented in our second stage specification (discussed below), we do not exclude North Carolina or any other contiguous state from our sample.
Descriptive statistics and sources for all variables used in this study can be found in Graphic 4. All dollar amounts are represented in 2023 prices.
| Mean | Std.Dev. | Minimum | Maximum | Source | |
|---|---|---|---|---|---|
| Per-Adult Cigarette Sales [packs] | 68.9831 | 32.5867 | 8.8000 | 186.8000 | [1] |
| Smoking Prevalence [%] | 20.1775 | 4.5102 | 6.0000 | 32.6000 | [2] |
| Ave. Tax Rate Differential [cents] | -2.9582 | 77.1122 | -315.5070 | 285.0840 | [1,4] |
| Percent Border Population [%] | 1.2515 | 0.9605 | 0.1038 | 4.5862 | [3,4] |
| Ave. Tax Differential x % Border Population | -22.4537 | 120.1750 | -723.3400 | 987.1790 | [1,3,4] |
| Canadian Border State Dummy x Tax [cents] | 55.2342 | 128.8180 | 0 | 726.0630 | [1,4] |
| Mexican Border State Dummy x Tax [cents] | 19.2831 | 71.5418 | 0 | 482.3120 | [1,4] |
| Indian Reservation Dummy x Tax [cents] | 107.8830 | 140.1430 | 0 | 726.0630 | [1,4] |
| Menthol Ban | 0.0031 | 0 | 1 | [4] | |
| Tobacco State Dummy | 0.1250 | 0 | 1 | [1,4] | |
| Average Tobacco State Tax Differential [cents] | 92.8664 | 100.8350 | -50.4144 | 523.5510 | [1,4] |
[1] Tax Burden on Tobacco, various years.
[2] Behavioral Risk Factor Surveillance System Survey Data, various years.
[3] U.S. Census Bureau, Intercensal County Population Estimates.
[4] Computed.
Note: All dollar values are represented in constant year 2023 dollars.
Graphic 5 presents the maximum likelihood estimates of our naive model corrected for groupwise heteroskedasticity to allow for nonconstant variance across states. We present both linear (Columns 1 and 2) and log-linear (Columns 3 and 4) specifications for robustness, but the log-linear specification appears to more closely fit the data and hence is the preferred specification.
Per the results presented in the final two columns of Graphic 5, a one percentage point increase in the smoking prevalence rate results in a 6.2% increase in per-adult sales in the state. Furthermore, per-adult sales are shown to decrease by an average of 1.9% per year, which we attribute primarily to the decline in smoking intensity over time.
| Dependent Variable: | Per Adult Sales | LN(Per Adult Sales) | ||||
|---|---|---|---|---|---|---|
| [1] Coeff. |
[2] Std.Err. |
[3] Coeff. |
[4] Std.Err. |
|||
| Smoking Prevalence [%] | 3.2124868 | *** | 0.0819471 | 0.06174 | *** | 0.00132 |
| Time Trend | -1.269383 | *** | 0.0359672 | -0.01930 | *** | 0.00056 |
| Constant | 22.070143 | *** | 2.1123205 | 3.20485 | *** | 0.03468 |
| Log Likelihood | -6425.35 | 365.52 | ||||
| Restricted Log Likelihood | -7041.91 | -146.41 | ||||
| Chi-Squared Statistic | 1233.12 | *** | 1023.86 | *** | ||
| Number of Observations | 1632 | 1632 | ||||
Notes: Statistical significance of 1%, 5%, and 10% are represented by ***, **, and *, respectively.
Results are corrected for groupwise heteroskedasticity via the HREG command within NLOGIT 3.0.
As noted above, it is not the coefficient estimates from the naive model that interest us; rather, it is the sign and size of the estimated residuals that are important. States with high tax rates relative to their neighbors and other source states are expected to have residuals that are negative and large in magnitude. Predicted per-adult consumption will exceed the state’s observed per-adult sales, suggesting that the state’s consumers are obtaining their cigarettes in other jurisdictions or markets. Low-tax states are expected to have residuals that are positive and large in magnitude. Observed per-adult sales will exceed predicted per-adult consumption, suggesting that the states are net exporters of smuggled cigarettes.
We attribute most of the variation of the residual from the naive model to the occurrence of tax avoidance and evasive behavior. Such behavior cannot be measured separately in the data. We can recharacterize it more broadly as “casual” and “commercial” smuggling. Casual smuggling can take the form of cross-border shopping between states, cross-border shopping associated with Mexico and Canada, or the purchase of untaxed cigarettes on military bases and Indian reservations by nonmilitary personnel and non-tribe members. We include the weighted average tax differential — i.e., home state tax rate minus the weighted average border state tax rate — between the home state and the bordering states to account for tax-induced shopping across state lines. Consistent with the LaFaive, Fleenor and Nesbit (2008) and LaFaive, Nesbit, and Drenkard (2016) studies, the average border tax rates are weighted by county border populations.
However, even with large average tax differentials, proportionally little casual smuggling is likely to occur if few people live along the border relative to the state’s population. Thus, we include the population living in counties on either side of the border divided by the home state’s total population (Percent Border Population). This percentage can take on a value greater than 1 when the border population in surrounding states is sufficiently large, thus causing the border population to exceed the home state’s total population. Finally, we include an interaction term between the average tax differential and percent border population.
To capture the impact of the presence of Indian reservations, we include the sum of the state excise tax and the federal excise tax rate for those states that have Indian reservations. This is effectively the tax differential between the home state and the tribal land, since taxes are not generally applied to cigarettes sold on reservations. Many states, including Michigan and Washington, have reached agreements with at least some tribes such that the tribes collect state taxes on sales of cigarettes to non-tribe members. While this may deter some casual smuggling, it is still possible for the smuggling to continue whereby tribe members serve as an additional middleman between tribal stores and non-tribe consumers.
Ideally, we would also like to include the tax differential with Canadian provinces and Mexican states for any U.S. states bordering Canada or Mexico. Unfortunately, accurate data on such tax rates, particularly for Mexico, were not available. Exchange rate fluctuations would further complicate the calculation of these tax differentials. As such, we simply include the sum of the home state excise tax and the federal excise tax for those states bordering either Canada or Mexico.
Lastly, as our final modeled component of casual smuggling, we include a binary variable, Menthol Ban, equal to 1 during years in which a state has banned the sale of menthol flavored cigarettes and zero otherwise. Massachusetts was the first state to introduce such a ban in 2020. California, as of December 2022, has also banned the sale of menthol flavored cigarettes.
We now turn to our modeling of commercial smuggling. As described in Thursby and Thursby’s 2000 paper, commercial smuggling primarily occurs either by “diversion” or “over-the-road.”[*] Diversion involves the manipulation of accounting records, reporting only a portion of legal sales. Over-the-road smuggling occurs when bulk cigarettes are purchased legally in low-tax states and shipped to higher-tax states, where the cigarettes may or may not receive counterfeit stamps and then sold in legal markets.[†] Our empirical model controls only for over-the-road smuggling, as has been common in the literature, with the exception of Thursby and Thursby (2000).
North Carolina has generally been modeled as the primary source of commercially smuggled cigarettes. The LaFaive, Fleenor and Nesbit (2008) and LaFaive, Nesbit, and Drenkard (2016) studies followed this convention, using the tax differential between the home state and North Carolina as the measure of commercial smuggling. This approach has the drawback of requiring observations from North Carolina to be excluded from the sample. While this variable choice may have been justified at the time of their respective publications given that North Carolina was generally accepted as the predominant source of over-the-road cigarette smuggling, many have noted the greater reliance on sources in other tobacco states such as Virginia and Georgia for such smuggling over recent years.
In this study, we take a different approach to the measure of commercial smuggling. Rather than limit the source for commercial smuggling to one state, we allow for greater flexibility in the source across all six “tobacco states:” Georgia, Kentucky, North Carolina, South Carolina, Tennessee, and Virginia. More specifically, we include the tax differential between the home state and average of the tobacco state taxes and a binary variable equal to 1 for the tobacco states and 0 otherwise. This approach provides greater flexibility for the source of commercially smuggled cigarettes and does not require any observations to be excluded from the sample.
Following much of the previous literature, no measure of distance to the source state is included, as transportation costs account for less than 1% of cigarettes’ total value. As such, transportation costs should exert a negligible impact on smuggling.
Graphic 6 presents the estimation results of the above described second stage regression. Columns 3 and 4 of this graphic provide the OLS estimation results of regressing the residuals from the log-linear naive model against the tax differential and population variables described above. When interpreting these results, recall that the dependent variable is the observed per-adult sales minus the predicted per-adult sales from the naive model of consumption. This dependent variable represents net smuggling exports. Thus, a positive value of the dependent variable in this second stage regression suggests the state is a net exporter of smuggled cigarettes, while a negative value of the dependent variable suggests the state is a net importer of smuggled cigarettes.
| Corresponding Naïve Model: | Linear | Linear Log-Linear | ||||
|---|---|---|---|---|---|---|
| [1] Coeff. |
[2] Std.Err. |
[3] Coeff. |
[4] Std.Err. |
|||
| Ave. Tax Rate Differential [cents] | 0.038142 | *** | 0.008057 | -0.000001 | 0.000104 | |
| Percent Border Population [%] | 4.796082 | *** | 0.417387 | 0.037631 | *** | 0.005365 |
| Ave. Tax Differential x % Border Population | -0.071257 | *** | 0.005021 | -0.000858 | *** | 0.000065 |
| Menthol Ban | 10.962659 | * | 6.021912 | -0.259829 | *** | 0.077403 |
| Canadian Border State Dummy x Tax [cents] | 0.006254 | * | 0.003543 | 0.000015 | 0.000046 | |
| Mexican Border State Dummy x Tax [cents] | -0.024488 | *** | 0.004996 | -0.000765 | *** | 0.000064 |
| Indian Reservation Dummy x Tax [cents] | -0.019096 | *** | 0.002992 | -0.000409 | *** | 0.000038 |
| Tobacco State Average Tax Differential [cents] | -0.038305 | *** | 0.004858 | -0.000676 | *** | 0.000062 |
| Tobacco State Dummy | 12.134263 | *** | 1.083499 | 0.082102 | *** | 0.013927 |
| Constant | 1.011247 | 0.779279 | 0.040171 | *** | 0.010017 | |
| R-squared | 0.4889 | 0.6028 | ||||
| Number of Observations | 1632 | 1632 | ||||
Notes: Statistical significance of 1%, 5%, and 10% are represented by ***, **, and *, respectively.
With the exception of the coefficient describing net smuggling to Canada, all estimates are of the expected sign, and nearly all are statistically significant at the 1% level. Both key variables of commercial smuggling are statistically significant at the 1% level. Holding all else constant, we observe that the average tobacco state smuggles 8.2 percentage points more cigarettes per capita out of the state compared to non-tobacco states. Further, a one-dollar increase in a state’s tax differential with the average tobacco state is associated with a 6.8 percentage point increase in smuggled cigarettes per capita into the state through commercial smuggling.
States bordering Mexico or containing Indian reservations, and particularly such states with larger tax rates, are shown to experience significantly increased smuggling imports from Mexico and the reservations, respectively. A one-dollar tax increase, holding all else constant, in a state with Indian reservations is associated with 4.1 percentage point increase in (casually) smuggled cigarettes per capita. An identical tax increase in a state bordering Mexico is observed to increase in-bound smuggling by 7.7 percentage points. We encourage caution when attributing the entire response to smuggling from Mexico into the U.S., as the large number of duty-free stores along the U.S.-Mexico border and bonded warehouses along major interstates across the Southwestern states is likely contributing to this underground economy as well.
The implications concerning casual smuggling are not as clear, given the interaction term between percent border population and average tax rate differential. However, given the mean percent border population of 1.25, the impact of a $1 increase in the average tax differential is clearly negative, leading to a 10.7 percentage point increase in casual smuggling into the state. This is consistent with the expectation that the larger the home tax rate is relative to the average bordering tax rate, the greater the net smuggling imports will be from the lower-tax neighboring states.
The menthol ban in California and Massachusetts is found to be a major contributing factor to casual smuggling for these states. Banning the sale of menthol flavored cigarettes is estimated to increase casual smuggling into the state by 26 percentage points. We attribute this increase in in-bound smuggling to casual sources, but it could also be facilitated in part through commercial sources of smuggling.
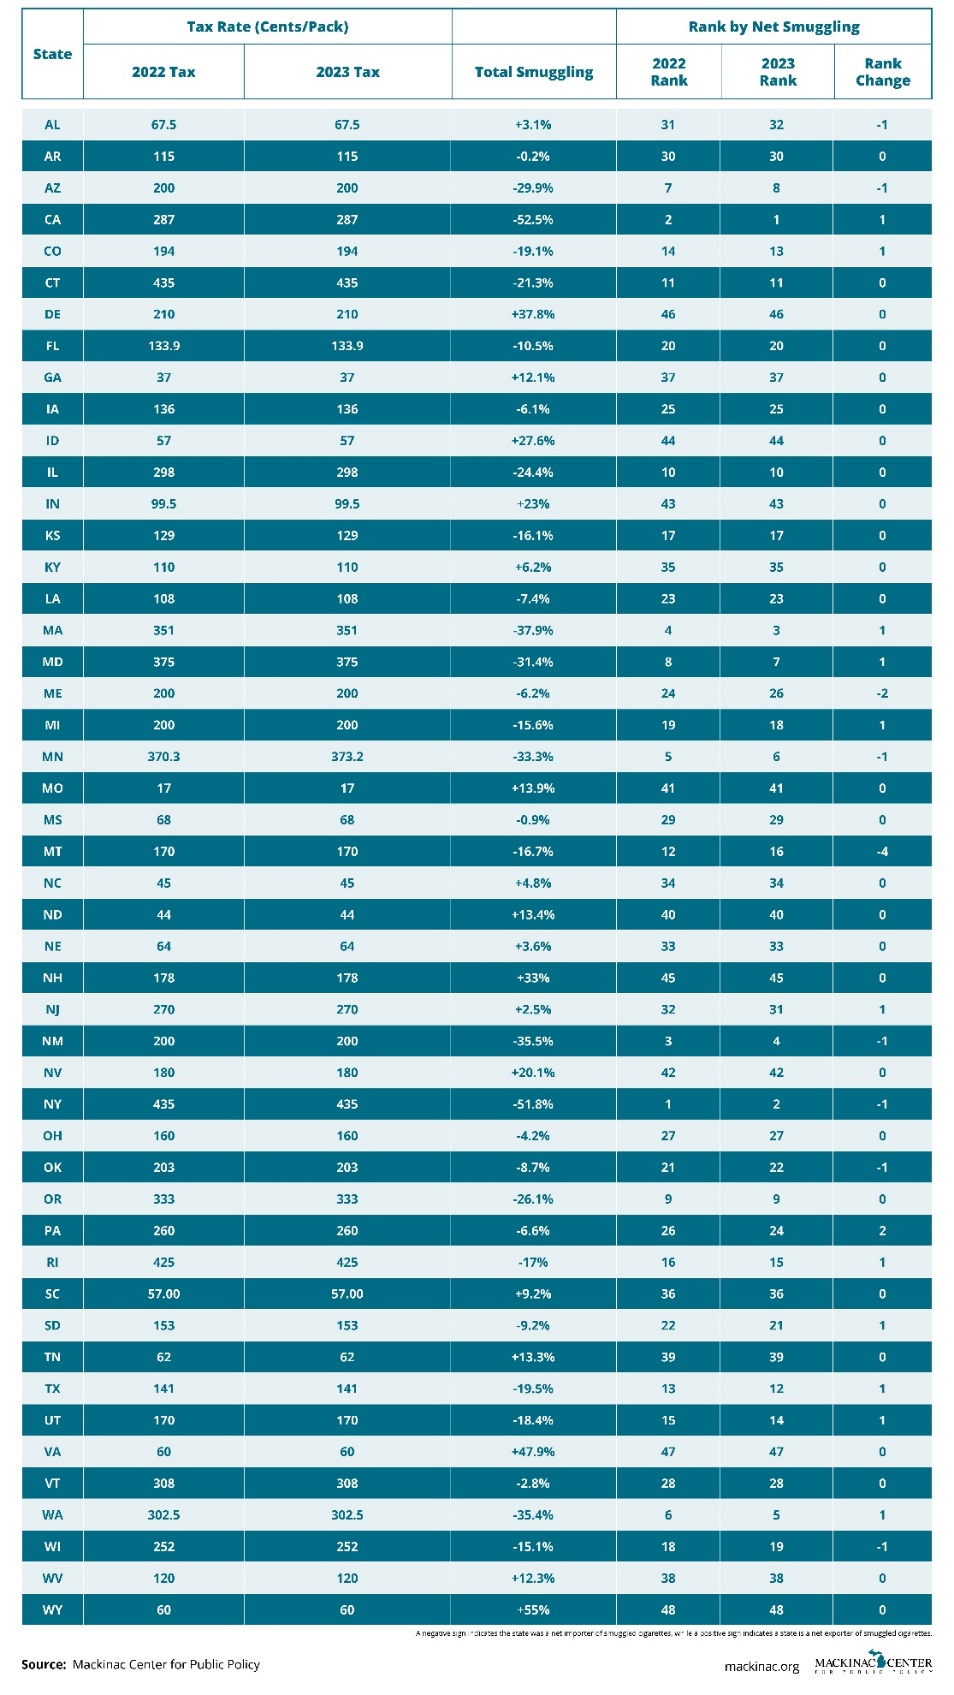
Given the above estimation results, we compute smuggling by type as a percentage of estimated per capita cigarette consumption in the state. Graphic 7 presents our state-level estimates of the percentage of estimated per capita cigarette consumption that was smuggled, both by type of smuggling and in total, for 2023, the last year in our dataset. Those states for which the percentage smuggled is negative are net importers of smuggled cigarettes. The total smuggling figure is our primary estimate. The linear sum of commercial, casual, and international smuggling will not equate to our total figure given the non-linear nature of the model.
[*] As indicated earlier in the paper, the term “diversion” is used by the Bureau of Alcohol Tobacco and Firearms to include both “diversion” and “over-the-road” smuggling as defined here by Thursby and Thursby.
[†] Typically, the retailer sells these cigarettes at the market price and pockets the money saved by not purchasing the cigarette stamps required by law. The retailer may have paid the over-the-road commercial smuggler more than he or she would have paid a legal cigarette distributor, but the retailer’s after-tax profits will still be higher than they would have been if the retailer had bought the cigarettes and stamps legally.
As noted above, relative to the state two model specifications of LaFaive, Fleenor and Nesbit (2008), LaFaive and Nesbit (2010), and LaFaive, Nesbit and Drenkard (2016), we made two primary adjustments. First, we added a variable to control for the menthol bans imposed in recent years. Both of the prior reports predated the menthol bans, so there was no reason to include such a variable at the time of their publications. Excluding the menthol ban from the model now would result in omitted variable bias, as it would mistakenly attribute the impact of the ban to other variables highly correlated with the ban.
The second adjustment concerns the measurement of the incentive for commercial smuggling. Both prior reports used the tax differential with North Carolina, a decision that was largely consistent with the literature at the time, as a measurement for the incentive to engage in commercial smuggling. This was not to suggest that all commercial smuggling originated from North Carolina; however, North Carolina, as a major source of the time, was used as the primary measure of the incentive to engage in such behavior. The major drawback of this measurement decision was that North Carolina was excluded from the sample.
Since the publication of the earlier reports, research detailing commercial smuggling originating in other tobacco states, namely Virginia and Georgia, has become more prominent. As such, the tax differential with North Carolina is likely no longer the best econometric choice to account for this incentive to engage in commercial smuggling. By replacing the tax differential with North Carolina with the tax differential with the average tobacco state tax and adding in a tobacco state binary variable, we believe that our model better estimates commercial smuggling. This change also permits us to include North Carolina in our sample.
For comparison of the results, we estimate our log-linear second stage model using both specifications and present these results in Graphic 8. Columns 1 and 2 present the results using the old measure — tax differential with North Carolina — and Columns 3 and 4 reproduce our results in the same columns of Graphic 6 using our new preferred measures — tax differential with the average tobacco state tax and tobacco state dummy variable. This change did not significantly affect the estimations of the other included variables.
| Methodology: | Original Methodology Using North Carolina Tax | Modified Methodology Using Tobacco State Average Tax | |||||
|---|---|---|---|---|---|---|---|
| [1] Coeff. |
[2] Std.Err. |
[3] Coeff. |
[4] Std.Err. |
||||
| Ave. Tax Rate Differential [cents] | -0.00003 | 0.00010 | -0.000001 | 0.000104 | |||
| Percent Border Population [%] | 0.03408 | *** | 0.00540 | 0.037631 | *** | 0.005365 | |
| Ave. Tax Differential x % Border Population | -0.00086 | *** | 0.00007 | -0.000858 | *** | 0.000065 | |
| Menthol Ban | -0.25179 | *** | 0.07847 | -0.259829 | *** | 0.077403 | |
| Canadian Border State Dummy x Tax [cents] | 0.00003 | 0.00005 | 0.000015 | 0.000046 | |||
| Mexican Border State Dummy x Tax [cents] | -0.00077 | *** | 0.00007 | -0.000765 | *** | 0.000064 | |
| Indian Reservation Dummy x Tax [cents] | -0.00045 | *** | 0.00004 | -0.000409 | *** | 0.000038 | |
| NC Tax Differential [cents] | -0.00070 | *** | 0.00006 | ||||
| Tobacco State Average Tax Differential [cents] | -0.000676 | *** | 0.000062 | ||||
| Tobacco State Dummy | 0.082102 | *** | 0.013927 | ||||
| Constant | 0.068764 | *** | 0.009286 | 0.040171 | *** | 0.010017 | |
| R-squared | 0.5955 | 0.6028 | |||||
| Number of Observations | 1598 | 1632 | |||||
Notes: Statistical significance of 1%, 5%, and 10% are represented by ***, **, and *, respectively.
We then use the estimation results to produce total smuggling estimates. These are shown in Graphic 9. Specifically, Graphic 9 displays the total smuggling estimate and rank first for the original model (the one using the tax differential with North Carolina) and then also for the modified model (the one using the tax differential with the average tobacco state and tobacco state dummy variable).[*] The final two columns of Graphic 9 show the change in estimated total smuggling and change in the rank for each state. The largest magnitude change in rank is only three positions, and most state ranks do not change. So, while we believe the modifications are an improvement in the modeling, they do not cause major shifts in the estimated smuggling outcomes.
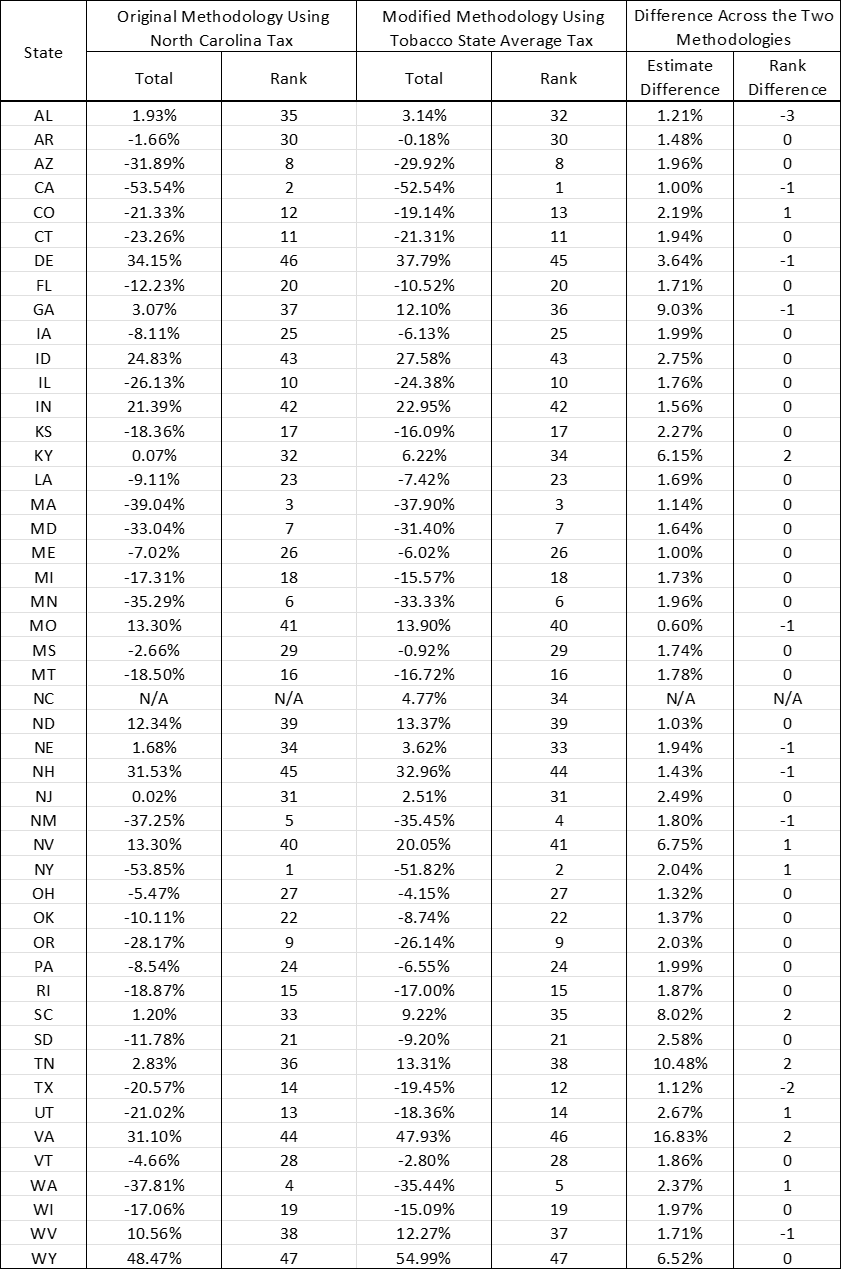
[*] Note that two states are shown as representing position 34 in the modified rank: Kentucky and North Carolina. This is intentional, as we want to show the rank of North Carolina in the new model while not biasing the rank change of the other states. As such, we rank all the other states as if North Carolina were not in the sample for more appropriate comparison to the prior model that excludes North Carolina.
We made our most recent request to the Food and Drug Administration in a public comment,
and it is worth quoting at length:
On pages 219-222 of the proposed product standard, the FDA takes pains to argue that should an illicit market develop or expand in response to the standard, it will not be a problem. This is based in large part on the belief that moving illicit product across international borders is a greater challenge than moving legal product state-to-state. Specifically, the FDA requests comments, including supporting data and research, regarding whether and to what extent this proposed rule would result in an increase in illicit trade in [normal nicotine content] cigarettes and certain other combusted tobacco products covered by the proposed nicotine product standard and how any such increase could impact public health. Data or other reliable information that do not rely on estimates of current, interstate tax-evading illicit trade would be particularly relevant.
We appreciate the opportunity to ask the FDA’s assistance in obtaining data necessary to make such estimates. (Emphasis in original.)
The statistical model we use annually to measure the illicit trade among states contains variables for the Mexican and Canadian borders. We have previously informed the FDA that, given existing data limitations regarding ports of entry and bonded warehouses, our model misattributes cross-border smuggling activity to the Mexican border. It is likely, though, that much of the measured cigarette smuggling along the Southwestern United States arrives through official ports of entry and is diverted as it proceeds through related bonded warehouses. We have attempted to resolve this data shortcoming for years, but our best attempts to do so with assistance from customs have failed.
Background on Research Data
In June of 2021, author LaFaive successfully spoke by phone to the Director of Cargo Security and Controls at U.S. Customs and Border Protection. My goal was to obtain data on combustible cigarettes passing into the United States. I also sought data on cigarettes imported into the United States and slated to be exported elsewhere still. I even offered specific tariff codes.
To my delight the director told me that that data was available. He further told me to submit a formal Freedom of Information Act request to Customs and Border Protection, as any such request would land on his desk. I did as he instructed but received what I viewed as non-responsive responses. I tried to follow up with the director of cargo security via phone afterward, but he did not respond.
This is where the Food and Drug Administration can assist. We ask the FDA to use its intergovernmental influence to obtain the data we originally sought, and perhaps even more. (Emphasis in original.) If the director of cargo security is correct that such data exist, making this information available could open the door to a wide range of new scholarship that would benefit decision makers at the FDA and elsewhere.
We wish to emphasize that we are not making the request for our exclusive benefit. Rather, we recommend that such data — perhaps expanded to include menthol- and vape-specific categories — be made available to the public on an annual basis. This would allow scholars of every background new, rich and robust sets of data on which to investigate policy questions of great importance.
The first use of such information seems obvious to us: to create a baseline estimate of internationally smuggled smokes and perhaps other tobacco products. If the proposed rule is adopted, the FDA and others may see in subsequent years empirical evidence to support their contention that “establishing and maintaining illicit markets in relevant tobacco products will be challenging, and to the extent that they emerge, it is unlikely they will be significant enough to outweigh the benefits of the product standard.”
We will post below the Freedom of Information Act request we submitted to U.S. Customs and Border Protection in 2021. We are willing to work with the FDA to create a more expansive dataset request to aid in scholarly research on this vital topic, and perhaps others.
Michael LaFaive, “Testimony Submitted to the Food and Drug Administration, Department of Health and Human Services: Docket No. FDA-2024-N-547 for ‘Tobacco Product Standard for Nicotine Yield of Cigarettes and Certain Other Combusted Tobacco Products.’” (Mackinac Center for Public Policy, February 13, 2025), https://www.mackinac.org
Michael D. LaFaive is senior director of the Morey Fiscal Policy Initiative and a 30-plus year veteran of the Mackinac Center for Public Policy. He holds graduate and undergraduate degrees in economics and has written and spoken extensively about cigarette taxes and related, unintended consequences including smuggling of tobacco products. His publications include, but are not limited to, four studies published by the Mackinac Center for Public Policy, opinion pieces in the Wall Street Journal and Washington Post and a book chapter titled, “Prohibition by Price.” The book, For Your Own Good: Taxes, Paternalism and Fiscal Discrimination in the 21st Century, was edited by Todd Nesbit and Adam Hoffer, co-authors of this study.
Todd Nesbit, Ph.D., is assistant professor of free enterprise and entrepreneurial economics at Ball State University. Professor Nesbit has a bachelor’s degree in economics and mathematics from Capital University and a doctorate in economics from West Virginia University. His dissertation, "Essays on the Secondary Impacts of Excise Taxation: Quality Substitution, Tax Earmarking, and Cross-border Effects," established him as a national expert in cross-border consumption. Since 2005, he has authored or co-authored a number of cross-border and excise-related working papers, including "The Effects of Excise Taxes on Product Quality, Evidence from the Gasoline Market" and "Effects of Wine and Spirits Taxes in the Presence of Spatial Autocorrelation." He has co-authored op-eds with LaFaive for the Wall Street Journal and Washington Post on cigarette smuggling.
Adam Hoffer is the director of Excise Tax Policy at the Tax Foundation. Dr. Hoffer earned his PhD in economics from West Virginia University and his undergraduate degree from Washington & Jefferson College. Prior to joining the Tax Foundation Dr. Hoffer was a professor of economics at the University of Wisconsin-La Crosse. He was also a Bradley Freedom Fellow with the Wisconsin Institute for Law and Liberty and a senior editor with the Center for Growth and Opportunity at Utah State University. Dr. Hoffer has published 30 peer-reviewed academic journal articles, and he is the lead author and editor of two books, including For Your Own Good: Taxes, Paternalism, and Fiscal Discrimination in the Twenty-First Century and Regulation and Economic Opportunity: Blueprints for Reform. He lives in La Crosse, Wisconsin with his wife and two children.
The authors would like to thank contributors to this study including, but not limited to:
Aiden Tanis, the Mackinac Center for Public Policy’s 2025 fiscal policy summer research assistant.
James Hohman, Director of Fiscal Policy at the Mackinac Center for Public Policy.
Michael Van Beek, Research Director for the Mackinac Center for Public Policy.
Mackinac Center for Public Policy editors Tim Cavanaugh and John LaPlante.
Mackinac Center for Public Policy communications staff, including Ann Marie Pariseau, Jarrett Skorup and Jessica Wyeth.
All errors are the sole responsibility of the authors.
[1] Michael LaFaive, Patrick Fleenor and Todd Nesbit, “Cigarette Taxes and Smuggling: A Statistical Analysis and Historical Review” (Mackinac Center for Public Policy, 2008), https://www.mackinac.org
[2] Michael LaFaive and Todd Nesbit, “Cigarette Taxes and Smuggling 2010: An Update of Earlier Research” (Mackinac Center for Public Policy, 2010), https://www.mackinac.org
https://www.mackinac.org
[3] Minn. Stat. § 297F.06.
[4] Kevin Schroth et al., “Cigarette Trafficking in New York City: Now and Then” Tobacco Control, August 26, 2025, https://perma.cc
[5] Kevin Schroth, et al., “Cigarette Trafficking in New York City: Now and Then” Tobacco Control, August 26, 2025, 1, https://perma.cc
[6] Shannon M. Farley et al., “Changes to the Littered Cigarette Pack Environment in New York City Between 2011 and 2015,” Tobacco Control 29, no. 3 (2020): Table 2, https://perma.cc
[7] Kevin Schroth et al., “Cigarette Trafficking in New York City: Now and Then” Tobacco Control, August 26, 2025, Table 1, https://perma.cc
[8] Kevin Schroth et al., “Cigarette Trafficking in New York City: Now and Then” Tobacco Control, August 26, 2025, Table 1, https://perma.cc
[9] Kevin Schroth et al., “Cigarette Trafficking in New York City: Now and Then” Tobacco Control, August 26, 2025, 4, https://perma.cc
[10] Kevin Schroth et al., “Cigarette Trafficking in New York City: Now and Then” Tobacco Control, August 26, 2025, 4, https://perma.cc
[11] Don Kenkel et al., “Understanding the Demand‐Side of an Illegal Market: A Case Study of the Prohibition of Menthol Cigarettes,” Health Economics 34, no. 5 (2025): 956–71, https://doi.org
[12] Don Kenkel et al., “Understanding the Demand‐Side of an Illegal Market: A Case Study of the Prohibition of Menthol Cigarettes,” Health Economics 34, no. 5 (2025): 956, https://doi.org
[13] Don Kenkel et al., “Understanding the Demand‐Side of an Illegal Market: A Case Study of the Prohibition of Menthol Cigarettes,” Health Economics 34, no. 5 (2025): 957, https://doi.org
[14] Don Kenkel et al., “Understanding the Demand‐Side of an Illegal Market: A Case Study of the Prohibition of Menthol Cigarettes,” Health Economics 34, no. 5 (2025): 957, https://doi.org
[15] Don Kenkel et al., “Understanding the Demand‐Side of an Illegal Market: A Case Study of the Prohibition of Menthol Cigarettes,” Health Economics 34, no. 5 (2025): 957, https://doi.org
[16] Don Kenkel et al., “Understanding the Demand‐Side of an Illegal Market: A Case Study of the Prohibition of Menthol Cigarettes,” Health Economics 34, no. 5 (2025): 957, https://doi.org
[17] “Empty Packs Survey: USA-CA Q2 2023,” WSPM Group, August 2023, 3, 10, https://perma.cc
[18] “Empty Packs Survey: USA-CA Q2 2023,” WSPM Group, August 2023, 5, https://perma.cc
[19] “Empty Packs Survey: USA-CA Q2 2023,” WSPM Group, August 2023, 5, https://perma.cc
[20] Adam Hoffer, “Cigarette Taxes and Cigarette Smuggling by State, 2022”(Tax Foundation, November 26, 2024), https://perma.cc
[21] Shannon M. Farley et al., “Changes to the Littered Cigarette Pack Environment in New York City Between 2011 and 2015,” Tobacco Control 29, no. 3 (2020): Abstract, https://tobaccocontrol.bmj.com
[22] Shannon M. Farley et al., “Changes to the Littered Cigarette Pack Environment in New York City Between 2011 and 2015,” Tobacco Control 29, no. 3 (2020): Abstract, https://tobaccocontrol.bmj.com
[23] James E. Prieger, “Tax Evasion and Illicit Cigarettes in California: Prevalence and Demand-Side Correlates,” Crime, Law and Social Change 78, no. 4 (2022): 431, https://doi.org
[24] William Orzechowski and Robert Walker, “The Tax Burden on Tobacco," Historical Compilation Volume 59, 2024 (Orzechowski & Walker, 2025), 12j; “States & Localities That Have Restricted the Sale of Flavored Tobacco Products” (Campaign for Tobacco Free Kids, September 9, 2025), 1, https://perma.cc
[25] James E. Prieger, “Tax Evasion and Illicit Cigarettes in California: Prevalence and Demand-Side Correlates,” Crime, Law and Social Change 78, no. 4 (2022): 439, https://doi.org
[26] Prieger, “Tax Evasion and Illicit Cigarettes in California,” 3.
[27] Alberto Aziani et al., “Empty Discarded Pack Data and the Prevalence of Illicit Trade in Cigarettes” (BOTEC Analysis, LLC, January 17, 2017), 24, https://perma.cc
[28] Alberto Aziani et al., “Empty Discarded Pack Data and the Prevalence of Illicit Trade in Cigarettes” (BOTEC Analysis, LLC, January 17, 2017), 2, https://perma.cc
[29] Alberto Aziani et al., “Empty Discarded Pack Data and the Prevalence of Illicit Trade in Cigarettes” (BOTEC Analysis, LLC, January 17, 2017), 24, https://perma.cc
[30] Alberto Aziani et al., “Empty Discarded Pack Data and the Prevalence of Illicit Trade in Cigarettes” (BOTEC Analysis, LLC, January 17, 2017), 2, https://perma.cc
[31] Alberto Aziani et al., “Empty Discarded Pack Data and the Prevalence of Illicit Trade in Cigarettes” (BOTEC Analysis, LLC, January 17, 2017), Table 10, https://perma.cc
[32] Wang, Xu et al., “Tax Avoidance and Evasion: Cigarette Purchases from Indian Reservations Among US Adult Smokers, 2010-2011,” Public Health Reports 132, no. 3 (2017): 305, https://perma.cc
[33] Wang, Xu et al., “Tax Avoidance and Evasion: Cigarette Purchases from Indian Reservations Among US Adult Smokers, 2010-2011,” Public Health Reports 132, no. 3 (2017): 306, https://perma.cc
[34] “Tobacco Trade: Duty-Free Cigarettes Sold in Unlimited Quantities on the U.S.-Mexico Border Post Customs Challenges” (United States Government Accountability Office, October 2017), https://perma.cc
[35] “Tobacco Trade: Duty-Free Cigarettes Sold in Unlimited Quantities on the U.S.-Mexico Border Post Customs Challenges” (United States Government Accountability Office, October 2017), https://perma.cc
[36] “Tobacco Trade: Duty-Free Cigarettes Sold in Unlimited Quantities on the U.S.-Mexico Border Post Customs Challenges” (United States Government Accountability Office, October 2017), 16, https://perma.cc
[37] Richard T. Connelly et al., “Demand for Cigarettes in the United States: Effects of Prices in Bordering States and Contiguity with Mexico and Canada,” Applied Economics 41, no. 18 (2009): 2255, https://doi.org
[38] Richard T. Connelly et al., “Demand for Cigarettes in the United States: Effects of Prices in Bordering States and Contiguity with Mexico and Canada,” Applied Economics 41, no. 18 (2009): 2258, https://doi.org
[39] Richard T. Connelly et al., “Demand for Cigarettes in the United States: Effects of Prices in Bordering States and Contiguity with Mexico and Canada,” Applied Economics 41, no. 18 (2009): 2258, https://doi.org
[40] Richard T. Connelly et al., “Demand for Cigarettes in the United States: Effects of Prices in Bordering States and Contiguity with Mexico and Canada,” Applied Economics 41, no. 18 (2009): 2256, https://doi.org
[41] “CBP Seizes Nearly 150,000 Contraband Cigarettes from Couple Arriving on Cruise Ship” (U.S. Customs and Border Protection, May 14, 2025), https://perma.cc
[42] “Verified Complaint for Civil Forfeiture in REM and Notice to Potential Claimants,” United States District Court Southern District of Texas McAllen Division, Case 7:25-cv-00237, May 19, 2025, 2-3, https://perma.cc
[43] “Verified Complaint for Civil Forfeiture in REM and Notice to Potential Claimants,” United States District Court, Southern District of Texas McAllen Division, Case 7:25-cv-00237, May 19, 2025, 8, 19, 24–25,
https://perma.cc
[44] For example, see: “Tobacco Pack Surveillance System” (Johns Hopkins Bloomberg School of Public Health: Institute for Global Tobacco Control), https://perma.cc
[45] “Verified Complaint for Civil Forfeiture in REM and Notice to Potential Claimants,” United States District Court, Southern District of Texas, McAllen Division, Case 7:25-cv-00237, May 19, 2025, 16, https://perma.cc
[46] “Verified Complaint for Civil Forfeiture in REM and Notice to Potential Claimants,” United States District Court, Southern District of Texas, McAllen Division, Case 7:25-cv-00237, May 19, 2025, 19, https://perma.cc
[47] Michael LaFaive, “Testimony Submitted to the Food and Drug Administration, Department of Health and Human Services: Docket No. FDA-2024-N-547 for ‘Tobacco Product Standard for Nicotine Yield of Cigarettes and Certain Other Combusted Tobacco Products’” (Mackinac Center for Public Policy, February 13, 2025), https://www.mackinac.org
[48] Benjamin W. Chaffee et al., “Flavored Tobacco Product Use Among California Adolescents Before and Immediately After a Statewide Flavor Ban,” Nicotine and Tobacco Research 27, no. 6 (2025): 1035–42,
https://perma.cc
[49] William Orzechowski and Robert Walker, “The Tax Burden on Tobacco: Historical Compilation Volume 59, 2024” (Orzechowski & Walker, 2025), v.
[50] William Orzechowski and Robert Walker, “The Tax Burden on Tobacco: Historical Compilation Volume 59, 2024” (Orzechowski & Walker, 2025), v.
[51] Michael LaFaive et al., “Cigarette Taxes and Smuggling: A Statistical Analysis and Historical Review,” Mackinac Center for Public Policy, 2008, 18, https://perma.cc
[52] William Orzechowski and Robert Walker, “The Tax Burden on Tobacco: Historical Compilation Volume 59, 2024” (Orzechowski & Walker, 2025), 12.
[53] Todd Nesbit and Michael LaFaive, “Indiana’s 201% Cigarette Tax Hike Will Fuel Smuggling, Not Just Revenue,” (IndyStar, June 27, 2025), https://perma.cc
[54] Robert Walker, partner at Orzechowski & Walker, email correspondence with Michael LaFaive, Mackinac Center for Public Policy, November 4, 2025.
[55] Michael LaFaive, “Cigarette Taxes and Smuggling Rates” (Mackinac Center for Public Policy, September 29, 2025), https://www.mackinac.org
[56] Matthew Perrone, “US seizes more illegal e-cigarettes, but thousands of new ones are launching” (Associated Press, December 30, 2023), https://perma.cc
[57] Sottera, Inc. v. FDA, 627 F.3d 891, 393 U.S. App. D.C. 257 (D.C. Cir. 2010), https://perma.cc
[58] “Tobacco Product Regulation: Sottera Court Decision,” United States Food and Drug Administration, October 17, 2017, https://perma.cc
[59] “Deeming Tobacco Products To Be Subject to the Federal Food, Drug, and Cosmetic Act, as Amended by the Family Smoking Prevention and Tobacco Control Act; Restrictions on the Sale and Distribution of Tobacco Products and Required Warning Statements for Tobacco Products” (U.S. Food and Drug Administration, May 10, 2016), https://perma.cc
[60] “Deeming Tobacco Products To Be Subject to the Federal Food, Drug, and Cosmetic Act, as Amended by the Family Smoking Prevention and Tobacco Control Act; Restrictions on the Sale and Distribution of Tobacco Products and Required Warning Statements for Tobacco Products” (U.S. Food and Drug Administration, May 10, 2016), https://perma.cc
[61] Adam Thierer, “Permissionless Innovation: The Continuing Case for Comprehensive Technological Freedom” (Mercatus Center, March 15, 2016), https://perma.cc
[62] Adam Hoffer and Jacob Macumber-Rosin, “Current Challenges in Vaping Markets” (Tax Foundation, July 26, 2024), https://perma.cc
[63] “Premarket Tobacco Product Applications and Recordkeeping Requirements” (Federal Register, October 5, 2021), https://perma.cc
[64] “Searchable Tobacco Products Database,” Food and Drug Administration, November 24, 2025, https://www.accessdata.fda.gov
[65] “Corrected Post-Trial Proposed Findings of Fact and Conclusions of Law of Respondents Altria Group, Inc. and Juul Labs, Inc.” (Federal Trade Commission, September 28, 2021), 24, https://perma.cc
[66] Adam Hoffer and Jacob Macumber-Rosin, “Current Challenges in Vaping Markets” (Tax Foundation, July 26, 2024), https://perma.cc
[67] Mathilde Tuoillon-Ricci, “Trade and Contraband in Ancient Assyria” (The British Museum, April 2, 2018), https://perma.cc
[68] Jerry G. Thursby and Marie C. Thursby, “Interstate Cigarette Bootlegging: Extent, Revenue Losses, and Effects of Federal Intervention,” National Tax Journal 53, no. 1 (2000): 69; Michael Lovenheim, “How Far to the Border?: The Extent and Impact of Cross-Border Casual Cigarette Smuggling,” National Tax Journal LXI, no. 1 (2008), https://perma.cc
[69] Brian V Fix et al., “A Novel Approach to Estimating the Prevalence of Untaxed Cigarettes in the USA: Findings from the 2009 and 2010 International Tobacco Control Surveys,” Tobacco Control 23, no. suppl 1 (2014): i61–66, https://doi.org
[70] Michael LaFaive, Patrick Fleenor and Todd Nesbit, “Cigarette Taxes and Smuggling: A Statistical Analysis and Historical Review” (Mackinac Center for Public Policy, December 2, 2008), https://www.mackinac.org