The Michigan Single Business Tax (SBT) was, at the time of this report's release, the only value-added state business tax system in the U.S. The author explores its history, actual practice, and inherent advantages and disadvantages. Tables of data are provided, showing the SBT burden as a percentage of the Adjusted Tax Base on industries in Michigan. This report is a good overview of the SBT and its impact on the state's businesses. 30 pages.
Objective Questions
The objective of this analysis is to answer three questions:
The Variation of SBT
Burdens Across Industries
Is there a substantial and
consistent difference in the relative SBT burdens of various industries, across
different time periods and economic situations?
The Taxation of the
Financial Industry
In particular, how does the
Financial Industry compare with other Michigan industries in their SBT burden?
The SBT and Business
Expansion
What peculiar facets of the
SBT discourage or encourage business expansion in Michigan, and what does this
suggest for retaining, modifying, or replacing the VAT concept for Michigan
business taxation?
Findings
The analysis produced the following findings:
The Single Business Tax
Comprehensiveness of the Single Business Tax System
The use of a single, comprehensiveness tax system has built-in advantages in the equality of treatment among industries. Multiple tax systems must overcome the built-in disadvantages of complexity and redundancy. The legislature's purpose in creating the Single Business Tax included greater equality of treatment. The recreation of multiple tax systems would work against this purpose.Cyclicality of a VAT
The VAT-type SBT limits the cyclicality of revenue to the State government, but increases the cyclical pressures on taxpaying businesses. The benefits of better cyclical stability of tax revenue under a VAT must be discounted by the cost of increased cyclical instability for the taxpaying businesses and individuals.The SBT and Capital Expenditures
Because the depreciation deductions allowed in most profits tax systems understate the true cost of capital expenditures, consumption-type VAT's like the SBT are more favorable to capital expenditures than profits taxes. Because many of Michigan's major industries are capital-intensive, this more-neutral treatment of investment is a major advantage of the SBT over the profits tax systems in other states. The full expensing of capital investments under the SBT encourages businesses to invest in Michigan.
The 1985 Treasury Report
The government study of record on the SBT was authored by the Michigan Department of Treasury in 1985. The quantitative analysis in this study relies on the data gathered for the Treasury study, and critically reviews its methodology. The findings below summarize the limitations of the Treasury data, and the biased results introduced by the Treasury methodology.
1985 Treasury Report Data Limitations: Unusual Sample Year
The sample period of the Treasury study was a time of extreme economic contraction, which affected some Michigan industries more than others.Insufficient Sample Period
The sample period of the Treasury study was very short, and does not indicate the behavior of various industries over the entire economic cycle.Old Data
The number and importance of economic changes occurring in the over-five-year time lapse between the sample period and the current date limit the predictive power of the data.Aggregation
The groupings of industries into standard categories can hide differences between the industries. In the Financial Industry category, banks, insurance companies, and real estate companies are grouped together, even though substantial differences exist among the three in business operation. Conclusions about a group cannot be generalized to all its components without further analysis of disaggregated data.Biased Results from the Use of an Incorrect Tax Base
The 1985 Treasury Report relied on an incorrect measure of the tax base, which ignored capital expenditures. Thus, their analysis systematically biased downward their calculated SBT burdens. The actual tax burdens of Michigan industries were higher than those stated in the Treasury study, particularly for those industries making large capital expenditures in the sample period.
Analysis of Single Business Tax Burdens on Michigan Industries
Using the proper methodology, which took into account capital expenditures in selecting a tax base, this analysis produced the following findings about the SBT burdens on Michigan industries.
Relative Tax Burdens
The SBT burden as a percentage of the Adjusted Tax Base varied considerably across industries during the sample period, ranging from 1.4% for Agriculture to 3.35% for Finance, Real Estate, and Insurance. The average tax burden ratio for all firms was 1.8%.Comparison with Treasury Results
The tax burden ratios are higher and more varied than those reported in the Treasury study. To conclusively determine relative tax burdens, data from one complete economic cycle must be analyzed, using the proper methodology.The SBT Burden Compared with Profits
The aggregate SBT liability of Michigan firms represented over 20% of their pretax profits in the sample period. The SBT clearly intensifies the cyclical pressures faced by Michigan businesses; this ratio probably drops sharply in good economic years.Business and Personal Tax Burdens in Michigan
Both business and personal tax burdens in Michigan are significantly higher than the national average. US Census Bureau data show that Michigan's 1984-85 Corporate Taxation burden was the second highest in the nation, double the national average. Because both theory and experience show that high tax burdens discourage economic growth, the Legislature should lower the overall tax burdens in the State.The "Fairness" of SBT Burdens on Michigan Industries
For a tax system to be equitable and efficient, it must levy a similar proportionate burden for firms of different size and in different industries over the entire economic cycle. During the sample period, the tax burden ratios varied significantly, indicating that there may be a bias against some industries in the SBT caused by unequal use of special credits and deductions.The Tax Burden of the Financial Industry
During the sample period, the tax burden of the Financial industry was the highest of all industries. While data from a complete cycle are needed to conclusively establish relative burdens, there is no basis to conclude that the Financial industry escapes its share of the SBT burden.
The Michigan SBT is the only Value-Added state business tax system in the United States. The federal income tax, the federal corporate income tax, the Michigan income tax, the business taxes in most states, and the local income tax all use some type of "income" or profits as their base. Most economists and the general public are familiar with the concept of income as an appropriate tax base, and as an appropriate measure "ability to pay."
By contrast, the SBT uses a value-added concept as its base. A Value-Added Tax (VAT has advantages and drawbacks, some of which are discussed in this report. VAT's are common in Europe (especially in Common Market countries) and Asia, but almost unknown in the U.S. and Canada. This unique VAT concept of the SBT has helped itbecome one of the least understood and most maligned of tax systems in Michigan, and allowed considerable confusion over the relative tax burdens of businesses of different sizes and industries.
The January 1985 document Analysis of the Michigan Single Business Tax, published by the Michigan Department of the Treasury, had as its purpose "to investigate how Single Business Tax liabilities vary between businesses in different product groups, or different sizes, and in different economic situations." [1] While this study illuminated many poorly-understood facts about the SBT, it did not quell the controversy about relative SBT burdens among industries in Michigan. Further analysis of the SBT and its effect on Michigan businesses was needed.
The objective of this analysis is to answer three questions:
The Variation of SBT Burdens Across Industries
Is there a substantial and consistent difference in the relative SBT burdens of various industries, across different time periods and economic situations?The Taxation of the Financial Industry
In particular, how does the Financial Industry compare with other Michigan industries in their SBT burden?The SBT and Business Expansion
What peculiar facets of the SBT discourage or encourage business expansion in Michigan, and what does this suggest for retaining, modifying, or replacing the VAT concept for Michigan business taxation?
The answers to the above questions will produce recommendations to the Michigan Legislature:
If a thorough analysis reveals that certain industries pay a significantly higher or lower tax burden than the average Michigan business, and do so consistently during different economic situations in different years, then the legislature would be advised to consider changes in the relative tax burden of various industries. This could be done by increasing or decreasing the burden on any one industry, by changing the tax treatment of certain practices under the existing system, or taking some industries out of the current system.
If, on the other hand, the variation among industries is relatively small, or the relative tax burdens fluctuate considerably with no industry consistently ahead or behind, or it the available data do not provide a conclusive determination, then the legislature would be advised to consider instead the overall business tax burden.
In particular, if the tax burden of the Financial Industry remains consistently higher or lower than that of all other industries, then the legislature should consider changes in the taxation of that industry.
Finally, if the VAT structure of the SBT inherently discourages business expansion in Michigan, the legislature would be advised to consider replacing or modifying it. If it favors business expansion in the state, then the legislature would be advised to consider other factors, such as the business climate or personal taxation levels, that also affect business growth prospects.
This study introduces the relevant questions about the SBT in the first section, describes the SBT and the VAT concept in the second section, and outlines a methodology for comparing relative industry tax burdens in the third section. Finally, it presents the results in the fourth section.
The objectives, and the key findings, are indented and titled, and summarized in the Executive Summary. The quantitative analysis in this study relies primarily on the summary data compiled by the Michigan Department of the Treasury for its 198i analysis of the SBT.
The SBT was adopted in 1975 to replace a number of taxes: the state corporate income tax, the financial institutions income tax, a corporate franchise fee, a savings and loan association privilege fee, domestic insurance company privilege fee, local government property tax on inventories, and the intangibles tax on business. One major motivating factor for the adoption of a VAT-type SBT was the desire to tax all business activity fairly and comprehensively, rather than with a hodgepodge of taxes on various types of firms. [2] Note that a number of the taxes replaced by the SBT were specifically placed on the financial industry.
The SBT is a consumption-based value-added tax. While most business and individual tax systems in North America tax income, the SBT taxes the added value given to products by business organizations. The SBT is technically referred to as a consumption-based VAT because its tax base includes all consumed resources. Investments are deducted from the tax base when made, but the value-added from those investments are included when consumed by the business enterprise.
The use of a consumption tax base does not eliminate the taxation of investments. Instead, it matches taxation to the time period in which the value of the investment is consumed. The SBT includes the entire value of an investment in the tax base, but spreads it out over the life of the investment.[3]
Before returning to a corporate income tax in 1967, Michigan relied on the VAT concept with the 'Michigan Business Activity Tax, from 1953 through 1967. Thus Michigan businesses have faced a VAT for most of the latter half of the 1900's.
Three advantages cited in the 1985 Treasury Report are of interest in this inquiry: comprehensiveness, revenue stability across the economic cycle, and better treatment of capital investment.
Since all industries, both manufacturing and service, create value in their product, value-added taxation is a comprehensive approach to business taxation. Profits tax systems rely on the fact that all industries try to maximize profit, and are also comprehensive. One advantage of a VAT over a corporate profits tax is that VAT's can easily apply to all forms of business organization, rather than corporations alone. The various forms of business organization – individuals, partnerships, proprietorships, publicly and privately held corporations, etc. – each have different incentives to earn profit. A comprehensive business VAT eliminates much of the incentive to shift income between various business forms.
In general, the more comprehensive the tax system, the less distortion it creates in the marketplace. [4] The use of a single tax system, rather than a number of overlapping systems, is a step towards greater comprehensiveness and equality of treatment. [5] The SBT taxes the value-added by all firms in all industries. Separate tax systems for separate industries have built-in disadvantages of increased complexity, potential redundancy, and possible gaps in coverage. This intrinsic superiority of a single, comprehensive tax system was one of the reasons the Michigan legislature formulated the SBT, and remains one of its advantages. [6]
Therefore, proposals to place Michigan industries once again under multiple tax systems must prove that multiple systems would bring more comprehensive coverage and better equality of treatment than a single system. [7] The basic superiority of single, comprehensive systems is a powerful advantage, as Michigan recognized with the establishment of the SBT.
This produces the first finding of this report: (Findings are indented and collected in the Executive Summary.)
Comprehensiveness of the Single Business Tax System
The use of a single, comprehensiveness tax system has built-in advantages in the equality of treatment among industries. Multiple tax systems must overcome the built-in disadvantages of complexity and redundancy. The legislature's purpose in creating the Single Business Tax included greater equality of treatment. The re-creation of multiple tax systems would work against this purpose.
The Treasury points out that a VAT system provides better revenue stability (for the State government) than a profits tax. This occurs because business income is far more affected by cyclical swings in the economy than business revenue. While this stability in revenue is often cited as beneficial to the state, the converse of that cyclical stability for the taxing authority is increased cyclicality for the tax-paying business. [8]
In poor economic years, SBT-paying businesses must pay tax even if they lose money. In good economic years, SBT-paying businesses pay taxes out of healthy profits, although less tax than they would under an equivalent profits tax. The tax burden is far greater in bad years under a VAT than an income tax. Conversely, the tax burden is lighter in good years under a VAT than an income tax.
Thus, in terms of net (after tax) income, the use of a VAT-type business tax increases the cyclical sensitivity of Michigan businesses (making bad years worse and good years better), while reducing the cyclical sensitivity of Michigan government.[9]
Cyclicality of a VAT
The VAT-type SBT limits the cyclicality of revenue to the State government, but increases the cyclical pressures on taxpaying businesses. "The benefits of better cyclical stability of tax revenue under a VAT must be discounted by the cost of increased cyclical instability for the taxpaying businesses and individuals.
The third major advantage of a VAT-type SBT cited by the Treasury is its better treatment of investment:
A stronger incentive for new investment is created by fully deducting capital costs under the SBT compared with depreciation deduction of business income taxes. [10]
Both income (profits) and Value-added tax systems recognize that capital expenditures should be excluded from the tax base, with the profit (or value-added) from that investment included in the tax base. The difference between the two lies in the timing of those deductions; a profits tax allows annual depreciation deductions which sum to the cost of the investment, while a consumption-type VAT deducts the full amount in the year it was made. [11]
An ideal tax system is neutral between consumption and investment, meaning that the true, interest-adjusted cost of consuming goods today, and later consuming the proceeds from today's investment, are equivalent. Investment in the current period produces consumption in later periods, and if that consumption is fully taxed, then the full value of investment is included in the tax base at the time that value is realized. [12] See the example in Table One.
Although depreciation schedules allow, deductions that sum to the historical cost of the investment, the net present value (the sum of the present and future values, discounted to account for the time value of money) of the depreciation deductions is less than that of the investment. This problem becomes especially severe in times of inflation, because the costs of replacing capital investments grow, while the depreciation deductions do not. By allowing full expensing in the year a capital expenditure is made, the SBT does not discriminate against investment, avoids compounding the impact of inflation, and remains nearly neutral between consumption and investment. [13]
The SBT and Capital Expenditures
Because the depreciation deductions allowed in most profits tax systems understate the true cost of capital expenditures, consumption-type VAT's like the SBT are more favorable to capital expenditures than profits taxes. Because many of Michigan's major industries are capital-intensive, this more-neutral treatment of investment is a major advantage of the SBT over the profits tax systems in other states. The full expensing of capital investments under the SBT encourages businesses to invest in Michigan.
TABLE 1
Example: Neutrality Between Consumption and Investment Under a Consumption-Based Value-Added Tax
|
|
Tax Base: $100 Consumed |
Tax Base: $I00 Invested |
|
Year 1 |
$100 |
0 |
|
Year 2 |
$100 |
0 |
|
Year 3 |
0 |
$112.36 |
|
Sum |
$100 |
$112.36 |
|
Net Present Value |
$100 |
$100 |
In the first case, $100 consumed leaves $100 in the tax base. In the second case, the same $100 invested for three years at 6% annual interest leaves zero in the tax base for two years, but yields $112.36 into the tax base in the third year. The net present value of both is the same, meaning the tax system is neutral between consumption and investment.
The SBT has interesting effects on the capital/labor decision of the firm. A consumption-type Value-Added Tax is neutral between consumption and investment. However, when compared with profits taxes relying on depreciation schedules (which actively discourage investment) the SBT is significantly more favorable to capital investment.
The interaction of the SBT with other business-climate factors – notably wages, Unemployment Insurance and Workers' Compensation costs – does affect the capital/labor decision of the firm. Because these components of total labor cost are significantly higher in Michigan than the U.S. average, (while capital costs are not significantly higher in Michigan than elsewhere), the full inclusion of all payroll costsin the SBT base magnifies the already-existing cost differential. [14]
This effect is overwhelmed for some firms by the Excess Compensation Deduction to the SBT. In certain cases, the Excess Compensation Deduction provides a substantial cost advantage for the hiring of new labor over the purchase of new equipment. [15] However, this deduction is not available for all firms, and overall labor costs affect more business decisions than the narrow provisions of certain deductions to theSBT. Thus, while a consumption-type VAT is technically neutral between capita! and labor, the total cost structure (including the SBT) facing Michigan business favors capital over labor. The most powerful way for Michigan to improve employment prospects (aside from encouraging economic growth) would be to lower total labor costs, not to attempt to penalize capital or subsidize labor in the tax code.
The accounting procedure for capital expenditures under the SBT is the reverse of traditional profits taxation. Traditional profits taxes using depreciation schedules allow no deduction for a capital expenditure, but subtract depreciation from the tax base. The SBT adds back in the depreciation, then subtracts capital expenditure. Because the sum over time of depreciation equals the (historical) cost of the capital expenditure, the two systems both deduct the full historical cost of a capital investment.
The difference lies in the timing of the deductions; a consumption-type VAT deducts the full cost in the year the capital investment is made, while a profits tax spreads the deductions across the depreciable life of the investment.
Recognizing the essential principle behind the taxation of capital expenditures – that the historical costs of investments are deducted from the tax base, while the profits or value-added are included – is crucial to the selection of an appropriate tax base for the SBT, and will be used later in this report.
To see this more clearly, examine the hypothetical firm in Table Two. The firm makes a 55,000 capital expenditure in year one, depreciating it over three years under a profits tax, and deducting it entirely in year one under a consumption-type VAT. Under both systems, the firm reduces its tax base by exactly $6,000. Under a profits tax the deduction is spread over three years, while under a VAT it is taken entirely in year one.
The actual calculation of the SBT starts with Federal Taxable Income. which is Gross Business Income (before taxes or capital costs) less depreciation. To arrive at the SBT taxable income, add back in depreciation (to zero out the prior deduction under the federal system), and then subtract capital expenditures. Finally, add in labor and interest expenses to equal Value-Added, which is the proper base for theSBT. [16]
TABLE 2
Example: Comparison Between Consumption-based VAT and Profits Tax Systems In the Taxation of Capital Expenditures
|
Assumptions |
Year 1 |
Year 2 |
Year 3 |
|
Gross Business income (Pre-tax, before capital costs) |
$10,000 |
$10,000 |
$10,000 |
|
Capital Investment |
$6,000 |
0 |
0 |
|
Depreciation |
$3,000 |
$2,000 |
$1,000 |
|
Labor + Interest |
$2,000 |
$2,000 |
$2,000 |
|
|
|
|
|
|
Profits Tax System |
|||
|
Gross Business Income |
$10,000 |
$10,000 |
$10,000 |
|
less: Depreciation |
($3,000) |
($2,000) |
($1,000) |
|
equals: Taxable Income |
$7,000 |
$8,000 |
$9,000 |
|
|
|||
|
Tax Liability = tax rate * Taxable Income |
|||
|
Total reduction in Tax Liability because of capital investment: tax rate * SUM(depreciation) = tax rate * 6,000. |
|||
|
|
|||
|
Value-Added Tax System |
|||
|
Gross Business Income |
$10,000 |
$10,000 |
$10,000 |
|
less: Depreciation |
($3,000) |
($2,000) |
($1,000) |
|
equals: Taxable Income |
$7,000 |
$8,000 |
$9,000 |
|
plus: Depreciation |
$3,000 |
$2,000 |
$1,000 |
|
less: Capital Expenditure |
($6,000) |
0 |
0 |
|
plus: Labor + Interest |
$2,000 |
$2,000 |
$2,000 |
|
equals: Value-Added |
$6,000 |
$12,000 |
$12,000 |
|
|
|||
|
Tax Liability = tax rate * Value-Added. |
|||
|
Total reduction in
Tax Liability because of capital investment: |
|||
|
Example: This hypothetical firm made a $6,000 capital expenditure in year one, reducing its tax base by $6,000 over three years under both systems. The systems differed in the timing of the deductions. |
|||
The 1985 Treasury report relies on data gathered from tax returns from firms whose tax years ended between December 1980 and November 1981. The fact that these data are confined to that particular one year period has three important consequences.
First, the 1980-81 period was one of recession in the United States, and of particular economic contraction in Michigan. Therefore, the revenue and profitability of most industries were significantly below historical trend. Importantly, some industries were affected more than others. Procyclical Michigan industries – industries such as manufacturers of durable goods, including automobile manufacturers – tend to exagerrate the national economic cycle. Typically, they have better good years and worse bad years. Because of the prominence of procyclical industries in Michigan's economy, the entire state tends to swing from boom to bust more severely than the nation as a whole. Thus, Michigan suffered worse under the recession than most states. [17]
In addition, the inflation rate was significantly higher then than it has been in recent years – another important element for manufacturers with heavy capital investment. Under profits taxes (like the federal corporate income tax) with fixed depreciation schedules, the depreciation allowances fall quickly behind the cost of investment during periods of inflation. [18]
Because of the unusual and extreme economic climate of the sample period, the relative tax burdens of Michigan industries at that time would probably differ from those calculated during peak years. Thus, the results should not be generalized to the entire cycle.
A second limiting factor of the Treasury data is the short time period: 1980-81. Because industries respond differently to the economic cycle, a minimum of one complete economic cycle must be analyzed to provide a true picture.
A third problem with the Treasury data is its age. Since 1981 began, all the fiscal and monetary policy changes under the Reagan Administration have taken effect, Michigan's economy and economic policies have changed, and the most dramatic tax code changes in a generation have been passed into law. All these have caused substantial changes in the way Michigan business operates. Therefore, the sheer time difference between the sample period and the current date limit the usefulness of any conclusions drawn from the data.
1985 Treasury Report Data Limitations: Unusual Sample Year
The sample period of the Treasury study was a time of extreme economic contraction, which affected some Michigan industries more than others.Insufficient Sample Period
The sample period of the Treasury study was very Short, and does not indicate the behavior of various industries over the entire economic cycle.Old Data
The number and importance of economic changes occurring in the over-five-year time lapse between the sample period and the current date limit the predictive power of the data.
A further problem with the data stems from the grouping of different industries into standard categories. The groupings can hide differences in cyclical sensitivity among industries, which confuses the effect of different economic conditions with the differences in relative tax burdens. This is clearly the case in the Financial Industry category. High interest rates in the sample period benefited insurance companies, but hurt real estate and banking companies. Since all three were grouped together in the same category, the effect of the interest rate cycle was mixed together with underlying differences in tax burdens.
In addition, the different categories contain a widely varying number of firms. Among other problems, this makes the selection of the statistical measure for the "average" tax burden somewhat complicated, and renders impossible the calculation of a measure of variation of the tax burden. [19]
One further aggregation problem arises from the special credits allowed smaller businesses under the SBT, which lower their relative tax burdens. Those industry categories containing a large number of small businesses will have a lower relative tax burden, merely because of the size of the firms in the category. [20]
Aggregation
The groupings of industries into standard categories can hide differences between the industries. In the Financial Industry category, banks, insurance companies, and real estate companies are grouped together, even though substantial differences exist among the three in business operation. Conclusions about a group cannot be generalized to all its components without further analysis of disaggregated data.
Researchers in quantitative social sciences have two resources to work with: methodology, and data. Far too often, they fall in love with the former and ignore the latter. Without good data, quantitative methodology yields little but "statistical artifacts." Computer programmers have a pithy saying for it: "garbage in, garbage out."
In this study of the relative tax burdens of the SBT, the limitations of the data are significant. An honest researcher will report those limitations and qualify the conclusions accordingly.
The data have three limitations due to the sample period, and one due to their aggregation. The sample period limitations prevent an accurate prediction of later relative tax burdens from the results in the sample period. The aggregation limitation will prevent applying the relative tax burden of a category to all the Members of that category.
However, the study still illuminates. A snapshot may not be as good as a motion picture, but it is better than nothing. Moreover, the few other "snapshots" available provide some check on the results from the sample period. Furthermore, the findings that depend on the structure of the SBT hold without regard to the sample period.
Ultimately, the methodology developed here provides a basis for evaluating future data. An accurate "motion picture" of the relative tax burdens awaits only a few more frames of data.
The 1985 Treasury report indicates that similar analyses will be available for years after 1981 "as soon as SBT data are available." The proper methodology to analyze the data is developed in the next section.
To properly determine the relative tax burdens of different Michigan industries, some measure of the tax base corresponding to Michigan operations must be selected. [21] The appropriate measure would include all of the tax base included in the consumption-based Value-added concept of the SBT, but ignore special adjustments, exemptions, and exclusions. Thus, the tax liability divided by the proper tax base would give an appropriate measure of the relative SBT burden.
As discussed above, the appropriate tax base for a consumption-based VAT like the SBT is gross business income, plus depreciation, plus labor and interest, less capital expenditures: the Adjusted Tax Base. [22] Dividing the tax liability of an industry by its Adjusted Tax Base yields an appropriate tax burden ratio.
The 1985 Treasury Report supports the use of this tax base in their description of the SBT, specifically addressing the expensing of capital expenditures:
Although the SBT base is computed by adding together a number of business costs and some income, the base is equal to sales minus materials and capital purchases. All receipts not used to purchase (or lease) capital and materials represent value-added and are taxed. [23]
Furthermore,
The SBT base is all of the increased value to materials caused by the production process. Although capital expenditures are deducted when made, the value-added because of that capital equipment is reflected in the base and is taxed. Profit, which is the return to the investor, is also part of value-added and is taxed. [24]
And again,
The SBT takes the last approach [a full deduction for capital expenditures]. When a value-added tax allows a full deduction for capital expenditures, it is called a consumption type value-added tax, because, in a national sense, the tax base equals consumption. That is, the base is equivalent to total income less purchases of capital goods, which is total consumption. [25]
However, despite the design of the SBT, which clearly outlines the tax base, and the above reasoning quoted from their report, the Treasury did not choose to use this tax base in their 1985 report.
The tax base the Treasury used, called "Michigan Tax Base," includes all the true tax base without the expensing of capital expenditures.This Michigan Tax Base is computed by adding labor and interest costs to profit, and adding depreciation (all steps taken to reach the true tax base), but not subtracting capital expenditures.
This approach ignores capital expenditures, which distorts significantly the tax base. The measure arrived at bears no conceptual identity with a consumption-type value-added tax, does not represent the SBT base, and does not even resemble a traditional profits tax base. [26]
To give one example of the perverse indications such a tax base would produce, consider that a firm that made a large capital expenditure – such as purchasing a building – would experience no change in its Michigan Tax Base, even though its SBT tax base (the Adjusted Tax Base), its SBT liability, its federal corporate income tax base, and its federal corporate income tax liability would all decline.
The conceptual problem with the Treasury's approach is clear. The SBT, as a VAT, takes into account every employee's wages, all material costs, the interest on bank deposits, and every sale. To exclude capital expenditures from the system would be to turn an extremely broad, inclusive tax into a distorted half-view of a company, where the purchase of a box of paperclips matters more than that of a million-dollar building. [27]
Indeed, the Treasury report flatly states that the correct base to use is the Adjusted Tax Base:
Michigan Tax Base less net capital acquisition deductions, which we call "adjusted tax base," represents the appropriate base of a consumption-type value-added tax. [28]
In addition to the clear evidence to the contrary in the 1985 report, the Treasury's tax base selection contradicted an earlier State government analysis of the SBT. The 1981 Department of Management and Budget (DMB) publication Analysis of the Michigan Single Business Tax: A Business Development Perspective contained similar descriptions of the construction of the SBT as the Treasury's 1985 report and correctly used the Adjusted Tax Base to measure tax burdens across industries. [29] Unfortunately, the 1981 study provided only summaries of the tax burden as a percentage of industry tax bases. [30]
The 1985 Treasury report gave no explanation for its substitution of the Michigan Tax Base for the Adjusted Tax Base, despite its use in the previous analysis and the justification for it in the text of the study.
Since the appropriate measure of the SBT base is the SBT base, the tax burden analyses in this study rely on the Adjusted Tax Base for the Michigan SBT.
The use of an incorrect tax base, such as the Michigan Tax Base, introduces systematic bias into the results. Because the Michigan Tax Base includes both the capital expenditure and its depreciation in the tax base, it biases upward the tax bases of industries that made large capital expenditures in the sample periods. Dividing tax liabilities by the (inflated) Michigan Tax Bases produces, then, tax burden ratios that are biased downward.
Thus, the indicated "effective tax rates" in the Treasury report underestimate the true tax burden. [31]
Because different industries rely on capital expenditures to a varying degree, and because different industries make large capital expenditures at varying times in the business cycle, this bias could produce very large swings away from the underlying true tax burden ratios. Therefore, the magnitude of the bias would change from year to year, meaning again that a reliance on a very short sample period would be clearly misleading.
In addition to the general downward bias on the tax burden ratios in the Treasury study, industries that made substantial capital investments relative to their Michigan Tax Bases during the sample period of the Treasury study seemed to have lower relative tax burden ratios than a proper comparison would have produced, while those who made little capital investment seemed to have higher relative tax burden ratios.
Biased Results from the Use of an Incorrect Tax Base
The 1985 Treasury Report relied on an incorrect measure of the tax base, which ignored capital expenditures. Thus, their analysis systematically biased downward their calculated SBT burdens. The actual tax burdens of Michigan industries were higher than those stated in the Treasury study, particularly for those industries making large capital expenditures in the sample period.
The SBT burdens of various industries during the sample period are indicated by their tax burden ratios, or the ratios of their total SBT Liabilities to their total Adjusted Tax Bases. These ratios are not true tax rates. The marginal tax rate is the portion of the next dollar earned (or dollar added in value) that is paid in tax; it is the true "effective" tax rate because it "effects" the decisions of the firm.
The term "effective tax rates" in the Treasury Report is misleading. The total tax liability divided by the total tax base could be called the average tax rate. The average tax rate, or tax burden ratio as it is called here, is a broad-based ratio that does not necessarily indicate the marginal rate prevailing at any one level of the tax base.
The tax burden ratio simply indicates the share of the value-added tax base consumed in Single Business Tax: a good measure of the tax burden. Table Three in section IV.A., Tables of SBT Data, lists the tax burden ratios for various industries during the sample period.
The concept of "fairness" is difficult to quantify, but economists have generally accepted two measures that are reasonably quantifiable, and have economic justification. The first is known as "vertical equity," and refers to the relative tax burdens of taxpayers of different means. Taxes that take an increasing portion of income as income increases are commonly termed "progressive," while those taking a smaller portion are termed it regressive." Those that take the same fraction of income at every income level are termed "proportional."
The economic justification for vertical equity holds that the tax system should not penalize some taxpayers with higher rates simply because of different sized income (or value-added), and hence favor economic production of one group over another. While some have argued that the state should have a "progressive" tax system, this argument does not generally rely on economic reasoning. [32]
In the context of the Single Business Tax, vertical equity would refer to similarity in tax burden ratios as the size of the firm increased. Measuring this was a major goal of the 1985 Treasury report, which concluded that the relative SBT burden increased as firm size increased. [33] However, as this result was based on the use of an incorrect tax base, the true distribution of the relative SBT burden was not established.
The credits available to smaller businesses clearly make the SBT progressive. According to the Treasury, 60% of Michigan firms paid no SBT in the sample period 1980-81, primarily small firms. This nominal progressivity must be weighed against the larger administrative burden placed on smaller businesses. Given the considerable complexity of the SBT, the compliance burden is proportionately larger for smaller businesses than larger ones. Large businesses in general can spread the administrative costs of complying with government regulations, laws, and taxes across a larger profit base. Thus, the SBT tax liabilities are proportionately less burdensome for smaller businesses, while their compliance burdens are larger.
A major objective of this study is to determine "horizontal equity," or the equivalent treatment of taxpayers of equivalent size. Economic theory holds that, if certain industries earn a higher risk-adjusted after-tax return on investment, then resources will flow from other industries to that industry. In order to maintain the most efficient use of resources, and therefore encourage economic growth, the tax code should remain as neutral as possible among industries. In the context of this study of the SBT, a similar SBT burden among various industries would constitute "horizontal equity," or "fairness."
A related objective of this study, to determine whether the SBT favors business expansion in Michigan when compared with other state business taxation systems, relies on the same theoretical foundation: if Michigan's business tax burdens are higher than in other states, businesses have the incentive to relocate to other states.
There are other questions regarding the "fairness" of the SBT that economic theory cannot answer well. For example, the SBT, as a VAT, forces money-losing businesses to pay taxes during poor economic years. For those who favor income as a measure of "ability to pay," this makes a VAT "unfair." The underlying issue is the relationship of government to society: does government serve society, or vice versa? The SBT helps government stabilize its revenue stream, but at the expense of businesses.
The State's fiscal constraints and the power to tax affect this question. Michigan, like many states, operates under a requirement for a balanced budget. This limits its flexibility to borrow in order to finance expenditures in depressed economic times. On the other hand, the creation of "rainy day funds" allows a reserve against these situations, the balanced budget requirement allows exceptions, and the legislature can always take the expenditure-cutting and revenue-increasing steps to balance its budget. By putting businesses under a tax that increases their cyclical strain, the government is essentially forcing them to take the painful steps, in order to preserve its revenue stability.
TABLE 3
Tax Burden Ratios For Michigan Industries
|
Industry |
Tax Liability |
Adjusted Tax Base |
Ratio: Tax Liability to Adjusted Tax Base |
|
Agriculture |
1,830,107 |
130,546,776 |
0.0140 |
|
Mining |
3,471,179 |
259,275,339 |
0.0134 |
|
Construction |
32,642,134 |
2,237,827,202 |
0.0146 |
|
Other Durable Manufacturers |
60,346,853 |
3,229,543,856 |
0.0187 |
|
Non-Durable Manufacturers |
74,610,988 |
3,606,992,660 |
0.0207 |
|
Primary Metal Industries |
24,380,936 |
1,316,492,443 |
0.0185 |
|
Fabricated Metal Industries |
28,633,488 |
1,570,412,992 |
0.0182 |
|
Machinery-Except Electrical |
37,756,652 |
2,064,102,691 |
0.0183 |
|
Transportation Equipment |
124,037,723 |
7,188,965,137 |
0.0173 |
|
Transportation |
3,795,374 |
211,251,883 |
0.0180 |
|
Communication & Utilities |
13,022,630 |
581,721,184 |
0.0224 |
|
Wholesale Trade |
33,896,755 |
1,752,835,773 |
0.0193 |
|
Retail Trade |
158,087,141 |
9,877,218,856 |
0.0160 |
|
Finance, Real Estate & Insurance |
32,123,947 |
957,616,540 |
0.0335 |
|
Services |
102,368,436 |
6,848,594,769 |
0.0149 |
|
All Industries Sum |
731004343 |
41833398101 |
0.0175 |
|
Size Weighted Mean |
96105592 |
5978482481 |
0.0180 |
|
Simple Mean |
48733623 |
2788893206 |
0.0185 |
|
About Simple Mean Standard Deviation |
45259224 |
2838308037 |
0.0047 |
Source: Author’s calculations from Michigan Department of the Treasury data.
TABLE 4
The Single Business Tax Burden on Michigan Industries SBT Data for Michigan Industries, 1980-81
|
# |
Industry |
Size |
Tax Liability |
Business Income* |
Adjusted Tax Base |
Ratio: Tax Liability to Adjusted Tax Base |
Ratio: Tax Liability to Business Income** |
|
1 |
Agriculture |
1278 |
$1,830,107 |
($12,602,299) |
$130,546,776 |
0.0140 |
1.0000 |
|
2 |
Mining |
650 |
$3,471,179 |
$27,191,969 |
$259,275,339 |
0.0134 |
0.1277 |
|
3 |
Construction |
10751 |
$32,642,134 |
$101,594,020 |
$2,237,827,202 |
0.0146 |
0.3213 |
|
4 |
Other Durable Manufacturers |
3884 |
$60,346,853 |
$438,663,253 |
$3,229,543,856 |
0.0187 |
0.1376 |
|
5 |
Non-Durable Manufacturers |
2645 |
$74,610,988 |
$1,003,399,373 |
$3,606,992,660 |
0.0207 |
0.0744 |
|
6 |
Primary Metal Industries |
504 |
$24,380,936 |
$91,085,053 |
$1,316,492,443 |
0.0185 |
0.2677 |
|
7 |
Fabricated Metal Industries |
1765 |
$28,633,488 |
$171,215,354 |
$1,570,412,992 |
0.0182 |
0.1672 |
|
8 |
Machinery-Except Electrical |
2118 |
$37,756,652 |
$329,437,362 |
$2,064,102,691 |
0.0183 |
0.1146 |
|
9 |
Transportation Equipment |
438 |
$124,037,723 |
($1,093,328,495) |
$7,188,965,137 |
0.0173 |
1.0000 |
|
10 |
Transportation |
2062 |
$3,795,374 |
($118,151,923) |
$211,251,883 |
0.0180 |
1.0000 |
|
11 |
Communication & Utilities |
743 |
$13,022,630 |
($20,903,441) |
$581,721,184 |
0.0224 |
1.0000 |
|
12 |
Wholesale Trade |
4152 |
$33,896,755 |
$442,610,720 |
$1,752,835,773 |
0.0193 |
0.0766 |
|
13 |
Retail Trade |
40183 |
$158,087,141 |
$890,310,451 |
$9,877,218,856 |
0.0160 |
0.1776 |
|
14 |
Finance, Real Estate, & Insurance |
13965 |
$32,123,947 |
($52,666,508) |
$957,616,540 |
0.0335 |
1.0000 |
|
15 |
Services |
38095 |
$102,368,436 |
$1,222,578,432 |
$6,848,594,769 |
0.0149 |
0.0837 |
|
|
All Industries Sum |
123233 |
$731,004,343 |
$3,420,433,321 |
$41,833,398,101 |
0.0175 |
0.2137 |
|
|
Size Weighted Mean |
NA |
$96,105,592 |
$723,922,000 |
$5,978,482,481 |
0.0180 |
NA |
|
|
Simple Mean |
8216 |
$48,733,623 |
$228,028,888 |
$2,788,893,207 |
0.0185 |
NA |
|
|
About Simple Mean Standard Deviation |
12697 |
$45,259,224 |
$533,693,460 |
$2,838,308,037 |
0.0047 |
NA |
*Business Income data contains non-sample firms; overestimates Business Income for each category.
**Ratio constrained to be nonnegative, less than one; if denominator is negative, evaluated at 1.0. Ratio is an underestimate of true ratio because of overestimated denominator.
Source: Author's calculations from Michigan Department of Treasury data
TABLE 5
Comparison with Treasury Analysis of Tax Burdens
|
Industry |
Ratio: Tax Liability to Michigan Tax Base |
Ratio: Tax Liability to Adjusted Tax Base |
|
Agriculture |
0.0120 |
0.0140 |
|
Mining |
0.0100 |
0.0134 |
|
Construction |
0.0134 |
0.0146 |
|
Other Durable Manufacturers |
0.0165 |
0.0187 |
|
Non-Durable Manufacturers |
0.0168 |
0.0207 |
|
Primary Metal Industries |
0.0167 |
0.0185 |
|
Fabricated Metal Industries |
0.0165 |
0.0182 |
|
Machinery- Except Electrical |
0.0163 |
0.0183 |
|
Transportation Equipment |
0.0112 |
0.0173 |
|
Transportation |
0.0115 |
0.0180 |
|
Communication &Utilities |
0.0133 |
0.0224 |
|
Wholesale Trade |
0.0172 |
0.0193 |
|
Retail Trade |
0.0143 |
0.0160 |
|
Finance, Real Estate & Insurance |
0.0125 |
0.0335 |
|
Services |
0.0127 |
0.0149 |
|
All Industries Sum |
0.0139 |
0.0175 |
|
Size Weighted Mean |
0.0137 |
0.0180 |
|
Simple Mean |
0.0141 |
0.0185 |
|
About Simple Mean Standard Deviation |
0.0023 |
0.0047 |
Source: Author’s calculations from Michigan Department of the Treasury data.
The data in Table Three show the SBT burden as a fraction of the Adjusted Tax Base for each industry category. This varies considerably, from 0.0140 (1.4%) for Agriculture to 0.0335 (3.35%) for Finance, Real Estate, and Insurance.
The average of all businesses (size-weighted average of the categories) was 0.0180 (1.8%). [34]
The relatively high tax burden ratio of the Financial industry occurred partially because large numbers of Financial companies were losing money during the sample period. When a substantial portion of firms have negative tax bases, the aggregate tax burden ration for the industry can exceed the statutory rate of 2.35%. [35]
As the previous discussion of the aggregation and limited-sample-period problems of the data revealed, the results for this period cannot be generalized across the entire economic cycle, nor for all business types within each category.
Relative Tax Burdens
The SBT burden as a percentage of the Adjusted Tax Base varied considerably across industries during the sample period, ranging from 1.4% for Agriculture to 3.35% for Finance, Real Estate, and Insurance. The average tax burden ratio for all firms was 1.8%.
The results from this study are similar to those found in the 1981 DMB study:
The effective rates of the SBT as a percent of value-added, range from less than 1.4% for transportation, general merchandise and food retailers, to more than 2.2% for finance, insurance and real estate, crude petroleum and natural gas, food and kindred products, chemical and allied products, petroleum refining, electrical machinery, utilities and hotel and lodging.
The average effective tax rate for all sectors is 1.93 percent. [36]
This result, based on correct methodology and 1977-78 data, is in line with the results in this study based on 1980-81 data.
The data in this study reveal a much larger variation in tax burdens, and an overall higher tax burden ratio, than had been claimed in the 19$5 Treasury study. Table Five compares the tax burden ratios calculated by the Treasury, and those calculated in this study. As discussed in the previous sections on Methodology, the difference lies in the treatment of capital expenditures. The Treasury analysis ignores capital investments, thereby inflating the tax base and biasing downward their ratios. This analysis properly deducts capital expenditures to arrive at the tax base, as required by the design of the SBT.
When data for an entire economic cycle are available, the tax burden ratios should be calculated for each industry after properly accounting for capital expenditures. Only then will a conclusive answer be found to the question of relative tax burdens.
Comparison with Treasury Results
The tax burden ratios are higher and more varied than those reported in the Treasury study. To conclusively determine relative tax burdens, data from one complete economic cycle must be analyzed, using the proper methodology.
For a tax system to be "fair," it should levy taxes in a similar proportion of the tax base for all industries and for all size firms. This satisfies both "vertical" and "horizontal" equity, and encourages the most efficient use of economic resources. The results of this analysis clearly show a large variation in tax burdens as a percentage of the tax base for different industries within the sample period. The prime reason for this variation is the unequal use of the various special credits, deductions, etcetera by Michigan's industries. Some industries receive little tax reduction, while others receive a great deal. This result corresponds with the 1981 DMB study of the SBT and the 1984 Kalamazoo Chamber report. [37]
Because of the data limitations, this cannot be generalized across the cycle. However, it does indicate that the SBT may place a heavier burden on some industries than on others. Further analysis of the data from a complete economic cycle would answer that question.
The "Fairness" of SBT Burdens on Michigan Industries
For a tax system to be equitable and efficient, it must levy a similar proportionate burden for firms of different size and in different industries over the entire economic cycle. During the sample period, the tax burden ratios varied significantly, indicating that there may be a bias against some industries in the SBT caused by unequal use of special credits and deductions.
For the sample period available, the tax burden of the Finance, Real Estate, and Insurance industry was the highest of all industries. Because of the data limitations and the structure of the SBT, this result cannot be generalized across the entire economic cycle. However, it is clear that the various exemptions, credits, etc., available that could lower the tax burden did not benefit the Financial Industry as much as other industries.
While a better picture of the tax burden over the complete economic cycle should be developed, the 1981 DMB study based on 1977-78 data confirms the relatively high-tax position of the Financial Industry. [38]
The Tax Burden of the Financial Industry
During the sample period, the tax burden of the Financial industry was the highest of all industries. While data from a complete cycle are needed to conclusively establish relative burdens, there is no basis to conclude that the Financial industry escapes its share of the SBT burden.
Table Four shows more complete data about Michigan industries. Table Four also shows the SBT burden as a fraction of Business Income (profit), in order to establish some comparison between the burden placed by the SBT and a (hypothetical) equivalent profits tax.
Of course, part of the rationale of the SBT is that value-added is a better tax base than profit. Because profit serves as the tax base for most business tax systems, (including the federal corporate income tax, which provides the starting point for calculating the SBT), businesses usually have an incentive to reduce declared profits in order to reduce tax liability. Similarly, Michigan businesses have an incentive to reduce portions of their operations (such as payroll) that contribute to the SBT base. Thus, direct comparisons should be viewed with caution, since businesses will change their operations to lower their tax liabilities.
The 1981 DMB study compared the SBT with a hypothetical state corporate income tar. The study found that an equivalent revenue would have been raised from a 9.7% corporate income tax (with no exemptions) as from the SBT in 1977-78. [39] As noted above, this static analysis ignores the behavioral changes firms would make if actually subjected to a corporate income tax. Furthermore, it ignores non-corporations.
Besides the conceptual problems in static comparisons of tax systems, there are two difficulties with the calculation in Table Four. First, for many industries Business Income was negative during the period. Thus, a simple ratio would have a negative denominator. As a correction, the table constrains the ratio to be nonnegative and less than or equal to one. For industries that lost money but paid SBT, the ratio reads 1.000, meaning that the industry paid 100% of its (nonexistant) profit in SBT.
This method has the advantage of showing a high tax burden ratio for industries that lost money but paid taxes. In addition, the carryforward provisions of most income tax systems (and the SBT) allow a firm with a negative tax base in one year to carryforward the excess to the next year, thus offsetting some positive tax base in the future. The use of "tax loss carry forwards" thus creates the opportunity for eventual 100% offset of loss.
The second difficulty with the comparison of Business Income with SBT Liability is the overestimate of Business Income contained in the data. While the other data in this study refer to firms in the SBT sample, which contains 95% of all firms, the Business Income data refers to all SBT filers. [40] The Treasury states that the Business Income data are unavailable for the sample alone.
Therefore, comparing Business Income of all firms with the SBT Liability of only the firms in the sample yields an underestimate of the fraction of profits paid in SBT. Given these two difficulties, the SBT/Business Income ratio should be used with caution. That notwithstanding, the data yields some startling results.
The first result is the extreme variation in the fraction of profits paid in SBT, ranging from about 7% for Non-Durable Manufacturers to over 100% for Agriculture, Transportation and Transportation Equipment, Communication & Utilities, and Finance, Real Estate & Insurance.
The second result is the startlingly high percentage of the total Business Income of Michigan businesses paid in SBT. Even with the overestimate of Business Income contained in the data, the ratio of SBT Liability to Business Income exceeds 20%!
These results illustrate the points made earlier about the cyclical intensity of the SBT, and the dangers of relying on a short sample period. The sample period for the Treasury data was 1980-81 – a time of deep recession. The SBT system required significant tax liabilities for Michigan firms, even though many were losing money. Given this cyclical intensity of the SBT, the ratio of aggregate SBT Liability to aggregate Business Income would probably drop sharply in good economic times. Without examining the data for a complete economic cycle – down years and good years – an accurate view of the SBT burden is just not available.
The SBT Burden Compared with Profits
The aggregate SBT liability of Michigan firms represented over 20% of their pre-tax profits in the sample period. The SBT clearly intensifies the cyclical pressures faced by Michigan businesses; this ratio probably drops sharply in good economic years.
In the past several years, a large number of careful studies have documented the relationship between relative tax burdens in different states and economic performance. These studies document a strong inverse relationship between personal tax burdens and economic performance, measured by income or employment. These studies conclude that high personal tax burdens slow down the economic growth of a State. [41]
The relationship between business tax burdens and economic growth has not been established as strongly. In part, this is due to the fact that businesses do not "pay" tax as much as they collect it. Every dollar of business taxation comes from one of three sources: consumers, workers, or investors. The incidence of business taxation among these three parties has been the subject of much debate but little consensus.
In addition, the effectiveness of various government incentives in attracting businesses has not been proven. While these incentives can have a large affect on individual firm's decisions if the incentives are large, they are often ignored in favor of larger considerations. [42]
On the whole, while the evidence concerning the effectiveness of business taxes and business incentives on business location is mixed, the evidence concerning personal tax burdens is strong. The slow, cumulative effect of differences in incentives and tax burdens obviously affects the growth patterns of industry.
Comparing Michigan's business tax burden with that of other states is complicated by the uniqueness of the SBT. One method overcoming this difficulty is to compare the total tax burdens as a percentage of Personal Income. This method ignores the incentive effects imbedded in different tax rates, but accurately compares the burden with the ability to pay.
US Census Bureau data show that Michigan's 1984-85 Corporate Taxation burden was the second highest among the 50 states per $1,000 of personal income, and the highest among the 11 Midwestern states. [43] Michigan's corporate tax burden of $12.17 per $1,000 of personal income was nearly double both the national average of $6.45, and significantly higher than its closest Midwestern competitor, Wisconsin, at $6.96.
This method of comparing business tax burdens is not extremely precise, because of the uniqueness of the SBT, the multi-state and multi-national character of many corporations, and the uncertainty surrounding the incidence of business taxation. Nevertheless, these statistics clearly establish that Michigan's business tax burden is high. The finding above that the aggregate SBT burden represented over 20% of the aggregate pretax income of Michigan firms in the sample period confirms this fact.
Placing business taxation in the context of all state taxation, US Census Bureau data establish that Michigan's personal tax burden is clearly high, particularly for income and property taxes. Furthermore, Michigan's high personal tax burden bears considerable blame for its relatively poor economic performance in recent years. [44]
Thus, the tax burden in Michigan for both businesses (who pass taxes along) and individuals (who pay taxes directly) is clearly high. Given this fact, the Legislature should consider lowering the overall tax burden in the State both for business and individual taxpayers.
Business and Personal Tax Burdens in Michigan
Both business and personal tax burdens in Michigan are significantly higher than the national average. US Census Bureau data show that Michigan's 1984-85 Corporate Taxation burden was the second highest in the nation, double the national average. The finding in this study that the aggregate SBT burden represented over 20% of pretax income for Michigan businesses confirms the large business tax burden of the SBT. Because both theory and experience show that high tax burdens discourage economic growth, the Legislature should lower the overall tax burdens in the State.
The appropriate use of summary statistics in the Tables requires some comment. The "All Industries Sum" line refers to the sum of all the categories. The All Industries Sum ratios are ratios of these totals. The "size weighted mean" line refers to the mean (average) of the categories, weighted by the size of each category (number of firms). The size weighted mean is identical to the mean of all the firms within all the categories. This differs from the simple mean, which is the mean of the categories without regard to the different size of the categories.
The "About Simple Mean Standard Deviation" refers to the standard deviation of the categories around the simple mean. Because the information on the variation within the categories is lost in this kind of grouped data, a true measure of the variation among all firms cannot be calculated.
Analysis of the Michigan Single Business Tax,(Taxation and Economic Policy Office, Michigan Department of the Treasury, January 1935). [Hereafter cited as Analysis of the Michigan SBT (1985)]. I. Introduction, page 2. The Introduction continues; "A secondary purpose of this report is to investigate the revenue variability of the Single Business Tax and how and why changes in economic conditions affect revenue variability."
Analysis of the Michigan SBT (1985), II. History, p. 19.
See the discussion in section II.D., The SBT and Capital Investment, below.
See the discussion of "fairness" in taxation in section IV. Note that "comprehensiveness" here means the inclusion of all types of economic behavior in the tax base.
The principle known as "Occam's Razor" holds that, among two alternatives of equal effect, the simpler is better.
Mutual Cease-fire and Unilateral Disarmament, the Report of the Kalamazoo Chamber of Commerce SBT Taskforce, Kalamazoo, Michigan: Kalamazoo Chamber of Commerce, 1984, [hereafter cited as The Kalamazoo Chamber Report (1984)] lists eleven initial purposes for the SBT, including better equality of treatment.
The Governor's 1985 "Tax Fairness Plan" and 1987 "10/20" plan both call for taking the domestic insurance industry out of the SBT system and placing it under a sales-type (premiums) tax, along with increasing the intangibles tax on bank deposits.
The use of a tax system that stabilizes the government rather than the private economy turns the traditional Keynesian notion of countercyclical fiscal policy on its head. Keynesian macroeconomic theory proposed that the Federal government could stabilize the private economy, by spending more (or taxing less) during downturns, and spending less (or taxing more) during upturns. The SBT has an opposite effect: it places a larger tax burden (as a percentage of income) on the private economy during bad years, and a smaller during good years.
Keynesian macroeconomic theory has little use in the analysis of State fiscal policy. First, the Michigan constitution requires a balanced budget, which sharply limits the freedom of fiscal policy. Second, a state economy is more "open" (dependent on trade and capital flows) than a national economy, which virtually eliminates the effectiveness of fiscal policy. Third, states cannot pursue independent monetary policies. Classical macroeconomic theory, (of which the recent emergence of "supply side" analysis is an example), particularly the analysis of tax incentives, has proven more useful in explaining State economic growth.
Patrick L. Anderson, Michigan in the Current Recovery: A Historical Perspective, Chicago, IL: The Heartland Institute, 1986, page 18. While this study focuses more on personal taxes in Michigan than business taxes, it does point out the importance of business climate factors, including business taxation, in determining economic growth.
Analysis of the Michigan SBT (1985), II. History, p. 19.
To be more precise, the federal corporate income tax system in the United States over the past half-century has allowed depreciation deductions, with the schedules changing frequently. Allowing full deductions for capital expenditures in the year they were made is called expensing capital expenditures, and would have the same neutrality between current consumption and investment (postponed consumption) that a consumption-type VAT exhibits.
In addition to periodically changing the depreciation schedules, the U.S. Congress has periodically allowed an Investment Tax Credit (ITC) to offset part of the inherent bias against investment stemming from depreciation schedules, particularly in times of high inflation. Full expensing, like in the SBT, exhibits neutrality without additional credits.
Michael A. Schuyler, Consumption Taxes: Promises and Problems, Washington. DC: Institute for Research on the Economics of Taxation (IRET). 1984. Schuyler's book discusses many types of consumption-based tax systems, including a consumption-based VAT for businesses.
The expensing of capital investments under the SBT eliminates the taxflation effect inherent in depreciation schedules. However, since the exemptions to the SBT are stated in nominal terms, their real value is whittled away by inflation, leaving some taxflation. See section III.A.1., Data, for a discussion of the data taken from an inflationary year.
Patrick L. Anderson, Michigan in the Current Recovery: A Historical Perspective, Chicago, IL: The Heartland Institute, 1986, details the higher costs associate with hiring workers in Michigan. The study's short discussion of the SBT deserve; greater comment. As discussed below, the SBT is technically neutral between capital and labor, but also admits a labor-subsidizing special deduction, and fully includes Michigan's expensive total labor costs in the tax base. Incorporating all these factors. Michigan's entire cost structure (including the SBT) favors capital over labor.
Analysis of the Michigan SBT (1985), V11. Economic Effects of the SBT Reduction Features, p. 50.
Analysis of the Michigan SBT (1985), II. History and Description, Table I Their are conceptual difficulties in applying a VAT to financial companies, including the problem of double-counting, and the fact that interest costs and earnings become costs of materials and value-added for a financial firm. The SBT has special provisions applying to financial firms that adapt the VAT concepts. Nonetheless, some questions remain about the proper way to tax financial companies under a VAT. These are beyond the scope of this study.
Patrick L. Anderson, Michigan in the Current Recovery: A Historical Perspective, Chicago: the Heartland Institute, 1986, provides a detailed comparison of Michigan's business cycle performance with the nation's.
This phenomenon is known as taxflation. See section II.D., The SBT and Capital Investment, on why a consumption-type VAT does not cause taxflation.
The mean of all industries (the average of the group averages) willbe different than the mean of all businesses (the average of all the businesses in all the categories). The size-weighted mean will be identical to the mean of all businesses, and is the appropriate measure of the "average" tax burden.
The variation of tax burdens cannot be calculated, because the group data do not contain information on the variation within each group. Thus, a Standard Deviation cannot be calculated for the tax burden ratio.
See the discussion of progressivity in the SBT in section III.B.4, Measures of "Fairness," below.
Analysis of the Michigan SBT is complicated by the fact that many firms do business in more than one state, and SBT liability is based only on the apportioned Michigan tax base. Apportionment is based on a three factor formula for most industries, with the Michigan apportionment fraction equal to the equally weighted average of three ratios: Michigan property over total property, Michigan payroll to total payroll, and Michigan sales to total sales. However, the apportionment formula for some industries, such as the financial industry, differs. The difference may cause some bias, but this report does not investigate it.
This formula could also be calculated by the subtractive method to yield the same results: Value-Added equals Sales – Materials – Capital Purchases. Analysis of Michigan SBT (1985), II. History and Description, p. 21.
Analysis of the Michigan SBT (1985),"Myths and Realities," p. 16.
Analysis of Michigan SBT (1985), IT. History and Description, p. 23.
Analysis of the Michigan SBT (1985); II. History and Description, p. 21.
One argument for the use of the Michigan Tax Base is that it is "broader" than the Adjusted Tax Base. However, by neglecting to expense capital expenditures, the use of the Michigan Tax Base actively distorts the tax base, rather than merely making it "broader." Neglecting to deduct materials purchases would also make the tax base "broader" (larger), yet would likewise distort the tax base.
In addition, as noted in the text, the notion that ignoring capital expenditures makes the tax "broader" ignores the reality of capitalism, which relies on capital expenditures.
An additional example is the decision of the firm to either lease or buy: under the proper description of the SBT, the full expensing of capital expenditures and the exclusion of lease payments make the tax neutral between leasing and purchasing – a point properly made by the Treasury on page 21 of their report. If, however, capital investments were neither expensed nor depreciated, firms would have a massive disincentive to purchase rather than lease.
Analysis of the Michigan SBT (1985), IV. Tax Base, p.29.
Analysis of the Michigan Single Business Tax: A Business Development Perspective, Lansing: Office of Revenue and Tax Analysis, Michigan Department of Management and Budget, October1981. This study did not provide detailed comparisons of industry tax burdens, but noted on page 3 the relative tax burdens "as a percent of value-added". Table 1.2 on page12 outlined the calculation of this tax base.
See sections III.B., The SBT Tax Burden Ratios, and III.C., The Fairness of the SBT.
It is possible to overestimate the tax burden for an individual firm using this approach; if a firm has sold more capital assets than it purchased during a year, its net Capital Acquisition Deduction would be negative. Of course. on an economy-wide basis, each negative CAD from a sale of a capital asset is balanced by a positive CAD from its purchase. Furthermore, the economy as a whole normally invests. Each industry category had positive CAD's in the sample period, so the issue is only of academic interest.
There are some economic justifications for lower tax rates for smaller-incomed individuals or firms, such as the economy-of-scale of large firms in complying with taxes, and the need for a minimum exemption. The primary argument for a progressive tax system remains the redistribution of income, not economic growth.
Analysis of the Michigan SBT (1985), VI. Effective Rates, p. 44. In the sample used in the 1985 Treasury study, 60% of firms paid no SBT, and 76% of the firms had SBT liabilities of less than $1,000. The Treasury states that the statutory exemption and capital acquisition deduction act to reduce the effective tax rates of many small firms. While the action of the statutory exemption clearly makes the tax more "progressive." the capital acquisition deduction is an intrinsic portion of the SBT base, and not an "adjustment." (See the discussions at The SBT and Capital Investment and The Selection of a Proper Tax Base.)
Table 14 in the 1985 Treasury Report shows the ratios of Tax Liabilities to Michigan Tax Base (which neglects to expense capital expenditures) for businesses of different sizes. However, the measure used to define business size in the table is the Adjusted Tax Base. Thus, the table's entries do not correspond to both the title and the categories listed.
Note that this falls between the simple mean of the category ratios and the ratio of the All Industries Sum, neither of which are the true average of all businesses. See the section Notes on Test Statistics.
Arithmetically, this occurs because the firms with a positive tax base pay tax at the statutory rate, while those with negative tax bases pay no tax. Thus, the ratio of the aggregate sums of tax liability and tax base can exceed the statutory rate. This phenomenon could also spread across years because of tax-loss carry forwards.
Analysis of the Michigan Single Business Tax: A Business Development Perspective, Lansing: Office of Revenue and Tax Analysis, Michigan Department of Management and Budget, October 1981, pace 3.
The Kalamazoo Chamber Report (1984) concludes that the objective of taxing every business on an equal basis has not been met: "The reasons this objective has not been met are contained in the special deductions and credits available under the tax and resulting evidence of who pays the tax."
The Report reprinted an unpublished Treasury analysis of relative tax burdens, based on 1977-78 SBT data. That Treasury analysis uses the proper tax base, which properly deducts capital expenditures. This appears to be the data underlying the 1981 DMB study.
The 1981 DMB study concludes on page 112: "The calculation of the tax is made very complex and the horizontal equity of the tax is reduced by the many special credits and deductions written into the law. The removal of many of these provisions would allow a significant reduction in the tax rate."
While the supporting documentation of both these studies are not extensive, they corroborate the result in this study: the tax burdens vary significantly, and that the Financial industry faces among the highest burdens.
Analysis of the Michigan Single Business Tax: A Business Development Perspective, Lansing: Office of Revenue and Tax Analysis, Michigan Department of Management and Budget, October 1981, page 3.
Analysis of the Michigan Single Business Tax: A Business Development Perspective, Lansing: Office of Revenue and Tax Analysis. Michigan Department of Management and Budget, October 1981, Chapter Seven, page 85.
Analysis of the Michigan SBT (1985), III. Data and Methodology, pp. 23-24. The report states, "Because the sample is very representative, we believe the proportions shown from the sample are also representative."
Bast et al, The Imperative of Tax Reform, Chicago, IL: The Heartland Institute, 1987, Chapter II. This study references over a dozen analyses, withspecial attention to the relative tax burdens of Midwestern states. It concludes that the relatively poor economic performance of the Midwestern states can be explained partially by their relatively high tax burdens.
Two examples are the decision of Mazda to locate in Michigan, after being offered substantial government financial assistance, and the decision of Saturn to turn down huge financial incentives from Michigan and New York to locate in Tennessee, which offered little in the way of direct incentives.
US Department of Commerce, Bureau of the Census, State Governmental Finances, 1984-85; cited in The Imperative of Tax Reform, table 7.
Patrick L. Anderson, Michigan in the Current Recovery: A Historical Perspective, Chicago, IL: The Heartland Institute, 1986. This study presents the data, the theory, and the empirical confirmation that high personal state tax burdens result in lower state economic growth.
Patrick L. Anderson received his education at the University of Michigan in Ann Arbor, where he received a Bachelor's degree in Political Science and a Master's degree in Public Policy. His professional experience in economics includes work for the University of Michigan Economics Department, the Central Intelligence Agency, and Manufacturers National Bank of Detroit; and as a consultant to private industry, public officials and political candidates. He recently joined Alexander Hamilton Life Insurance Company, where he serves as Director of Economics.
In addition, Mr. Anderson has written extensively on topics of economic policy, with his articles appearing in the The Detroit News, The Wall Street Journal, and Crain's Detroit Business. His study Michigan in the Current Recovery: A Historical Perspective,published by the Heartland Institute in December 1986, analyzed many aspects of the State's business climate. He has been Vice-Chairman of the Michigan Consumers Council since 1985.
The Mackinac Center for Public Policy is a nonprofit research and educational institute that advances the principles of free markets and limited government. Through our research and education programs, we challenge government overreach and advocate for a free-market approach to public policy that frees people to realize their potential and dreams.
Please consider contributing to our work to advance a freer and more prosperous state.
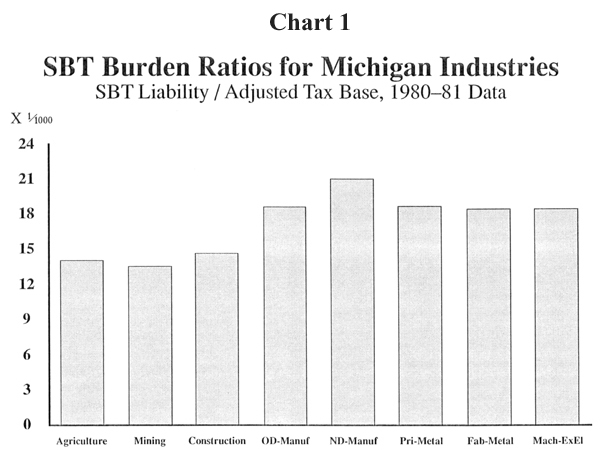
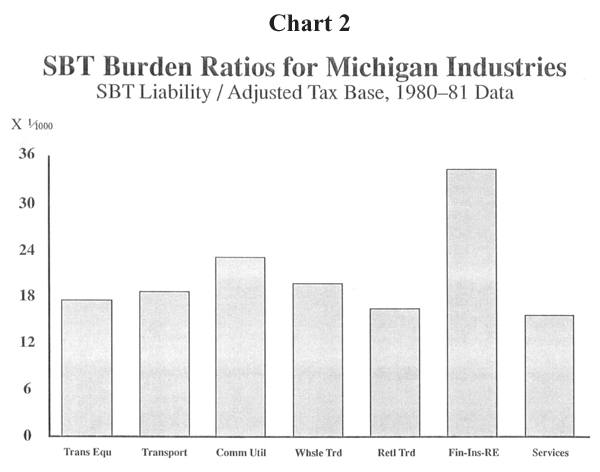