Introduction by David G. Sowerby
This study compiles recently released 1990 U.S. Census Bureau data to measure the economic and fiscal policy performance of Michigan's eleven largest cities. Using an index composed of poverty rates, population growth, job growth, and per capita income, the authors find that six cities grew during the 1980s while five declined. The per capita tax burden was found to be 65 percent higher in the declining cities than in the growing cities, a difference of more than $1,100 per year in taxes. Preface by prominent Michigan economist and Mackinac Center scholar David Sowerby. 19 pages.
This study compiles recently released 1990 U.S. Census Bureau data to measure the economic and fiscal policy performance of Michigan's eleven largest cities – those with populations of over 75,000. Using an index of economic performance from 1980 to 1990 – based upon poverty rates, population growth, job growth, and per capita income – we find that six of Michigan's largest cities experienced economic growth in the 1980s, and five suffered economic decline.
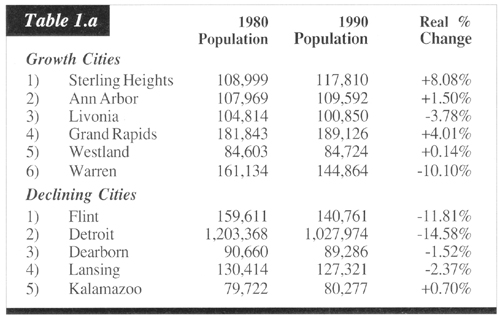
Michigan's growth and declining cities in rank order, with their 1980 and 1990 populations, were:
The major issue addressed in this study is why those five Michigan cities were in a state of urban decline in the 1980s. Quite clearly, the decline of the auto industry had a huge effect on the economic well-being of Michigan cities. The transition toward a service and technology-based economy also played a major role in Michigan's cities that have traditionally had a large manufacturing base. But we find in this study that a factor that has been overlooked in explaining the economic performance of Michigan's cities is their contrasting fiscal policies. There are surprisingly large differences between the taxing and spending policies of Michigan's growth cities and Michigan's declining cities. The most important differences include:
Tax revenues were $711 per person in the declining cities, versus just $434 in the growing cities. That is, tax burdens were 65 percent higher in the declining cities. For the typical family of four, this is a difference of just over $1,100 per year in taxes.
The reason that taxes were so much higher in Michigan's declining cities is that their expenditures were much higher. Even excluding outlays for welfare, health, and education, the declining cities had per capita municipal expenditures that were 75 percent higher than in the growth cities: $976 per person versus just $557 per person.
This close relationship between high taxes and spending and low economic growth is not just coincidence nor is it attributable to the performance of just one or two cities. In fact, every one of the five declining cities was also ranked in the top five in taxes and spending. Comparing the economic performance of the six low tax and spend Michigan cities with the performance of the five high tax and spend cities, we find:
Population declined in the high tax/spend cities by an average of 6 percent, versus no net population loss in the low tax/spend cities.
Job growth was more than twice as rapid in the low tax/spend cities: 13 percent versus 6 percent.
Poverty grew by 58 percent in the high tax/spend cities, versus only 21 percent in the low tax/spend cities.
Real per capita income fell by 5 percent in the high/tax spend cities, but rose by 9 per-cent in the low tax/spend cities.
Examining both Michigan and national data, this study shows that excessive levels of spending and taxes are a cause, not just a consequence, of urban economic decline in cities such as Detroit and Flint. Low growth cities in Michigan and other states have allowed their budgets to spiral out-of-control. This has created a vicious cycle of higher taxes leading to job and population loss. The shrinkage of the tax base then requires even higher tax rates just to raise the same amount of revenue, which leads to more population loss. The only way to unroll this snowball effect is for Detroit and other declining cities to aggressively weed out wasteful and unnecessary spending from their budgets and to examine a range of proven and successful cost-cutting strategies, such as contracting out services, reducing administrative costs, and freezing public sector salaries.
Too often in the last decade, Michigan's lackluster economic performance was attributed to the declining role of the U.S. motor vehicle industry.
Add in the accelerating transformation from manufacturing to services, and the cause of Michigan's below-average economic growth could too easily be blamed on external factors beyond our control. From unfair Japanese trade practices to low wage Sunbelt states, the smoking gun for Michigan's sluggish economic growth was identified beyond our state's borders.
To some degree, the same economic misfortunes that plagued Michigan's poorest performing cities in the 1980's could also be blamed on external forces. External forces alone, however, do not adequately explain subpar economic growth. State and local tax and spending policies also played major roles. Typically, a state or city whose tax burden and spending patterns exceed the national or state averages will experience below-average economic growth.
That premise is validated in this latest and important offering from the Mackinac Center for Public Policy. Stephen Moore and Dean Stansel, both nationally-respected economists, provide here the first definitive link between the economic performance of Michigan's largest cities and their local tax and spending policies. Their research reveals that among Michigan's eleven largest cities, the five that experienced economic decline in the 1980's had the highest tax burdens and the most excessive government spending growth rates. Conversely, the remaining six cities, which witnessed above-average economic growth, had lower tax burdens and exhibited greater spending restraint.
The role of taxes and spending and their impact on economic growth has been a major debate for the past decade. The issue was first concentrated at the national level, when in the late 1970s the stagnation of the U.S. economy could not entirely be blamed on higher oil prices. Rising tax rates, excessive government spending and greater government regulation were recognized as impediments to U.S. economic growth.
That recognition prompted deregulation in the twilight of the Carter Presidency and income tax reduction as a cornerstone of the Reagan Presidency. The impact on economic policy and, in turn, the economy, was decidedly favorable. Pro-growth fiscal policy, combined with the Federal Reserve Board's efforts to foster a low inflation environment, produced the nation's longest peacetime economic expansion, lasting nearly eight years.
In fact, the nearly 20 million jobs created during the 1980s were unmatched by any country, at any time in history.
Concurrently, some states and cities recognized that in order to prosper, lower taxes and less government spending were the proper prescriptions. For example, California and Massachusetts significantly reduced their property taxes in the late 1970's, and in response, their state's economies witnessed above average growth. While other factors, such as emerging technology and the Reagan defense buildup, assisted these two states, lower taxes unquestionably had a major positive impact.
In fact, several economic studies have documented the positive impact on state and local economies from low tax burdens. For example, a study by economist Robert Genetski, at the Harris Bank of Chicago, found that when a state's tax burden was 1 per-cent above the national average, income growth would be 0.6 percent below the average.
Noted economists Arthur Laffer and Victor Canto of Laffer-Canto and Associates observed that a state's municipal bond rating was inversely related to tax burden. States with declining tax burdens were more likely to witness a bond rating upgrade, an event that is crucial to minimizing long term financing costs of needed infrastructure spending. Conversely, states with rising tax rates were found to experience rating downgrades, thereby increasing their capital costs.
My former associate, David Littmann, Chief Economist at Comerica Bank and a fellow Mackinac Center Advisor, found that the states with the highest tax burden suffered the weakest population growth in the 1980s. Specifically, the top ten states in tax burden suffered the poorest population performance; consequently, in political terms they suffered a net loss of 24 electoral votes, thus losing political clout.
Not surprisingly, Michigan was one of the ten states with the highest tax burden and, as a result, lost 2 electoral votes from the 1980 to 1990 census. Consequently, if state and local policy makers do not recognize the negative effect that high taxes have on economic performance, they should surely recognize its negative impact on electoral vote counts, and thus, political clout. Michigan remains one of the largest states in electoral votes, but continued erosion in its population relative to competing states will lead to further loss in its political power.
The same cause and effect relationship of high taxes and excessive government spending producing below average economic growth also exists at the local level. In the state of Michigan, the City of Detroit evidences this relationship. Detroit has suffered tremendous economic decline. A study from the Washington, D.C.-based Cato Institute revealed that, among 76 of the largest American cities, Detroit experienced the poorest economic growth from 1965 to 1990, based on the combination of population, employment and income growth.
Detroit must contend with a total tax burden that is about seven times higher than the average Michigan city, village and township. The municipal income tax rates of 3 percent on residents, 2 percent on corporations and 1.5 percent on non-residents who work in the city; the 5 percent utility users excise tax; and the combined city, school and property tax rate of more than 90 mills represent obstacles to economic development and have contributed to eroding the tax base.
Detroit's effectiveness in lowering its income taxes would prove beneficial for both the city and the suburbs. A 1992 nationwide study by the Federal Reserve Bank of Philadelphia revealed that there is a direct correlation between city and suburban economic growth. The study found that a stagnating or declining city leads to slower growth for its surrounding suburbs. It concluded that cities can compete through "the elimination of large differences in local tax rates, especially taxes on mobile factors such as labor." Not surprisingly, Philadelphia, like Detroit, has one of the highest tax burdens and poorest economic performance track records in the country.
Happily, in Michigan and many of our state's cities, economic performance improved in 1993. For most of 1993, the state's unemployment rate has been below the U.S. jobless rate for the first time since 1978. In August, Michigan's unemployment rate was 6.5%, a full 3% below levels which prevailed only 18 months before. In fact, Michigan witnessed the sharpest drop in the jobless rate in that span of time when contrasted with that of all large industrial states. In addition, to satisfy those critics who claim that Michigan's lower unemployment rate is merely the result of no labor force growth, state job growth is expanding at more than twice the rate of the national average – 3.8 percent versus 1.5 percent.
By most measurements, Michigan's economy is growing faster than the United States'. In fact, by six business indicators, Michigan is outperforming the U.S.: retail sales growth, state stock price performance, labor market conditions, motor vehicle production and local purchasing managers' economic surveys are exceeding U.S. growth rates, and have been for more than a year.
Much of Michigan's improved performance is due to a favorable, cyclical rebound in the auto industry. For the first nine months of 1993, U.S. motor vehicle sales have risen 10 percent, roughly double the sales forecasts made at the beginning of the year by the auto companies. Domestic auto sales have fared even better, rising 12 percent this year. Correspondingly, the domestic auto companies' market share has increased nearly 2 percentage points, the industry's best turnaround in more than ten years.
However, for Michigan and its major municipalities to continue their above average economic growth, even in this improved cyclical economy, the tax climate and other structural forces must improve. State government deserves high marks for resisting the urge to raise taxes during the latest recession/fiscal crisis. As a result, Michigan's tax burden has modestly improved in relation to other large industrial states.
The Citizens Research Council of Michigan notes that Michigan's 1991 state and local tax receipts per $1,000 of personal income were approximately 4 percent higher than the average for the 10 largest industrial states, down from 1985 levels when it was 10 percent above the average. In contrast, California, which opted for an $8 billion tax hike to solve its fiscal crisis, now faces an unemployment rate of nearly 10 percent, with little improvement in its budget deficit. Who would have forecasted three years ago that Michigan's jobless rate would be more than 3 percentage points lower than the Golden State? A stronger than anticipated recovery for the domestic auto industry coupled with defense downsizing has played well for Michigan versus California, but contrasting tax and regulatory policies between the two states also had a significant impact.
While Michigan retains a higher than average tax burden, combined with an intrusive regulatory climate, it is encouraging, nevertheless, that the state's business climate has moved in the proper direction. Now, local governments should follow the same path.
A Prosperity Agenda for Michigan's Cities provides a detailed analysis of the impact local tax and spending policies have on the economic growth of Michigan's cities. More importantly, the study also outlines a prescription for all Michigan cities to prosper in the competitive 1990's.
David G. Sowerby
Chief Economist and Director of Fixed Income
Beacon Investment Company – Ann Arbor, Michigan
and Adjunct Scholar with the Mackinac Center for Public
Policy
October 1993
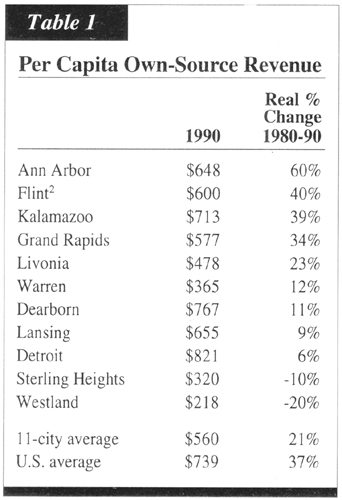
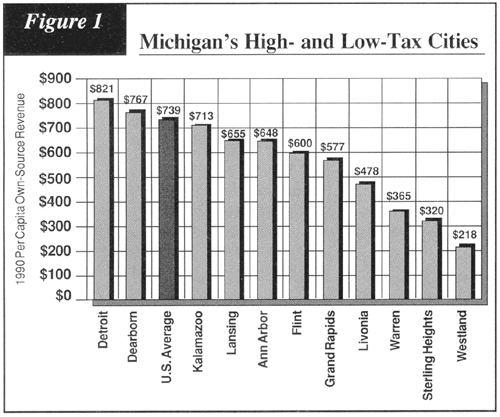
Table 1 indicates Michigan's cities were quite varied in their levels of tax revenues and the direction of change of those levels from 1980 to 1990.[1] Both Detroit and Dearborn had per capita tax burdens above the national average as shown in Figure 1.[2] Sterling Heights, Westland, and Warren, were each more than 30 percent below the U.S. average for city own-source revenue collections.
As important as the level of taxes is, the change in tax burdens in cities is even more so. Where is the per capita tax burden growing the fastest? Table 1 and Figure 2 show:
Ann Arbor led the way with a 60 percent increase in tax burden. But, its 1990 per capita revenue total was still below the U.S. average.
Flint's own-source revenue growth was also above the national average, at 40 percent; Kalamazoo was close behind at 39%.
On a more positive note, two of Michigan's largest cities – Westland and Sterling Heights – had a real decrease in per capita own-source revenues during the 1980s. These two cities also had the lowest 1990 levels of revenue.
Even Detroit managed to hold per capita revenue growth well below the national average at 6 percent, although its overall tax burden is still very high. In 1981, Detroit raised its income tax rate from 2 to 3 percent, yet in the 1980s the city experienced virtually no increase in real income tax collections.
Property taxes are one of the most politically volatile economic issues in Michigan. Governor Engler's decision to sign legislation in August 1993 abolishing property taxes for schools focused national attention on the sky-high rates in Michigan.
Table 2 shows the 1990 level of per capita city property tax revenues for Michigan cities. The data shows that property taxes were at least 25 percent above the U.S. city average in Dearborn, Ann Arbor, and Warren. In the case of Warren, the property tax is the only major tax imposed locally.
The state of Michigan spends about $6.5 billion per year on financial aid to its cities.[3] Where does the money go? Table 3 shows that:
Thanks to the state's generosity to Detroit and Flint, per capita inter-governmental revenue rose by 26 percent in Michigan's 11 largest cities.[4]
Total per capita intergovernmental revenue from the state government to Detroit and Flint rose by 55 and 105 percent during the 1980s. This gave them 1990 levels of $518 and $576 respectively, almost three times higher than the next largest recipient. In fact, these cities saw per capita increases in the 1980s that were larger than what any of the other nine cities received in 1990 alone. Meanwhile, five cities – Grand Rapids, Dearborn, Warren, Kalamazoo, and Livonia – saw real cuts in per capita state aid.
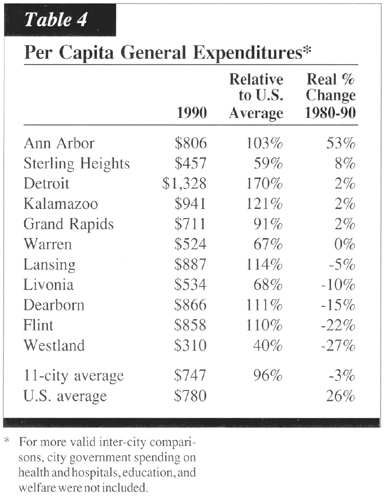
Michigan cities did a good job of holding the line on spending during the 1980s. As Table 4 shows, per capita general expenditures were cut by 3 percent in real terms in Michigan's 11 largest cities during the 1980s.[5] The national average rose by 26 percent. Only Ann Arbor raised per capita spending faster than the national average, at 53 percent.
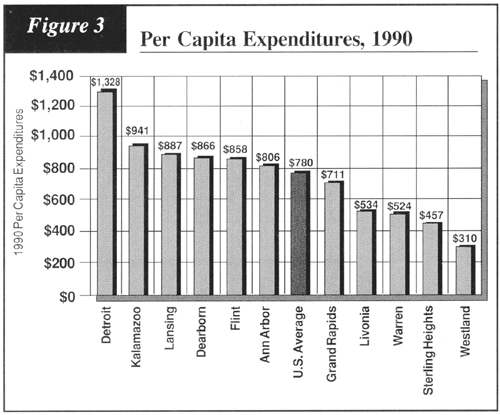
However, Figure 3 reveals that this overall strong city performance in Michigan camouflages the fact that 6 of the 11 Michigan cities still had expenditures above the U.S. average. Five – Detroit, Kalamazoo, Lansing, Dearborn, and Flint – were more than 10 percent above the U.S. average.
Though the 11-city average fell, only five cities actually cut per capita spending – Westland, Flint, Dearborn, Livonia, and Lansing.
Despite only a modest 2 percent real per capita increase, Detroit's spending was still almost double the national average. In 1990, the city spent nearly $400 more per resident than the next biggest spending city in Michigan, Kalamazoo.
One core service of city governments is keeping the streets and neighborhoods safe through police protection. Table 5 shows how per capita spending on police protection in Michigan's largest cities changed during the 1980s.[6]
The average U.S. city increased spending on police protection from $92 per resident in 1980 to $119 per resident in 1990, in real terms. The corresponding numbers for Michigan's large cities were $117 and $142.
Only two of Michigan's cities increased spending on police protection faster than the rest of the nation. Ann Arbor hiked such spending 37 percent. Kalamazoo did so by 113 percent. Kalamazoo's per capita increase of $126 from 1980 to 1990 is more than the average U.S. city and all but four of Michigan's largest cities spent on police protection in 1990.
Two cities – Flint and Grand Rapids – actually reduced real per capita police spending, and two others – Warren and Lansing – saw growth that was a fraction of the national average.
One area of government activity in which Michigan cities do consistently spend above the U.S. average is government administration and bureaucracy. Table 6 shows 1990 per capita spending on city government administration in Michigan.[7]
Michigan cities had administration expenditures well above the U.S. average. In 1990 only two of Michigan's 11 largest cities – Westland and Warren – had per capita levels of administration spending below the national average.
Finally, Table 7 examines levels of city borrowing. Specifically, it shows the per capita amount of debt outstanding, which includes all debt obligations remaining unpaid on the date specified.[8]
In 1980, Michigan's large cities had levels of per capita debt only two-thirds as high as the national average. By 1990 that had changed little. The largest cities in Michigan saw their per capita debt increase by 39 percent compared to the national average of 44 percent.
However, the average distorts the true picture. Four cities – Sterling Heights, Grand Rapids, Lansing, and Kalamazoo – increased per capita debt by more than 75 percent. Meanwhile, four other cities – Warren, Dearborn, Westland, and Livonia – cut per capita debt by over 30 percent.
Five cities – Kalamazoo, Detroit, Grand Rapids, Lansing, and Flint – had 1990 per capita debt levels of over $1,000, while four others – Warren, Westland, Sterling Heights, and Dearborn – had levels near or below $200.
Few would argue that taxes and spending have no effect on a city's economy. The question is: how important are taxes and spending in explaining city economic performance? One way to examine this question is to com-pare the relative levels of taxing and spending in cities with booming economies against those levels in cities with declining economies.
In a 1992 study for the Cato Institute, we devised an index for assessing the economic well-being of the largest U.S. cities.[9] We then correlated this index to taxing and spending behavior in these cities. We found that high taxes and spending affect economic growth of cities in a significantly negative fashion. For example, we found that for every $1.00 of per capita expenditures (excluding dollars spent on anti-poverty programs, education, and health care) in the highest growth cities, the shrinking cities spend $1.71. As a result, in 1990 a typical family of four living in one of the shrinking cities paid $1,100 per year more in taxes than it would have had it lived in one of the highest growth cities. We now address the question of whether this inverse relationship between taxes and spending and economic growth is also observable in Michigan cities.
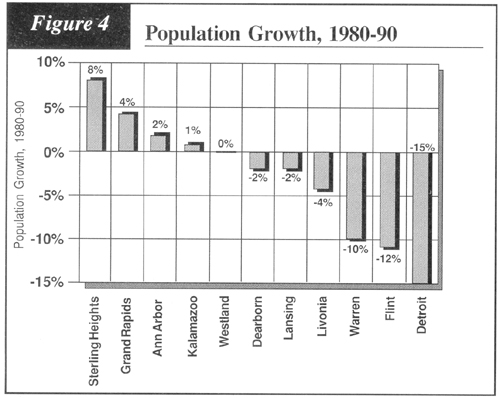
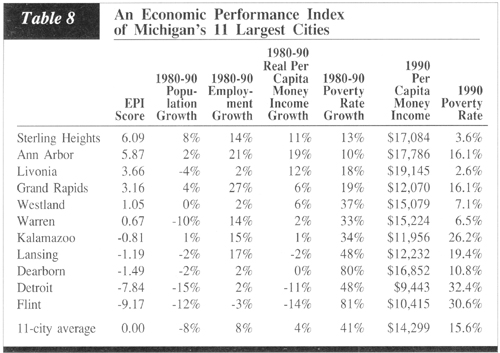
To assess the economic performance of Michigan's 11 largest cities we examined the same six measures of economic health that we used in our above-mentioned national study. The measures used are 1980-90 changes in population, employment, per capita money income, and poverty rate; and the 1990 levels of per capita money income and the poverty rate. These figures were used to calculate an economic performance index which is shown in Table 8.[10] Figures 4-9 show the performance of the 11 Michigan cities on each economic measure.
The economic performance index for the period 1980-1990 shows that six cities experienced economic growth and five experienced economic decline. We therefore divide the cities into two groups: growth cities and declining cities. The five cities with negative scores on the economic performance index are: Flint, Detroit, Dearborn, Lansing, and Kalamazoo. The six growth cities are: Sterling Heights, Ann Arbor, Livonia, Grand Rapids, Westland, and Warren. Table 9 ranks the cities by their economic performance index score and shows how 1990 taxes and spending differed in the high-growth and low-growth groups.
The declining cities collected roughly 65 percent more revenue per resident from their citizens in 1990 than did the growth cities. See Figure 10.
The five declining cities spent $420 more per resident in 1990 than did the growth cities. See Figure 11.
The five declining cities also were the five highest spending and five of the six highest tax cities.
Table 9 also presents a measure of "tax effort" for the 11 Michigan cities.[11] The tax effort index compares the tax rates, rather than revenues, for cities. A tax effort of 1.00 is the average tax effort for cities in Michigan. Hence, a tax effort of 2.0 would mean that the city has twice the tax burden of the average city. The tax effort data further confirm the conclusion that taxes are very high in Michigan's declining cities. Of the five declining cities, only Dearborn's tax effort is even close to the state-wide average. Tax rates are more than 50 percent above the Michigan average in Flint, Kalamazoo, and Lansing. Incredibly, Detroit's tax effort is a six times above the average. Herein lies a major source of economic decline.
As Table 10 indicates, taxes and spending were significant-ly higher in the declining cities for every one of the six individual economic growth measures examined. For example:
The cities with the fastest growth in poverty collected general tax revenues of $711 per resident. The slow poverty growth cities took in one-third less.
The six cities with the highest 1990 poverty rates spent $922 per person in 1990, while the more affluent cities spent only $538. As noted at the outset, these spending figures do not include spending on health, education, or welfare, so it cannot be argued that these spending differences are being caused by large amounts of anti-poverty spending.
A family of four in the six cities that lost population in the 1980s would have seen roughly $2,500 of its income sent off to city hall, while such a family in the growing cities would have given up less than $2,000. In other words, the family could save more than $500 a year by living in one of Michigan's growth cities rather than one of its declining cities.
In sum, Michigan cities with booming economies tend to have much lower levels of taxes and spending than those in decline. This is similar to the national pattern with cities. Few would argue that the quality of municipal services in the declining cities of Michigan is twice as high as in the prosperous cities. Most would say just the opposite – that services are better in the low-cost cities.
The critical policy question is this: are the higher levels of taxing and spending in the declining cities contributing to that decline or are they a consequence of that decline? Most urban theorists say that it is the latter. The traditional argument is that low-growth cities spend more than high-growth cities because their needs are greater. They claim that such cities must spend more for anti-poverty programs, homeless assistance, drug rehabilitation, crime control, and job training, among other things. Since declining cities have less wealth and fewer workers and businesses to pay the costs of those programs, those cities have to impose higher tax burdens on their residents and businesses just to raise the same amount of revenue as high-growth cities do. In sum, higher spending and taxes in low-growth cities are alleged to be purely symptomatic of urban decline.
This study and others cast some doubt on that claim.[12] We believe that conventional wisdom does not tell the whole story. We contend that the evidence shows that high taxes and spending are both cause and consequence of urban decline. Remember, city public welfare spending is not included in the spending figures in this study, so they cannot be driving low-growth cities' expenditures upwards. Furthermore, if urban decline necessitates higher city spending, is it not unrealistic to expect that higher spending to bring about more acceptable conditions? In other words, if more spending is the cure, why do the big spending cities continue their spiraling decline?
One way to test whether higher taxes and spending are a cure or a cause of urban decline is to look at the levels of taxes and spending in the high-growth and low-growth cities at the beginning of the period of analysis, 1980. Table 11 does just that, using the economic performance index score described earlier.
The five cities with the worst economic performance in the 1980s – Kalamazoo, Lansing, Dearborn, Detroit, and Flint – had per capita levels of own-source revenues (in 1990 dollars) of $745 in 1980. The six high-growth cities took in only half that much, $363 per resident.
Per capita spending in the declining cities in 1980 was also twice as high as in the booming cities, at $1,057 vs. $532.
Looking at the various measures of economic growth individually shows the same correlation between high spending and urban decline. As Table 12 indicates, for every economic variable used, the spending and taxes at the beginning of the period were higher in the cities that subsequently declined than in those that grew.
In the cities that subsequently had population growth in the 1980s, average per capita city tax revenue in 1980 was $395 (in 1990 dollars). In the cities that lost population the 1980 level was more than 50 percent higher at $654.
The six cities with 1990 per capita money income greater than $15,000 spent $585 per resident in 1980, while the poorer cities spent nearly twice that much at $993.
The four cities with the biggest increases in poverty rates – over 45 percent – took in $802 in own-source general revenue per capita in 1980. The cities with slower poverty growth brought in less than half that at $384.
If big spending were the cure for urban decline, Michigan cities such as Detroit and Flint would be thriving. Instead they continue to tax and spend at levels well above those of other more prosperous cities in Michigan, and sadly they continue to experience the pain of economic stagnation.
While we can confidently assert that high levels of taxes and spending have yet to prove to be the cure for urban de-cline, it is not as clear whether or not they are a cause of the decline. One way to approach this question is to rank the cities by 1980 levels of taxes and spending and see how the high spending and low spending cities compare.
As Table 13 shows, the five cities with the highest 1980 levels of per capita spending and own-source revenues were the very same five cities that had negative scores on the economic performance index. Table 14 shows how these two groups of cities compared on the various measures of economic performance.
The five high-tax cities saw their populations drop by 6 percent, while those with lower taxes had no population loss.
The low-spending cities had an employment increase of 13 percent. The high-spending cities saw an increase that was less than half that size. See Figure 12.
Per capita money income went down by 5 percent in real terms in the high-tax cities, but it rose by 9 percent in the low-tax cities. See Figure 13.
The cities that spent the most in 1980 saw their poverty rates rise by 58 percent during the 1980s, while poverty in the cities with lower spending went up by only 21 percent.
In 1990, per capita money income in 1980's high-tax cities was roughly $12,000. In the low-tax cities it was over $16,000.
In the cities that spent the most in 1980, roughly one out of every four residents were below the poverty line in 1990. In the low-spending cities it was less than one in 10.
The data shows convincingly that cities in Michigan, like cities elsewhere, cannot tax and spend their way to prosperity. In fact, it is those cities that have high tax burdens and excessive spending that are experiencing the worst economic despair.
If taxing and spending are not the keys to economic prosperity, what are Michigan's city leaders to do?
Reviving Michigan's depressed cities will require implementation of a growth-oriented agenda on the part of the state government, mayors, and city councils. The primary goal of such a strategy must be to provide incentives for people, businesses, and capital to return to the five cities identified in this study as "in decline."
The central argument of this study is that the key to restoring economic vitality and capital investment to Michigan's declining cities is to reduce the costs of providing municipal services and then slash the heavy tax burdens that are required to pay for them. That can be done. For no justifiable reason, unit service costs are substantially higher in large cities than in small cities – whether the service is education, bus service, street cleaning, park maintenance, garbage collection, or police protection.
Labor costs appear to explain much of the inefficiency. Our earlier national study found that salaries of government workers in suburbs average $2,150 a month compared to $2,700 a month in cities with populations over 500,000.[13] If benefits were added to the calculations, the disparities would be much wider. Large cities also pay their employees substantially more than comparably skilled private-sector workers receive, and the disparities are growing larger.[14]
Those considerations suggest that if Michigan's cities had the political will to cut ser-vice costs and taxes, they could do so without sacrificing vital services. One way to begin is to competitively contract for services. Smaller cities routinely contract out municipal services; large unionized cities seldom do. Indeed, some cities, such as La Mirada, California, contract out almost all their services and thus have tiny city bureaucracies. One Michigan city, Ecorse, erased a deficit via privatization.[15] Several dozen studies verify that by contracting out to the private sector, unit costs are reduced by at least 20 per-cent and sometimes as much as 50 percent.[16] Moreover, the quality of contracted-out services is rated higher than that of services offered in-house.[17]
Nevertheless, public employee unions are so powerful in large cities such as Detroit that not only is contracting out effectively prohibited, but private-sector competition with the government monopoly service provider is forbidden or greatly hindered by regulation. That action is contrary to the interests of residents and area workers. City provisions that inhibit private competition with the government should be ended.
There are diseconomies of scale in municipal services. Some cities, such as Detroit or New York, have such powerful special-interest lobbies and such entrenched bureaucracies that it has become politically impossible to cut service costs, even in times of severe crisis.[18]
If the provision of services and the levying of taxes were privatized or at least closer to home-owners and businesses, taxpayers would have greater influence on decisions about which services they need and which they do not. They could also place greater pressure on the government to reduce costs by diluting the influence of special-interest groups. While some urban advocates – including HUD Secretary Henry Cisneros – think that centralized, regional governance is the solution to the problems of the inner cities, the answer is just the opposite, decentralized governments that are closer to the people.
Michigan's cities can lure businesses and people back by changing the composition of taxes. Ours and other studies show that city income taxes, business taxes, and property taxes have a devastating effect on economic growth.[19] If Michigan's cities partially or substantially replaced their business and property taxes with sales taxes and user fees, they could dramatically improve the business climate within the state's borders. Business taxes are defended by local officials as "fair" because they fall primarily on upper income individuals and big corporations. In practice, those taxes are paid by the working poor who are left behind in Michigan's declining cities.
The wounds of Detroit and other declining Michigan cities are largely self-inflicted. Unless and until Michigan's central cities start putting people first, by cutting service costs and anti-growth tax rates, no amount of federal or state aid can save them. City halts have the capacity to make the growth-oriented fiscal changes that are necessary to reverse decline. The question is: Do the political leaders in Detroit and elsewhere have the political willpower to implement these changes?
Unless otherwise indicated, all the city government finance figures contained herein are in constant 1990 dollars, refer to per capita levels, and are from the 1979-80 and 1989-90 editions of the U.S. Census Bureau's annual publication, City Government Finances. (year). At the time of publication, the 1989-90 edition was the most recent.
Note that of the 11 cities examined, hospital finances are handled by city government only in Flint. Hospital spending in the other ten cities is handled by county government. Therefore, we have excluded Flint's hospital revenues (an estimated $1,000 per capita) from their per capita own-source revenue figure.
See State Government Finances: 1991, U.S. Census Bureau, Table 13.
"Intergovernmental revenue from the state government" includes amounts originally from the federal government that were channeled through state governments. See City Government Finances: 1989-90, U.S. Census Bureau, for a more complete description.
Since spending on health and hospitals, education, and welfare is done by a wide variety of combinations of levels of government, it is customary to exclude such spending by city governments when making inter-city comparisons. Unless otherwise noted, all spending figures herein will refer to general expenditures minus spending on health and hospitals, education, and welfare.
See City Government Finances: 1989-90, U.S. Census Bureau, for a strict definition of "police protection" spending.
See City Government Finances: 1989-90, U.S. Census Bureau, for a strict definition of "government administration" spending.
See City Government Finances. 1989-90, U.S. Census Bureau, for a more detailed description. j
Stephen Moore and Dean Stansel, "The Myth of America's Underfunded Cities," Cato Institute Policy Analysis No. 188, February 1993.
This was done by finding for each city the sum of the standardized values of each of the economic growth measures. The standardized value for each city's performance on each growth measure is the number of standard deviations that the observed value of the particular variable is above or below the 11-city mean for that variable. A list of the sources for each variable is provided in the appendix.
Refers to the "relative tax effort rate" as reported in the Michigan Tax Commission's Assessing Officer's Report of Property Taxes Levied. The relative effort rate equals the local effort rate divided by the state average local effort rate. The local effort rate is the total taxes collected divided by the state equalized value.
See especially Moore and Stansel, "The Myth of America's Underfunded Cities,"
Ibid.
Cox and Brunelli, "America's Protected Class," American Legislative Exchange Council, Washington, D.C., 1991.
See Mackinac Center for Public Policy, Michigan Privatization Report, January 1993.
Some of those studies are listed in Stephen Moore, "How to Privatize Federal Services by Contracting Out," Heritage Foundation Backgrounder No. 494, March 13, 1986.
Stephen Moore, "Does Privatization Really Harm Public Employees?" Partnership Focus, June 1990, pp. 18-22.
Sam Staley, "Bigger Is Not Better: The Virtues of Decentralized Local Government." Cato Institute Policy Analysis No. 166, January 21, 1992.
For a list of such studies, see Moore and Stansel, "The Myth of America's Under-funded Cities."
Data Sources
Revenue and Expenditures
U.S. Census Bureau, City Government Finances: (year),
1979-80 and 1989-90 editions.
Population
U.S. Census Bureau
Employment
1992 City and County Extra, (Lanham, MD: Bernan Press).
Per Capita Money Income and Poverty Rate, 1990.
U.S. Census Bureau, 1990 Census of Population and Housing-Summary
Social, Economic, and Housing Characteristics, 1990 CPH-5.
Per Capita Money Income and Poverty Rate, 1980
U.S. Census Bureau, County and City Data Book, 1988.
Stephen Moore, Director of Fiscal Policy Studies at the Cato Institute in Washington, D.C., is on leave to the minority staff of the Joint Economic Committee of Congress.
Dean Stansel is a fiscal policy researcher at the Cato Institute. Together with Stephen Moore, he has coauthored a recent Cato study of the nation's cities.
All data contained within the Tables and Figures of this study was obtained through research conducted by the authors in conjunction with work done with the Cato Institute.
The authors wish to express appreciation to Lawrence W. Reed of the Mackinac Center for Public Policy and Timothy G. Nash of Northwood University for their editing of this work and Karen Gerhardt of the Mackinac Center for her graphic design and layout.