This study objectively measures economic freedom both nationally and from a local level in Michigan. It demonstrates correlations between greater freedom and economic well-being. It overwhelmingly and repeatedly finds positive connections between economic liberty and outcomes that many policymakers profess to want, such as low unemployment rates and population growth.
There has been long running debate around the world about the causes and consequences of economic growth. This study objectively measures economic freedom both nationally and from a local level in Michigan, and it demonstrates correlations between greater freedom and economic well-being. It overwhelmingly and repeatedly finds positive connections between economic liberty and outcomes that many policymakers profess to want, such as low unemployment rates and population growth.
This study uses an economic freedom index for the 383 U.S. Metropolitan Statistical Areas, using data through 2017 across three major components of government policy: spending, taxes and labor market regulation. That index, originally published by the Reason Foundation, is modeled after similar ones created for nations and states. Previous research has found those same positive correlations between liberty and economic well-being at the national and state levels.
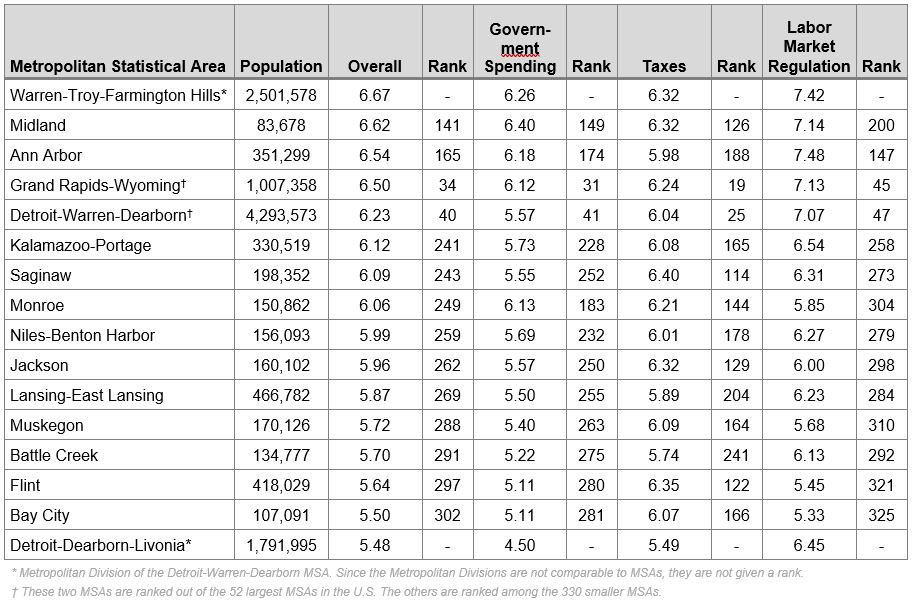
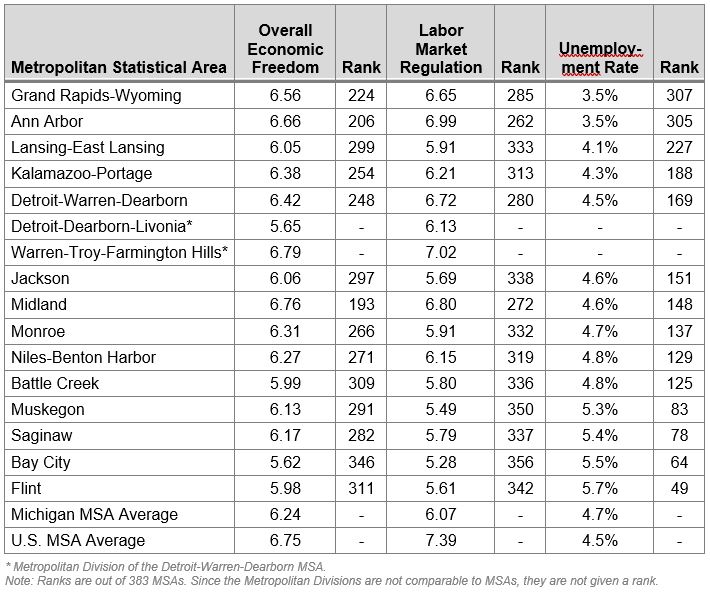
The results demonstrate that Michigan MSAs generally underperform the nation in their overall economic freedom scores and in their performance on measures of well-being. Only the Midland MSA received an overall economic freedom score higher than the national average, and only by a small amount. That placed Midland 193rd of 383 MSAs in the country. The table directly below reports each Michigan MSA’s overall economic freedom score as well as where it ranks nationally, and in each of the three major policy areas.
Graphic 1: Economic Freedom Scores in Michigan MSAs, 2017
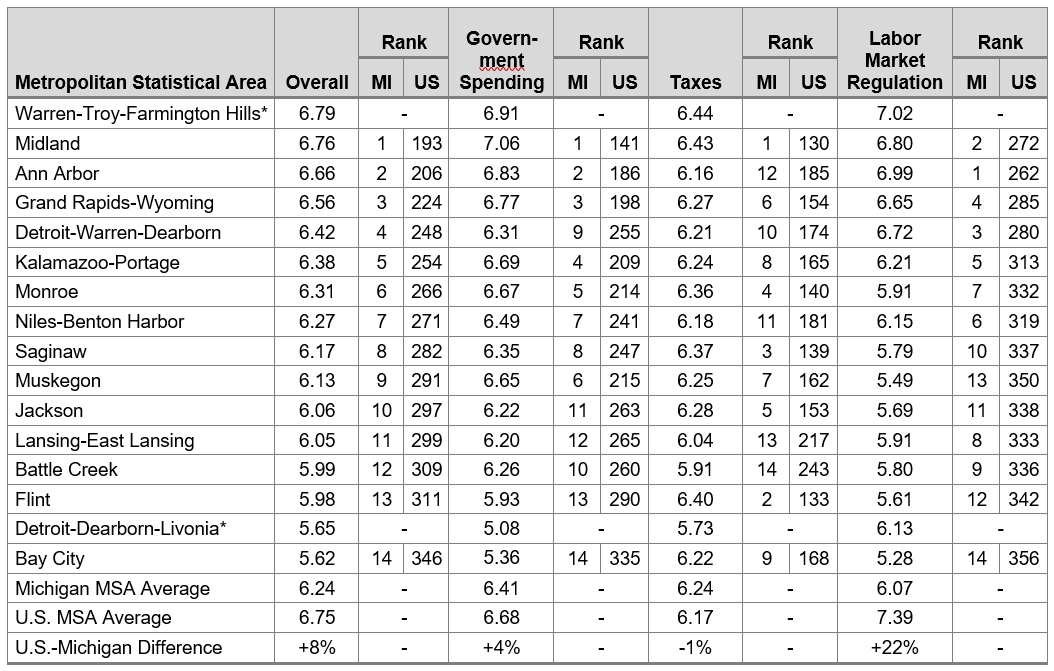
* Metropolitan Division of the Detroit-Warren-Dearborn MSA.
Note: Ranks are out of 383 MSAs. Since the Metropolitan Divisions are not comparable to MSAs, they are not given a rank.
We also find, nationwide, that MSAs with the worst labor market regulation scores have unemployment rates that are one-third higher than those with the best scores. Only four of Michigan’s 14 MSAs had unemployment rates lower than the average MSA across the country in 2017. In addition, our analysis discovered that MSAs with the largest government bureaucracies had 40% higher unemployment rates than those with the smallest ones.
The findings for employment growth were particularly strong. Nationwide, MSAs in the least-free quartile had employment growth from 2017 through 2019 of just 1.32%. In the most-free quartile, it was 3.54%, or more than 2.5 times higher.
These are just three examples of our findings. We examine the economic freedom scores in MSAs nationwide and for 14 metro areas in Michigan and compare these to data of unemployment rates and employment and population growth. We focus specifically on labor market regulations, such as minimum wage burdens and bureaucracy size. The findings suggest that MSAs with greater levels of economic freedom tend to perform better in economic terms compared to those with less economic freedom.
It is important to note that correlation is not causation, and that there are other variables across nations, states, provinces and local units of government that impact these economic outcomes. Policymakers should, however, understand that many academic scholars have looked at questions surrounding economic liberty and associated outcomes, while controlling for many other variables, and they overwhelmingly find positive outcomes. Our findings are consistent with that previous work. This study contains a robust review of that literature.
Given the overwhelming evidence that economic freedom is good for employment growth, the unemployment rate and population growth, lawmakers would be wise to approach policy through a freedom lens. Would a particular policy increase the tax burden on Michigan citizens or impose job-killing labor regulations? If so, it should be reconsidered. Lawmakers could likewise do much good by adopting policies more conducive to free and voluntary association, ones that give individuals more economic agency, opportunity and very likely, prosperity.
Since opening its doors in the late 1980s, the Mackinac Center for Public Policy has worked to advance liberty and opportunity for people in Michigan and elsewhere. Committed to the human flourishing that results when people are permitted wide latitude to associate voluntarily and peacefully for personal gain, Mackinac Center scholars have studied broad questions related to economic and labor policies. After all, research shows that Americans spend about one-third of their lives at work. Their experience is shaped by many federal, state and local regulations, as well as private work rules that affect their economic opportunities and well-being.
The debate over how to achieve economic growth and development is centuries old. The father of modern economics, Adam Smith, made the most significant contribution to this debate with his 1776 book “An Inquiry Into the Nature and Causes of the Wealth of Nations.” The ideas and examples from his book are relevant even today.
Scholarly research into the causes of economic growth and its consequences is much more sophisticated today. It continues to demonstrate, though, how markets and private solutions are usually preferable to mandates from politicians and other government officials. The findings of this research also explain why the Mackinac Center has donated time and treasure to research and educational efforts into economic growth: By doing so, we enhance the quality of life in Michigan.
This paper represents an updated look at the old question of the relationship between economic liberty and well-being, using the perspective of local markets. It draws on work that previous scholars have done to examine economic liberty by country and by subnational units of government across Canada, Mexico and the United States. This study examines levels of economic freedom in metropolitan areas in the U.S. and Michigan — specifically, labor market freedom.
There are a number of reasons the Mackinac Center chose to zero in on labor market freedom and its related impacts. The first is Michigan’s labor history. For better or worse, organized labor heavily influenced Michigan economically for many decades, impacting everything from worker salaries to the price of manufactured products, and ultimately, the larger economy. Even today, the international headquarters of the UAW calls Michigan home.[1]
In addition, there have been recent changes to public policies involving labor relations in the Great Lake State. The biggest and most obvious include the adoption of a right-to-work law.
This law prohibits forcing workers to join or financially support a union at their place of employment. There are now 28 states with right-to-work protections.[2] Michigan became a right-to-work state in 2013. Union membership rates have fallen since workers were given a choice of joining a union, from 17.5% of the state workforce in 2012 to 15.2% in 2020.[3] Since 2012, Michigan’s union membership decline has been far steeper than that found in the rest of the nation.[4] This fall happened despite a growing economy in most of these years.
Another important policy change impacting Michigan’s labor markets is the repeal of Michigan’s prevailing wage law. Prevailing wage mandates union-scale wages be paid on publicly funded projects — wages which are often higher than those determined by markets.
Lastly, labor market freedom appears to exhibit a strong influence on economic well-being in the academic literature, driving the results of many studies involving economic freedom (or a lack thereof). More will be said about this topic in the section below titled “Literature Review.”
The links between economic liberty and human well-being are more than simple observations made by champions of a cause. They are supported by decades of modern scholarship both here and abroad. What follows is a description of that evidence, on whom we based our own methodology. We begin with a short history of scholars’ attempts to measure economic freedom around the globe and its consequences, followed by similar research performed for North America and its states and provinces, as well as a previous attempt to measure economic liberty in local areas of the United States. This is followed by a rich review of existing academic literature on economic liberty and various associated outcomes. We then provide a deep statistical analysis of the relationship between economic freedom and unemployment rates, employment growth and population growth for U.S. Metropolitan Statistical Areas, with particular focus on the 14 MSAs in Michigan.
The Fraser Institute of Canada published “Economic Freedom of the World, 1975-1995” in 1996 and ranked nations by economic liberty. The study — endorsed by legendary economist Milton Friedman — collected data on 103 nations[5] and included factors such as taxation, regulation, money supply and trade.[6] Each nation received one of six letter grades (A through F-), and the report compared those nations’ economic performances with each other.
The findings were stark. Those nations with the best grades on economic liberty had an average per-capita gross domestic product nearly 10 times that of the nations with the worst grades ($15,834 and $1,650, respectively).[*] Gross domestic product is a measure for the value of finished goods and services produced within the borders of a country. This yawning economic gap between the least free and most free nations appeared in every subsequent update to the report.
Because the Fraser Institute has made its datasets public, other scholars have used them in their own research. These scholars have frequently found economic liberty to be associated positively with overall prosperity, longer life expectancy and greater political freedoms.[7] The Economic Freedom of the World and its derivatives have been cited more than 900 times.[†]
[*] The United States ranked fourth freest in the 1996 edition. Its ranking changed in subsequent editions, and it now stands at sixth, behind Hong Kong, Singapore, New Zealand, Switzerland and Australia. James Gwartney et al., “Economic Freedom of the World” (Fraser Institute, 2020), 9, https://perma.cc
[†] As of Sept. 27, 2021, based on a review of a variety of bibliographical sources.
The Fraser Institute published another report, “Economic Freedom of Canada,” in 1999 before taking on the whole of North America with its “Economic Freedom of North America” report in 2002. After initially being updated every other year, the report has been updated annually since 2010. Dean Stansel, co-author of this report, has been the primary author of the last eight editions. The Fraser report includes an index score and ranking of all Canadian provinces, as well as U.S. and Mexican states.
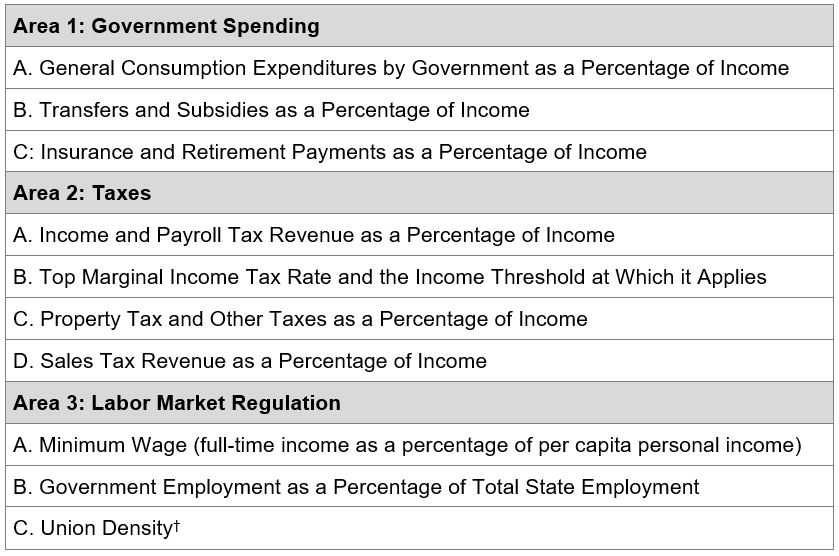
The estimates are driven by data for each variable shown in Graphic 2. There are three main areas, each with subcomponents. The variables are standardized, so that the raw data is converted to a 0-10 scale. The most-free observation for each variable is given a value of 10, the least-free a zero. Those in between are given a score proportionate to their distance from the maximum and minimum, with lower numbers representing policies that are less free and higher numbers, more free. Each major policy area — spending, taxes and labor market freedom — is weighted equally when calculating the overall, average score.[*]
Graphic 2: Areas and Components of the Economic Freedom of North America Index
Michigan’s overall score is 5.93 out of 10 in the latest edition from 2021, which ranks it the 34th freest state in the nation.[‡] This represents a decline from 31st in the previous year’s report, but it is an improvement from its 45th rank in 2010.[8] The highest score in the U.S.-specific index, 7.83, was earned by the Live Free or Die State of New Hampshire. The lowest was earned by New York at 4.33. The most recent EFNA report uses data through 2019.
One of the factors contributing to Michigan’s relatively poor performance overall is where it ranks among the states for labor freedom. Labor Market Freedom is one of the three major areas of analysis. Michigan’s composite score in that area was 5.19, which ranked just 40th among the 50 states. Michigan’s Labor Market Freedom score has improved over time but peaked in 2015 at 5.34.[9]
[*] For a more detailed explanation of the methodology used in this study, see: Dean Stansel, “U.S. Metropolitan Area Economic Freedom Index” (Reason Foundation, 2020), 14–18, https://perma.cc
[†] This represents private union members as a percentage of total employment.
[‡] Most other states in the Midwest also received middling scores in the index. Indiana was an exception. Dean Stansel, Torra Jose and Fred McMahon, “Economic Freedom of North America 2021” (Fraser Institute, 2021), 7, https://perma.cc
Building upon the global and subnational measures of economic freedom, Stansel developed an index of economic freedom for MSAs, borrowing the methodology of the EFNA. It is based on publicly available data and assesses their government spending, taxes and labor market freedom. The key difference between the components in the Economic Freedom of North America Index and the U.S. Metro Area Economic Freedom Index concerns taxation. This MSA study drops the income tax rate variable that appears in EFNA, because local income taxes only exist in a small number of states, and there is no unified source for such rates at the local level.
There were 383 MSAs in the United States in 2017 and 14 were in Michigan.[10] The MSA concept was established by the federal government in 1949 to identify local labor markets so federal agencies could record and report statistical information. To be considered an MSA, an area has to have at least one “central city” with at least 50,000 people. In many cases there are several cities in the MSA that exceed that size. In all cases, the MSA includes the central city (or cities) and the surrounding suburban areas from which a substantial amount of commuting occurs.[11]
In his 2019 report for the Reason Foundation, “U.S. Metropolitan Area Economic Freedom Index,” Stansel ranked metropolitan statistical areas by degrees of economic freedom, using the same basic methodology as the ENFA report. Stansel observed that among the 52 MSAs with a population over one million, Houston-The Woodlands-Sugar Land, Texas, had the highest freedom score, followed by two Florida MSAs: Jacksonville and Tampa-St. Petersburg-Clearwater. The lowest freedom score among large metropolitan areas went to Riverside-San Bernardino-Ontario, California. Performing only slightly better were the Rochester and Buffalo Cheektowaga-Niagara Falls areas, both in New York state.[12] The dataset for the 2019 study contains scores from nine specific years across five decades (every five years from 1972 to 2012).[*] The dataset for this MSA analysis contains one more year of data: 2017.
Neither Grand Rapids nor Detroit — the Michigan’s two large MSAs — appeared in the top or bottom 10 of the 52 largest MSAs in the country in terms of economic freedom. The same is true for the other 12 Michigan MSAs ranked among the 330 smaller ones examined in Stansel’s 2019 study. Of those 330 smaller MSAs, Naples-Immokalee-Marco Island, Florida, took top honors with a score of 8.55 out of 10.[13] This was followed by Midland, Texas, and Sebastian-Vero Beach, Florida. On the opposite end of the spectrum, El Centro, California, was ranked last with a score of 4.22, followed by Kingston, New York, and Visalia-Porterville, California, both with a 4.39 score.[14]
Graphic 3 shows the scores and ranks for the 14 MSAs and two “metropolitan divisions” in Michigan, using data through 2012. Eleven of the larger MSAs in the U.S., including Detroit, are broken into multiple metropolitan divisions. Because they are fundamentally different from the MSAs, they are not included in the rankings. However, they are given scores to facilitate comparisons within those 11 larger MSAs. The most-free MSA in Michigan was Midland with a score of 6.62, ranking it 141 out of the 330 smaller MSAs, followed by Ann Arbor at 6.54 and 165th. Bay City was the least-free at 5.50 and 302nd, followed by Flint at 5.64 and 297th.
In the section titled “Analysis and Findings,” we report the most and least free MSAs around the nation and in Michigan, using data through 2017. The graphic below are rankings using Stansel’s 2012 data set.
Graphic 3: Economic Freedom Scores and Ranks for Michigan MSAs, 2012
An analysis that compares nations, subnational governments, or localities to each other is important for several reasons. As Stansel noted previously, “Freedom can vary quite widely within the same country and even the same state.”[15] By identifying a relative position among regions, elected officials and other policymakers can review policies that may lead to a gain or fall in their polity’s economic freedom score. More than an intellectual curiosity, that position appears to have real world consequences.
For instance, the Economic Freedom of the World and Economic Freedom of North America reports find a wide gap between the per-capita personal income of people who live in countries and states with low economic freedom scores and those living in the areas with the highest scores. The same goes for Stansel’s original MSA analysis, and this study, as well. He found that through 2012, per-capita personal income in U.S. MSAs in the least-free quartile were 4.9% below the national average. By contrast, income in the most-free MSAs was 5.7% above average.[16] This current MSA study also finds a yawning gap. The gap reflects but one among many associations, mostly positive, between economic freedom and well-being.
[*] Due to tax and spending data for local governments only being collected every five years (in the Census Bureau’s Census of Governments), the dataset contains data only for the years ending in ‘2’ and ‘7.’ Given the two-year lag on the data, 2012 was the most recent year available when the Reason Foundation report was released.
We mostly limited this literature review to studies that used the Fraser Institute’s Economic Freedom of North America index and produced results related to labor markets to some degree.[*] But we also included recent academic papers that used Stansel’s MSA dataset, and more generally, the most recent papers to look for associations between economic freedom and some other metric.
Of all the empirical scholarship performed using the EFNA index through 2016, the labor market freedom component was more frequently associated positively with economic performance than the other two components: government spending and taxation levels. We use 2016 as a cutoff point because Stansel co-authored a literature review (with Meg Tuszynski) of academic papers employing EFNA and constructed the tally using papers through that year.[17]
Their review, “Sub-National Economic Freedom: A Review and Analysis of the Literature,” found that 103 of the 155 empirical studies they examined had “unambiguously good” or “mostly good results,” meaning that economic freedom was found to have a positive relationship with an outcome that is considered to be “good” (e.g., faster economic growth, more entrepreneurial activity, increased employment, etc.). Only one study showed results that could be identified as “mostly bad.”
There were 80 papers they reviewed in which the authors used specific areas of the EFNA index, as opposed to (or sometimes in addition to) the overall index score. In 58 of those papers, there was one or more areas that had a statistically significant relationship with whatever outcome was being examined. The area that had the most consistent positive effect was labor market freedom. It was statistically significant in 36 of those 58 studies. Government spending was significant in 27 and taxation was in 23.[18] The topics of the research included entrepreneurship, corruption, interstate migration, labor market productivity, labor force participation, wages, income inequality, economic and employment growth, venture capital and more. [†]
A 2013 paper, “Economic Freedom and Labor Market Conditions: Evidence from the States,” used EFNA’s dataset from 1981 through 2009 and examined economic freedom and labor market conditions across all 50 U.S. states. It included measures of the unemployment rate, labor force participation and the employment-to-population ratio. The statistical model it created to measure these impacts included control variables for such things as demographics (population percentage over the age of 65, percentage that lives in an urban area or is college educated or female, to name a few). It also controlled for each of the 50 states’ production of energy, on the grounds that being steeped in energy resources may affect the economic well-being of the state more positively.[19]
The authors found statistically significant relationships existed between the unemployment rate and the overall economic freedom score of states, as well as several subcomponents of the index. They noted that “a one-point increase in economic freedom is associated with a 0.78 percentage point decrease in the unemployment rate for the overall EFNA measure.”[20]
Labor force participation was also positively associated with economic freedom. That is, a one-point increase in a state’s overall index score was associated with a 1.5 percentage point increase in labor force participation.[21] This held true for each of the three subcomponents of the EFNA index as well, though the labor market freedom area had the smallest impact. The same was true for the employment-to-population ratio the authors studied: The overall EFNA score and each subcomponent showed a positive relationship, with the labor component producing the smallest effect.
The authors conclude that there is a solid link between economic freedom and positive outcomes in the labor market. They also noted that the labor market freedom component of the EFNA index has smaller impacts than other subcomponents because it is comprised, in part, of state minimum wage mandates, “which typically applies to a small fraction of the labor force.”[22]
The 2014 study, “A Longitudinal Analysis of the Impact of State Economic Freedom on Wages,” demonstrates a statistical link between economic freedom in the 50 states and increased wages.[23] According to the study, (citing the EFNA), Michigan’s freedom score improved from 5.2 out of 10 in 1981 to 5.9 in 1990 and 6.8 in 2000.[24]
To conduct the analysis, the author studied annual youth worker survey data from 1979 through 1994 and then for every two years thereafter, through 2000.[25] This information was then paired to Bureau of Labor Statistics data, which allowed the author to track where each survey taker was located. Using a variety of statistical approaches, the author found that a one standard-deviation increase in a state’s freedom score was associated with a wage increase of between 2.5% and 8.6%.[‡] He also found that changes in the labor market freedom area had a stronger positive relationship with wages than government spending or taxation.[26]
The 2011 European Journal of Political Economy article, “Panel Evidence on Economic Freedom and Growth in the United States,” found a positive and significant relationship between freedom and economic growth, as measured by inflation-adjusted gross state product.[27] The authors examined both the levels of and changes to states’ freedom scores and determined that different areas of economic freedom impact economic growth differently. They conclude:
From a policy perspective, what emerges from these results is the importance of constraining excessive government expenditure within the economy and minimizing the tax burden faced by a nation’s citizens. Further we see the importance of maintaining an open labor market and, in particular, the cost from a growth perspective that may be associated with increases in state minimum wages.[28]
Another 2011 paper looked at economic growth, as measured by changes in employment in U.S. states. That paper, “Economic Freedom and Employment Growth in U.S. States,” was published in the journal Review, a publication of the Federal Reserve Bank of St. Louis. The authors look at economic liberty in three distinct spans of time — 1980-1990, 1990-2000 and 2000-2005 — to explore whether the years in which economic freedom and employment are measured make a difference to their results. The authors used both the EFNA’s overall freedom scores and the three areas that comprise it. They found a positive relationship between economic freedom and employment growth in each of the three periods they examined: An increase of one point on the EFNA’s 0-10 scale was associated with an increase in employment growth rates of about 3-4% over a 10-year period.[29]
A 2016 review, published in the Cato Journal and titled “Subnational Economic Freedom and Performance in the United States and Canada,” found that economic freedom at the state and provincial levels of government in the U.S. and Canada is associated strongly with “higher levels of income per capita, lower rates of unemployment and higher income inequality.” They find that the relationship was strongest for the labor market freedom component, and that a one “standard deviation increase in labor market freedom is associated with a 1.34 standard deviation decline in the unemployment rate.”[30]
“Economic Freedom and Migration Flows between U.S. States” is an oft-cited academic paper, published in the Southern Economic Journal in 2007, which looked at economic freedom and gross migration in the contiguous United States. The author concludes, “States with persistently more economic freedom will experience higher levels of income and more rapid employment growth.”[31] He adds, “[I]n aggregate, the findings indicate that individuals migrate toward states with relatively higher government consumption expenditures, relatively lower tax burdens, and states with more freedom with respect to labor decisions in the form of less restrictive minimum wages, less concentration of unions, and less dependence on public employment.”[32]
After the 2016 literature review by Stansel and Tuszynski appeared, scores of new academic papers have helped inform this new study.
“The Impact of Economic Freedom on Startups,” a 2021 study published in the Journal of Regional Analysis & Policy, looked at the impact of economic freedom on entrepreneurship between 2005 and 2015. Using the EFNA and the Kauffman Startup Activities Index, the authors found that increases in labor market freedom are “likely to cause significant increases in startup density (the rate at which businesses with employees are created in the economy) of entrepreneurial activities.”[33] The authors find that minimum wage and government employment rates drive differences between states and suggest that easing labor market regulations would help increase start-up density.
In contrast, less government spending and lower tax burdens decrease startup density.[34] Indeed, overall index scores show that an increase in economic freedom leads to drops in startup density. The authors note, however, that lower startup density is not necessarily a negative outcome. For instance, it could simply be caused by more startups surviving their first year, which would be a positive outcome.[35]
A 2020 study in the Journal of Entrepreneurship and Public Policy, “The Impact of Labor Market Freedom on State-Level In-Migration in the US,” examined how labor market freedom affected interstate migration during the Great Recession and post-recession period from 2008 to 2016.
The authors postulate that more labor freedom suggests “greater labor-market efficiency as well as better opportunities for entrepreneurship and small business formation and success.”[36] This in turn may induce greater in-migration. The scholars look at discrete components that determine a state’s EFNA labor market freedom score and control for economic phenomena that may otherwise impact their research output. These phenomena include state unemployment rates and the average temperature in January for each state.[37]
They find that increasing a state’s overall labor market freedom component score by just one percentage point is associated with “a 2.8% increase in the gross in-migration rate.” In other words, a 10% increase in a state’s freedom score, say from 6 to 6.6, “would elevate the gross in-migration rate by approximately 28%.”[38] Net in-migration was also positively associated with the overall freedom score.[39]
Another research paper published in the same journal in 2017 and titled “The Impact of Labor Freedom on Geographic Cost of Living Differentials” finds that an increase in state labor market freedom was positively associated with a decrease in the cost of living in 2016. The authors find that cost of living “is a decreasing function of the overall degree of labor market freedom.”[40] In other words, states with greater labor market freedom enjoy a lower cost of living. The authors assert that a one-unit increase in the state’s EFNA labor market freedom score “is found to reduce the overall cost of living by 13.9 percent.”[41]
Digging deeper, the authors also examined the components of the EFNA’s labor market freedom index and controlled for variables that might influence these scores. They found a statistically significant positive relationship between cost of living and both government employment and union density. Better scores in these categories were associated with a lower cost of living.[42] Specifically, they state that, on average, an increase in their measure of freedom from government employment (or “intrusion”) in the marketplace “reduces the cost of living in (a state) by 4.8%.”[43] They found a similar drop in the cost of living (4.5%) for the union density part of the EFNA index.[44]
A 2019 paper in the Journal of Economics and Finance, “Labor Market Freedom and Geographic Differentials in the Percentage Unemployment Rate in the U.S.,” examined the labor market freedom component of the EFNA and its three constituent parts. Using state-level data from 2008 to 2016, the author found that labor market freedom was negatively associated with the state unemployment rate, meaning states with freer labor markets had less unemployment.”[45]
A 2018 paper, “Economic Freedom and Income Levels Across U.S. States,” pays particular attention to economic geography. The authors argue that “spatial spillovers” may influence the measured link between freedom and income.[46] They conclude that a 10% increase in economic freedom is associated with a 5% increase in real per-capita gross state product (GDP at the state level, or GSP). Arguably more central to their paper’s research, they find that an increase in economic freedom in one state can have positive impacts on neighboring states.[47] The authors also ran their analyses for each of the three areas in the EFNA and found a positive and significant link between labor market freedom and per-capita GSP. For every 10% rise in labor market freedom, there was an associated increase of 1.2% in state GSP.
A 2018 study in the Journal of Private Enterprise looked at all three components of the EFNA’s labor market freedom component and their relation to the cost-of-living differences between states. This has important implications for state migration. As the authors point out, other scholarship has found that as the cost of living rises, net in-migration falls.[48] Titled “An Empirical Analysis of the Impact of the Three Labor Market Freedom Indices and Occupational Licensing on Interstate Living-Cost Differentials,” the study finds that the cost of living index for U.S. states is negatively associated with all three variables in the EFNA’s labor market freedom area.[49] So, fewer restrictions in labor markets were associated with a lower cost of living and higher restrictions were associated with a higher cost of living.
A study from 2018 and another from 2020 tackled economic freedom and migration at the MSA level. The first, “Economic Freedom, Migration and Income Change among U.S. Metropolitan Areas,” was published in the academic journal Current Urban Studies. The author concluded that “economic freedom seems to be an important determinant of migration and have positive effects on aggregate and per-capita income.”[50]
The study divided 361 MSAs into three groups based on their economic freedom score from 2002 — low, medium and high — and used IRS data from 2011 to 2015 to analyze the effects of economic freedom on migration and personal income changes.[51] Those MSAs in the high freedom group saw a net, inbound migration of nearly one million people. The medium and lower categories, combined, lost about that same amount. The high freedom MSA category was associated with total income gains from net migration, while MSAs in the medium and low categories were associated with lower levels of income.[52]
The findings on per-capita income gains were more complex. The MSAs in the high economic freedom category saw average increases in per-capita income because of migration. The lower freedom categories also had net increases in per-capita income on average as “outmigrants had, on average, lower income than stayers.”[53]
The second economic freedom and migration-related MSA paper was titled “Economic Freedom and Migration: A Metro Area-Level Analysis.” Using data for 1993 through 2014, the authors found that “a 10% increase in economic freedom of a destination MSA, relative to the economic freedom of an origin MSA, was associated with a 27.4% increase in net migration from the origin MSA to the destination MSA.”[54] (To put that in perspective, a 10% increase in economic freedom would move the Detroit MSA from 36th of the 53 largest MSAs to 24th, putting it on par with New Orleans.)
They found in-migration to be equivalent to adding 22 people each year from each of the other 381 MSAs in the study. Assuming that each of those migrants earn the U.S. median wage ($47,216), the authors calculate that those additional workers migrating into an MSA would represent more than $1 million in adjusted gross income every year. Note that that assumption is probably too strong. Some of those migrants will be either children or retirees, but regardless, that level of in-migration has significant implications for the level of income in an MSA.[55]
A 2021 study by economist Daniel Bennett, “Local Economic Freedom and Creative Destruction in America,” was published in Small Business Economics: An Entrepreneurial Journal. It looked at how economic freedom encourages marketplace disruptions that lead to more businesses and jobs. Bennett used local economic freedom’s impact on dynamism of economies, and his dataset includes almost 300 cities from 1972 through 2012.[56]
To construct his statistical model, Bennett used data from both the Metropolitan Area Economic Freedom Index (developed by Stansel) and measures of dynamism created with data from the U.S. Census Bureau’s database Business Dynamism Statistics.[57] The dynamism data runs from 1977 through 2014. Bennett’s research, like others described here, controlled for factors that may impact his findings, in this case, related to jobs and firms. These included such things as “shares of adults that are living below the poverty line, racial minorities, female, married, immigrants, Hispanic, college graduates” and more.[58]
After running several specifications of his model and tests to examine the strength of his findings, Bennett concluded, “[E]conomic freedom is positively associated with firm and job creation, but it has no effect on firm and job destruction.”[59]
[*] As this paper was being prepared for print, a new review of the academic literature using the Economic Freedom of the World Index was pre-released. It reviewed more than 700 studies published between 1996 and 2022. A majority of the papers found positive results associated with economic freedom, while only 5% reported a bad outcome. Robert Lawson, “Economic Freedom in the Literature: What Is It Good (Bad) For?” (Fraser Institute, 2022), https://perma.cc
[†] The reader will note the authors’ early reference to the Fraser Institute’s Economic Freedom of the World. This was the institute’s first major effort to objectively measure economic freedom, and it led to the Economic Freedom of North America index and other freedom indexes. In 2014, Joshua Hall and Robert Lawson published a literature review of academic articles that use the EFNA. Of the more than 400 articles surveyed, nearly 200 used the ENFA index as a key variable. According to Hall and Roberts, more than 66% of those articles “found economic freedom to correspond to a ‘good’ outcome such as faster growth, better living standards, more happiness, etc.” They summarized: “The balance of evidence is overwhelming that economic freedom corresponds with a wide variety of positive outcomes with almost no negative tradeoffs.” Joshua C. Hall and Robert A. Lawson, “Economic Freedom of the World: An Accouting of the Literature,” Contemporary Economic Policy 32, no. 1 (2014): 1, https://perma.cc
[‡] Jeffrey J. Yankow, “A Longitudinal Analysis of the Impact of State Economic Freedom on Individual Wages,” The Journal of Regional Analysis & Policy 44, no. 1 (2014): 64,66, https://perma.cc
We are interested in the relationship between economic freedom, especially regarding labor markets, and economic outcomes. We focus on local economies, defined as metropolitan statistical areas. We examine three outcome variables: unemployment rate, employment growth and population growth. When their unemployment rate is lower and their employment and population growth are higher, areas tend to be more economically prosperous.
We examine the most recent available data for 383 U.S. metropolitan statistical areas. We break these MSAs into four groups, or quartiles, for presentation purposes: Most free 25%, second most free 25%, third most free 25%, and least free 25%. We compare our outcome variables across those four groups.
We also provide the individual freedom scores of the 14 MSAs in Michigan and compare the unemployment rate and employment and population growth among these statistical entities. Due to limited data availability for local governments, the most recent local economic freedom scores are for 2017.
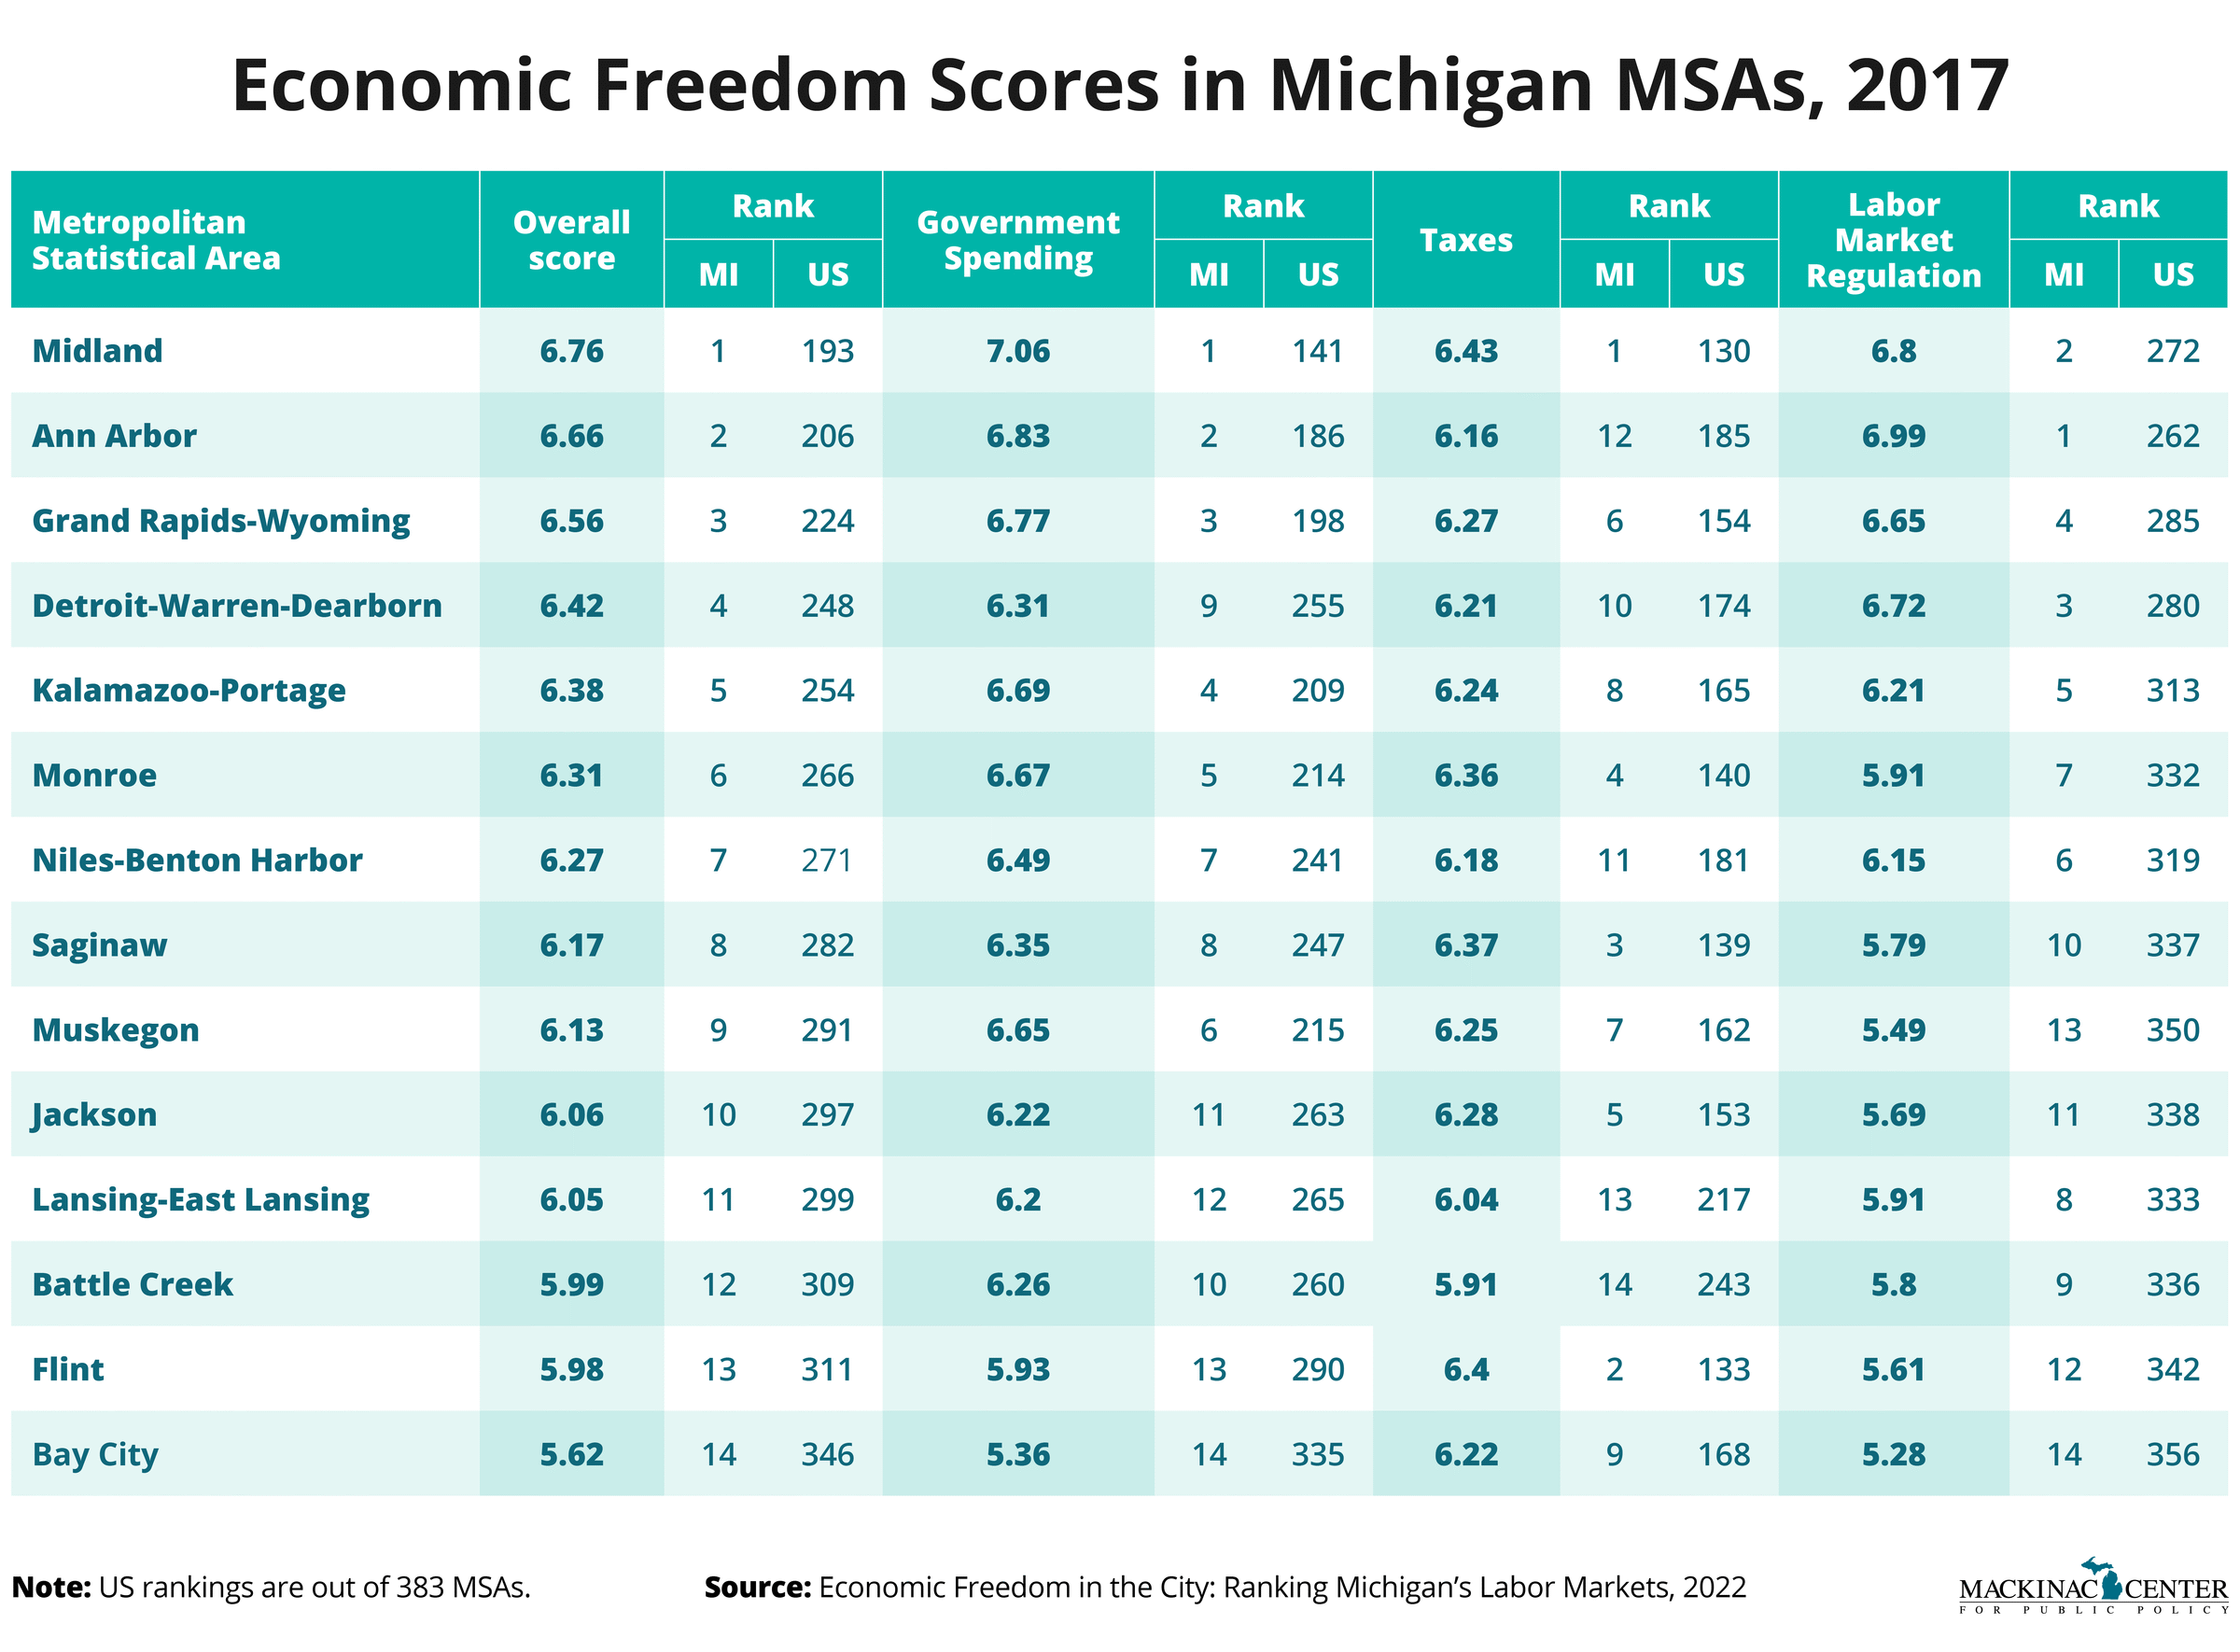
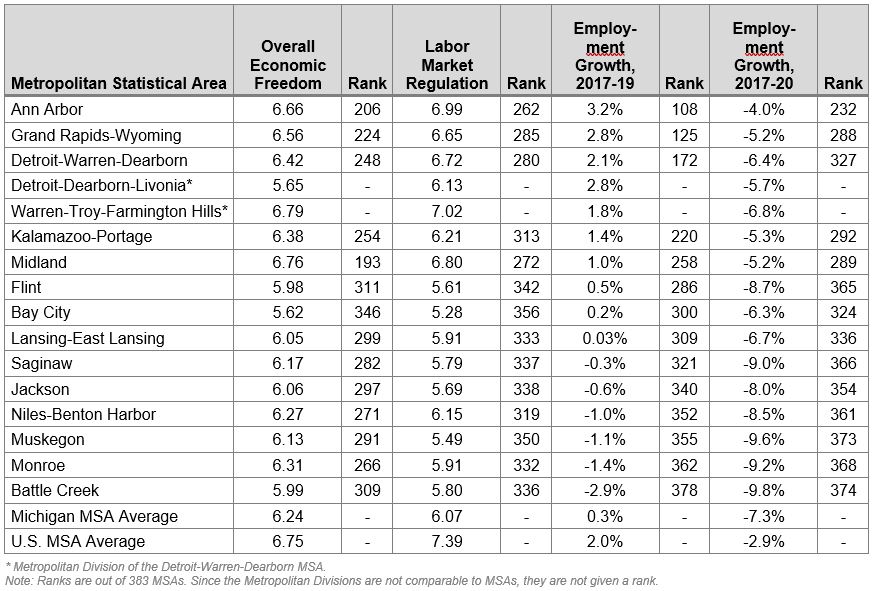
Graphic 4 shows the overall economic freedom score and its three components for the 14 MSAs in Michigan, ranked by their overall score. The two metropolitan divisions of the larger Detroit-Warren-Dearborn MSA are also listed. Michigan MSAs are below average in economic freedom. Only Midland scores higher than the average for all 383 MSAs in the nation. That U.S. average is 8% higher than the Michigan MSA average.
Graphic 4: Economic Freedom Scores in Michigan MSAs, 2017
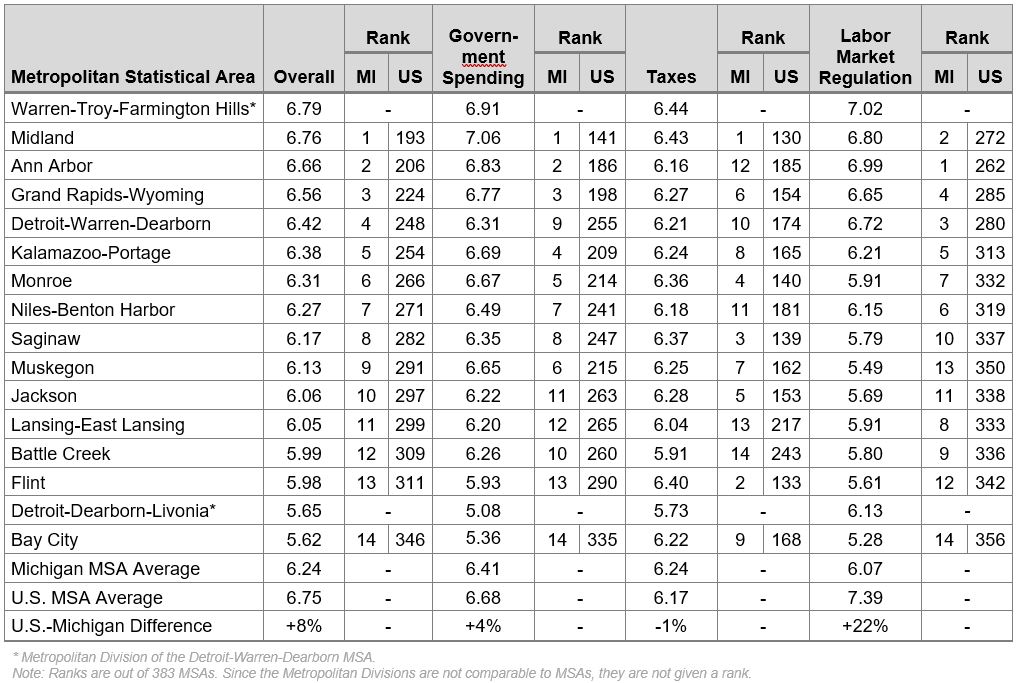
Breaking the overall index out into its three component areas reveals important information about local economic freedom. As Graphic 4 shows, the U.S. freedom score average is only 4% better than Michigan’s MSAs for government spending and is 1% below Michigan’s MSAs for taxes. However, the labor market regulation category is where Michigan does the worst, with the U.S. average outperforming Michigan’s MSAs by 22%. No Michigan MSA is above the U.S. average in that category.
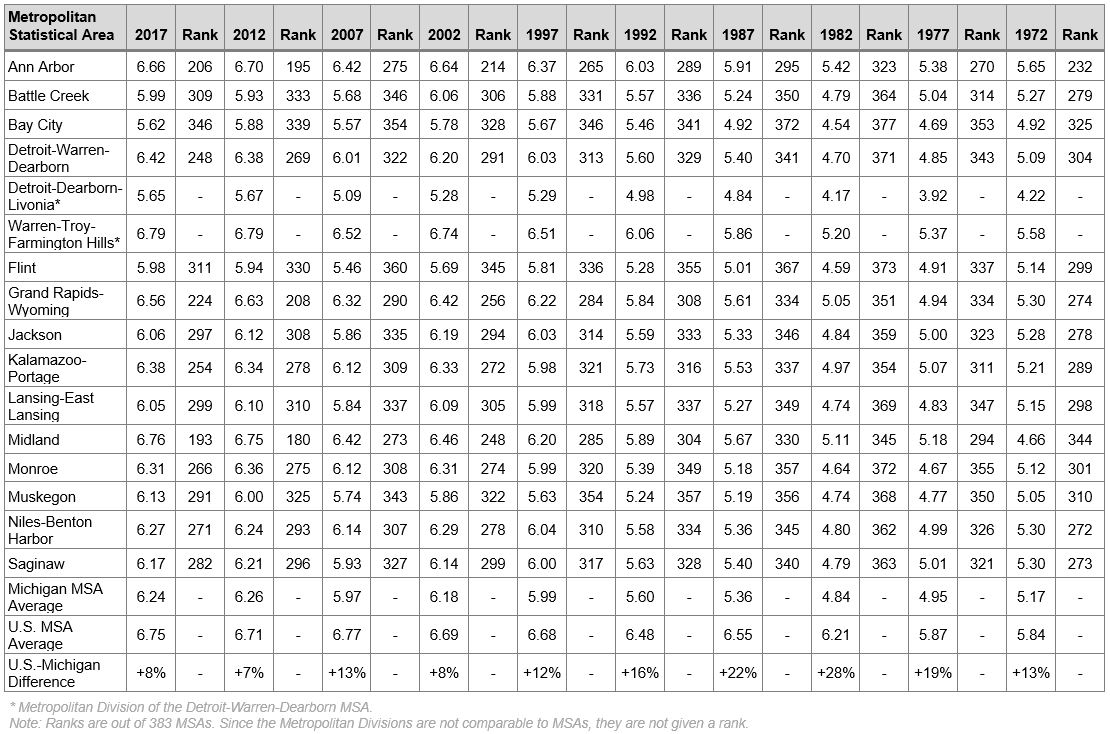
As the historical data in Graphic 5 show, in 2012 and 2017, there was only one Michigan MSA above the U.S. average for overall economic freedom scores. In all eight years before 2012, there were no Michigan MSAs above the average. Furthermore, the latest numbers for 2017, as bad as they are, paint a much rosier picture than those for, say, 1982, when the U.S. average for economic freedom was 28% above Michigan’s MSAs. In fact, 10 of the 14 MSAs moved up in the national rankings from 2012 to 2017, all but Ann Arbor, Bay City, Grand Rapids and Midland. Although there is plenty of room for improvement, there has at least been a general upward trend in Michigan since 1972, the first year of our local economic freedom dataset.
Graphic 5: Overall Economic Freedom Scores and Ranks for Michigan MSAs, 1972-2017
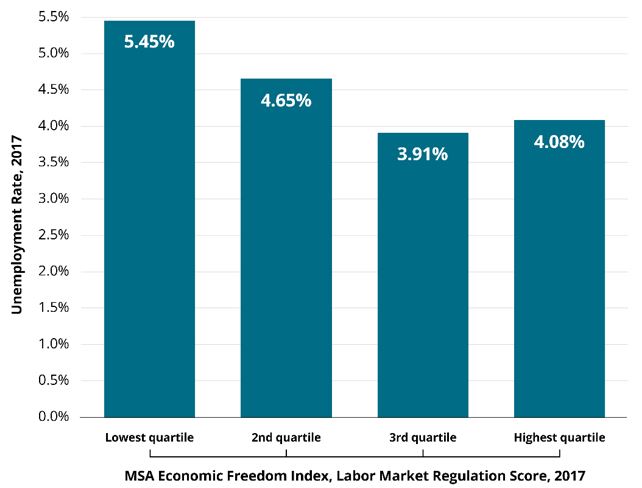
MSAs with less restrictive labor regulations have lower unemployment rates, on average. In Graphic 6 we break the 383 U.S. MSAs into four groups, or quartiles, based on their labor market freedom score. It shows that the 2017 unemployment rate in the MSAs with the least-free labor markets was 5.45%. That is more than one-third higher than average in the MSAs in the most-free quartile.
Graphic 6: MSAs with Higher Labor Market Freedom Have Lower Unemployment Rates
Graphic 7 contains unemployment data for the 14 Michigan MSAs. Their average unemployment rate exceeds the U.S. MSA average. Only four Michigan MSAs had unemployment rates below the U.S. average. In the columns, note the apparent connection between an MSA’s overall economic freedom and labor market regulation scores and its unemployment rate. As freedom and regulation scores fall, unemployment rates tend to rise.
Graphic 7: Economic Freedom and Unemployment Rates in Michigan MSAs, 2017
Drilling down even further, we next examine the minimum wage variable and its relationship to unemployment rates. The minimum wage is what economists call a price floor. The degree to which that price floor is binding in any local labor market depends on what the market-clearing wage in that area is. Because of that, to make comparisons across regions with different income levels, we cannot just use the raw dollar value of the minimum wage (currently $9.87 in Michigan).[60] For example, the federal minimum wage of $7.25 is much more binding in a poor state like Mississippi than it would be in a rich state like Connecticut, where the prevailing wage for low-skilled labor is likely already above that level.
This subject is particularly topical in Michigan. In July, a Michigan appeals court judge reinstituted a $12 minimum wage law that had been amended by the state Legislature in 2018. The case stems from a 2018 ballot initiative. It remains an open question as to whether the decision will be appealed.[61] There is also movement afoot in a separate effort to place on the November 2024 ballot a new, higher minimum wage of $15 in 2027.[62]
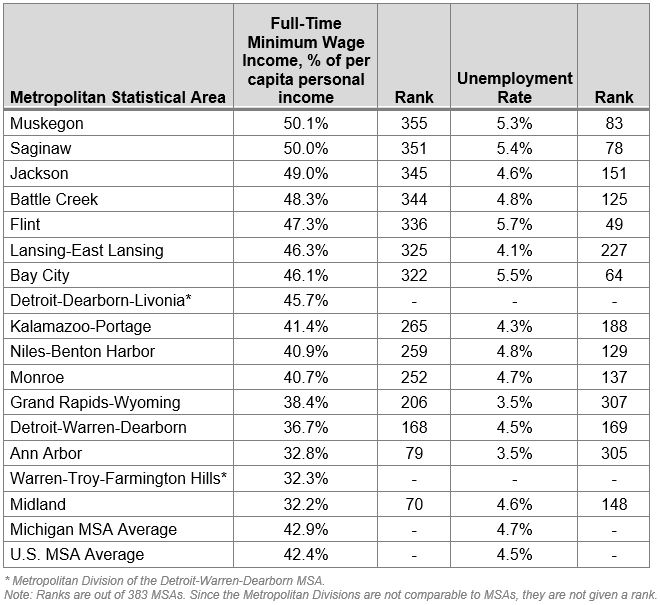
To measure the burden of the minimum wage on the ability of employers and employees to voluntarily enter into agreements to exchange labor for money, we must adjust for income levels. The way that the economic freedom index does so is to measure annual full-time, minimum-wage income as a percentage of per capita personal income in each MSA.[*] One of the reasons that economic freedom may be particularly important for unemployment rates is that it directly impacts the cost of doing business. For example, higher minimum wages make it more expensive to hire low-skilled workers. For some employers, that will lead them to hire fewer workers, which would lead to a higher unemployment rate.
Indeed, Graphic 8 shows that the MSAs in the United States with the highest minimum wage burdens had a nearly 50% higher unemployment rate than those with the lowest minimum wage burdens.
Graphic 8: MSAs with Higher Minimum Wage Burdens Have Higher Unemployment Rates

Graphic 9 shows that half of the Michigan MSAs had a more burdensome minimum wage than the U.S. average. The average unemployment rate in those seven areas was 5.0%, compared to the U.S. average of 4.5%. In general, MSAs with the highest minimum wage burdens were largely those with the highest unemployment rates.
Graphic 9: Minimum Wage Burden and Unemployment Rates in Michigan MSAs, 2017
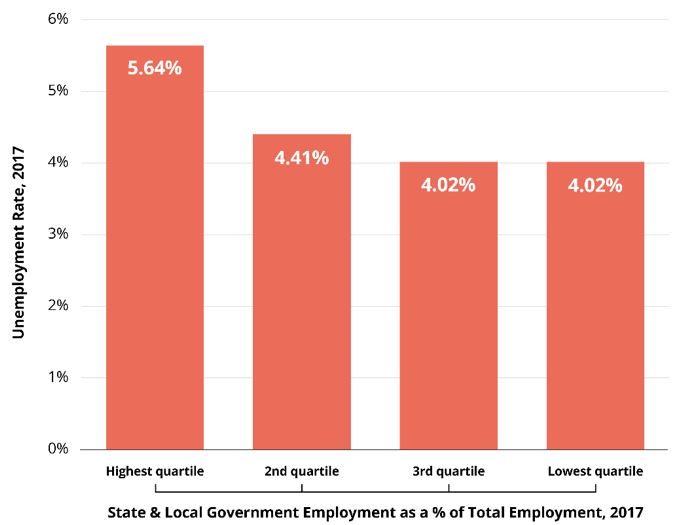
When state and local governments have larger bureaucracies, private employers have more competition attracting workers. Companies then must pay higher wages to keep employees, resulting in them hiring fewer workers than they otherwise might. When competing with government bureaucracies for employees, private firms essentially bid against their own tax dollars. This dynamic is borne out in the economic freedom score data. Graphic 10 shows that the unemployment rate was 40% higher in American MSAs with the largest bureaucracies compared to those with the smallest. Bureaucracies here are measured by the percentage of employment in an MSA that is made up of government employees.
Graphic 10: MSAs with Large Government Bureaucracies Have Higher Unemployment Rates
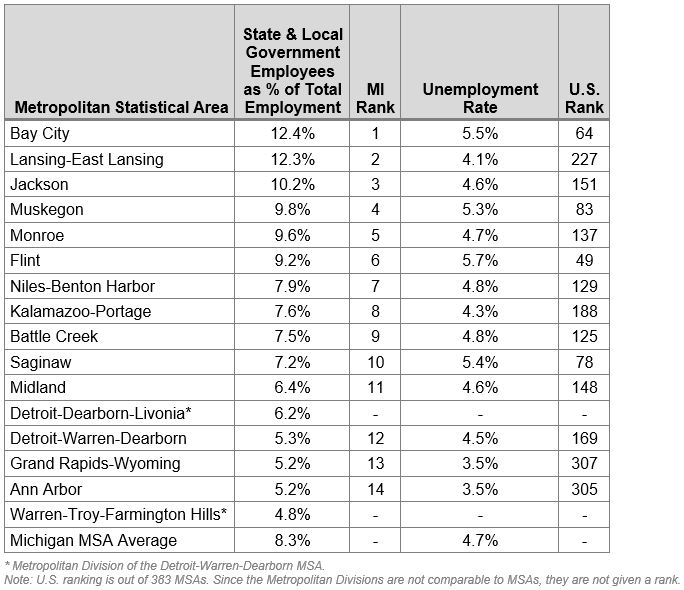
Graphic 11 shows the portion of state and local government employment as a percentage of total employment for each Michigan MSA.[†] Note that MSAs with the smallest bureaucracies have some of the lowest unemployment rates. The variation among some of these MSAs is wide. Bay City’s bureaucratic rank by this measure is more than two times larger than Ann Arbor’s.
Graphic 11: State and Local Government Employees as a Percentage of Total Employment and Unemployment Rates in Michigan MSAs, 2017
[*] Full-time income is computed by multiplying minimum wages by 40 (hours worked per week) and then by 52 (weeks in a year).
[†] The 2019 economic freedom index for MSAs used a state average figure to estimate government employment in each MSA, namely the percentage of total state employment that was state government employment. It added that figure to the number of local government employees in each MSA as a portion of its total employment, producing an estimate of both state and local government employment in each MSA. Because some MSAs have proportionately more state employees than others, this study collected data from Michigan for the actual number of state government employees in each county and used that data to calculate state and local government employment for each Michigan MSA. These statistics are not ranked with MSAs nationally for this reason.
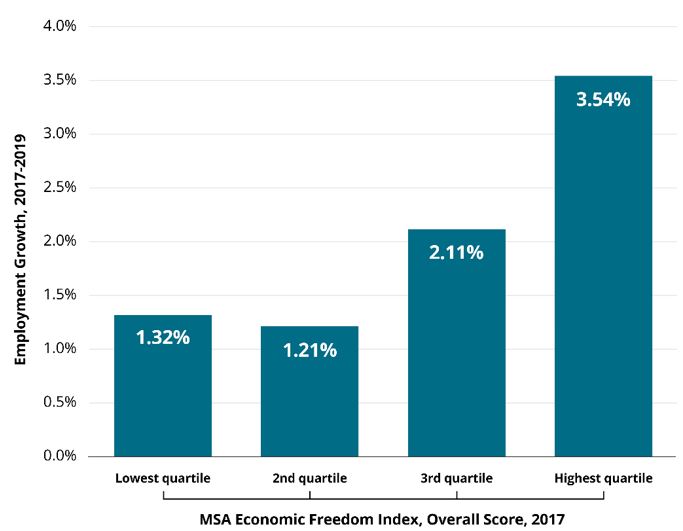
The relationship between economic freedom and employment growth in the 383 MSAs in the U.S. is even stronger than that for unemployment rates. To avoid complications from the COVID-19 pandemic, we included the growth in the number of people employed from 2017 to 2019 only. As Graphic 12 shows, the growth rate in the least-free quartile of MSAs was an anemic 1.32%. In the most-free quartile it was over 2.5 times higher at 3.54%.
Graphic 12: MSAs with Higher Economic Freedom Have Higher Employment Growth
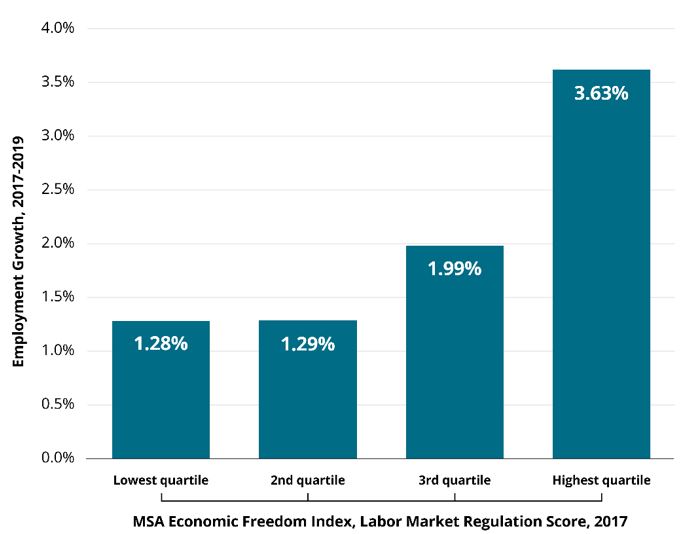
Labor market freedom was found to be particularly important for employment growth. As Graphic 13 shows, from 2017 to 2019, employment grew nearly three times faster in MSAs with the highest scores for labor market freedom compared to those with the lowest scores. This at least suggests that there is a significant preference by employers to grow in areas with the fewest burdensome labor regulations, which is consistent with the academic evidence described in our literature review.
Graphic 13: MSAs with Higher Labor Market Freedom Have Higher Employment Growth
Graphic 14 shows employment growth data for each of Michigan’s 14 MSAs. Only three — Ann Arbor, Grand Rapids and Detroit — had growth that exceeded the national average from 2017 to 2019. Six of the 14 MSAs lost jobs and another three saw job growth of less than 1% over the period.
Graphic 14 also includes results for 2017-2020. Due to the pandemic and related lockdowns, the U.S. average for employment growth was negative, as all areas saw large employment declines in 2020. Michigan’s MSAs did particularly poorly. The best performer was Ann Arbor at -4.0%, which was still a 38% larger decline than the national average and the 232nd worse of the 383 MSAs for employment growth.
Graphic 14: Economic Freedom and Employment Growth in Michigan MSAs, 2017-2020
Michigan’s poor employment growth in 2020 is no coincidence, as the state inflicted some of the most severe pandemic restrictions in the nation. The U.S. Bureau of Labor Statistics indicates that the Great Lake State had the highest rate of government-mandated closures of business establishments in the country in 2020, at 32%, excepting Puerto Rico.[63] Areas with less severe restrictions tended to see less job loss.
It’s also worth mentioning that there appears to be an association between 2020 employment declines and labor market freedom scores. The MSAs that lost the most employment tended to have the most restrictive labor market regulation scores.
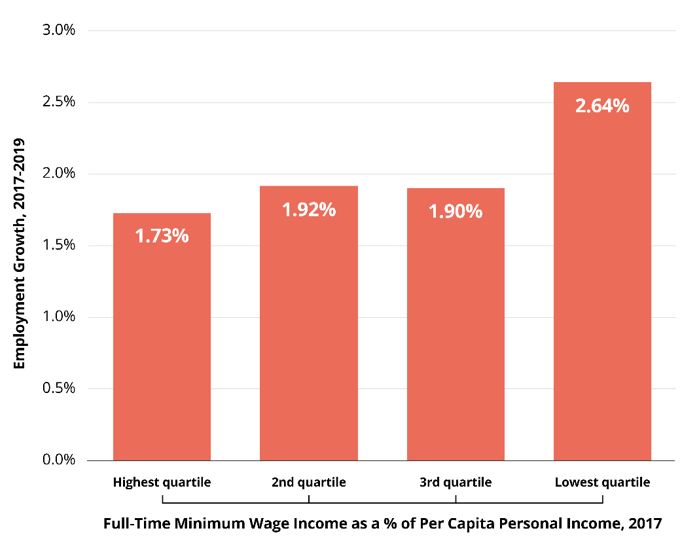
There also appears an association between minimum wage burdens in MSAs nationally and employment growth. From 2017 to 2019, the quartile of MSAs with the lowest minimum wage burdens saw employment grow about 53% more than the quartile of MSAs with the highest (Graphic 15).
Graphic 15: MSAs with Higher Minimum Wage Burdens Have Lower Employment Growth
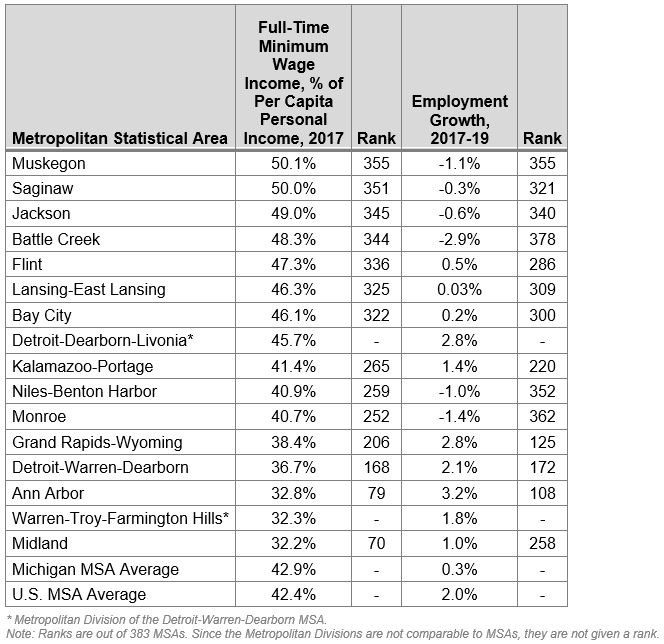
Graphic 16 shows that in half of the Michigan MSAs, the state’s minimum wage burden (again, as represented by full time income as a percentage of MSA per capita personal income) is higher than the U.S. average. Four of those seven saw an employment decline. In the other three it grew by 0.5% or less. In contrast, the four MSAs where the minimum wage is the least burdensome saw employment grow by at least 1%; three of those saw growth above the U.S. average.
Graphic 16: Minimum Wage Burdens and Employment Growth in Michigan MSAs, 2017-2019
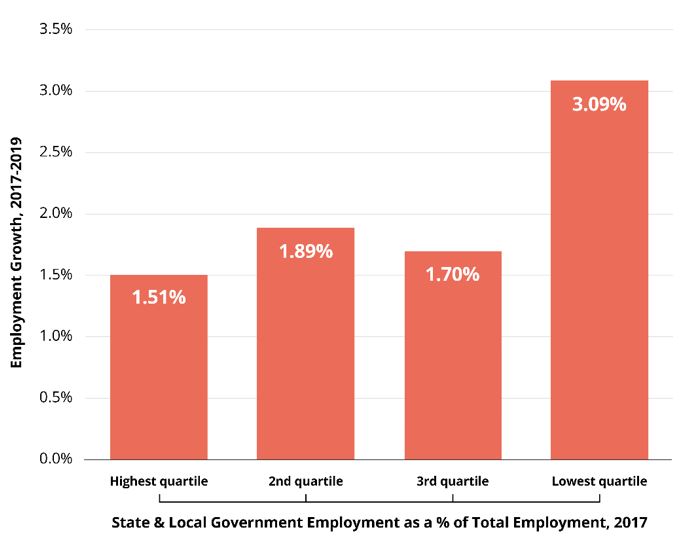
There also appears a connection between the size of a local government bureaucracy and employment growth. Graphic 17 shows that, nationally, employment grew twice as fast in the MSAs with the smallest government bureaucracies compared to those with the largest ones.
Graphic 17: MSAs with Smaller Government Bureaucracies Have Higher Employment Growth
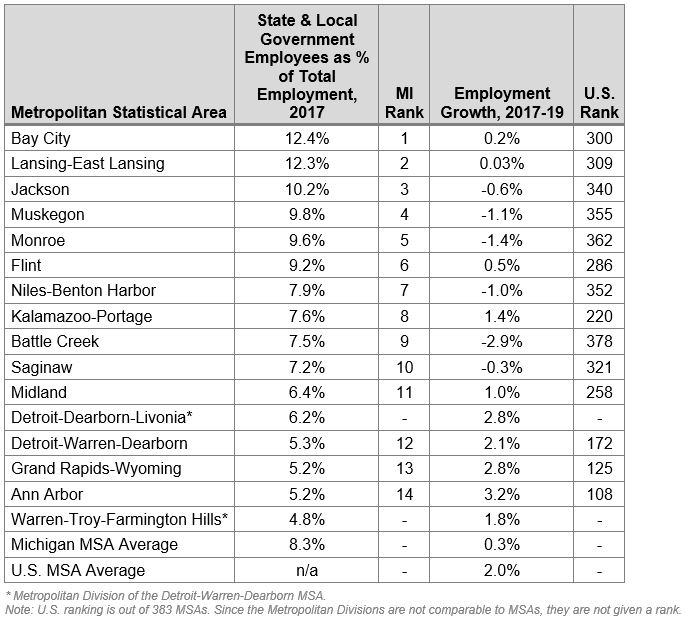
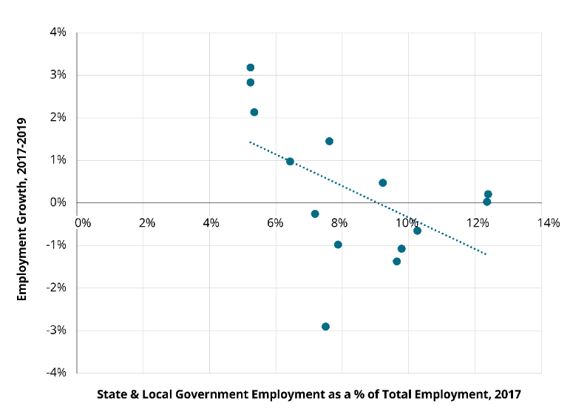
Graphic 18 shows this detailed information for each Michigan MSA. The three areas with the smallest bureaucracies as a percentage of total MSA employment — Ann Arbor, Grand Rapids and Detroit — were the only ones with employment growth from 2017 to 2019 that exceeded the national average of 2%. As the chart below it shows, there’s a strong negative correlation between the size of the bureaucracies in Michigan MSAs and subsequent employment growth.
Graphic 18: Government Employment and Employment Growth in Michigan MSAs, 2017-2019
Graphic 19: Correlation Between Michigan MSA Bureaucracy Size and Employment Growth, 2017-2019
A classic article in economics — Charles Tiebout’s “A Pure Theory of Local Expenditures” from 1956 — held that people “vote with their feet” by moving to areas that provide a mix of public and private goods that they favor, among other things. By examining the relationship between economic freedom and population growth, we can gain some insights on how people feel about policies that promote economic freedom.
Policymakers everywhere should be sensitive to changes in population. There is arguably no better single measure of quality-of-life issues than migration, whether it represents an inter-state or intrastate move. People move for a variety of reasons, but the determinants of interstate migration have long been studied by economists and others. We would argue that economic opportunity is a prime motivator. This subject has been made all the more relevant due to the recent release of Census Bureau data that showed Michigan was once again losing population.[64]
Our own, new MSA-specific research and past scholarship by the Fraser Institute demonstrate strong correlations between economic liberty and population growth at the local and state level, respectively. Academics have also taken on the subject more narrowly, looking for the most prominent variables that influence migration.
For example, economist Richard Vedder has argued that a great story of American migration patterns has been the large movement of people from non-right-to-work states (those with less labor market freedom) to those with more. His study, which ran statistical analyses to control for other confounding variables like the weather or taxes, found: “Without exception, in all the estimations, a statistically significant positive relationship … was observed between the presence of right-to-work laws and net migration.”[65] In other words, labor market freedom helped inspire moves into those states with more of it.
Then there are the more recent economic freedom and migrations studies already referenced in our literature review. The 2020 study from the Journal of Entrepreneurship and Public Policy looked at state level migration and labor market freedom scores from the Fraser Institute’s Economic Freedom of North American index and found that increasing labor market freedom by just a single percentage point is associated with “a 2.8% increase in the gross in-migration rate.” That means a 10% increase in a state’s labor market freedom score (from 6 to 6.6) would raise gross state in-migration by about 28%, a heady figure.[66]
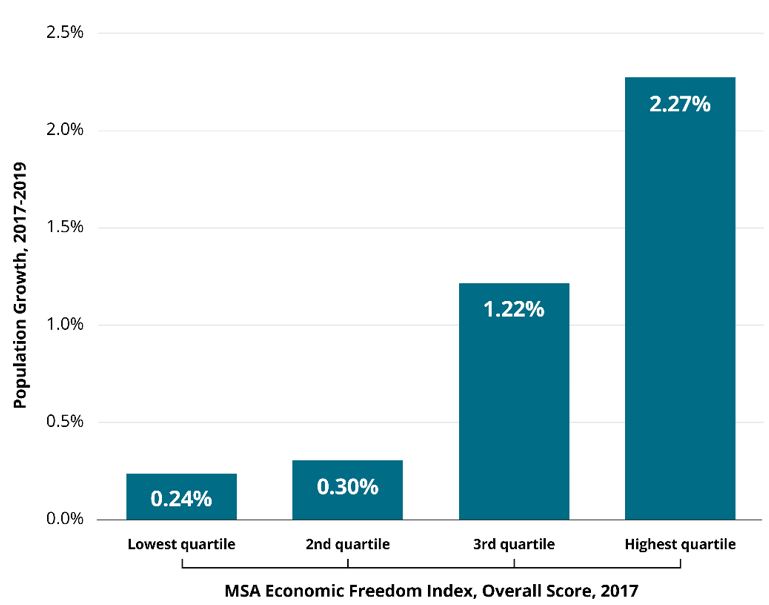
As Graphic 20 shows below, MSAs in the United States in the highest economic freedom quartile saw 2017-2019 population growth that was nearly 10 times higher than those in the lowest quartile. The difference through 2020 (not shown in the graphic) was even greater: population grew more than 20 times faster in the highest freedom areas (3.33% vs. 0.15%).
Graphic 20: MSAs with Higher Economic Freedom Have Higher Population Growth
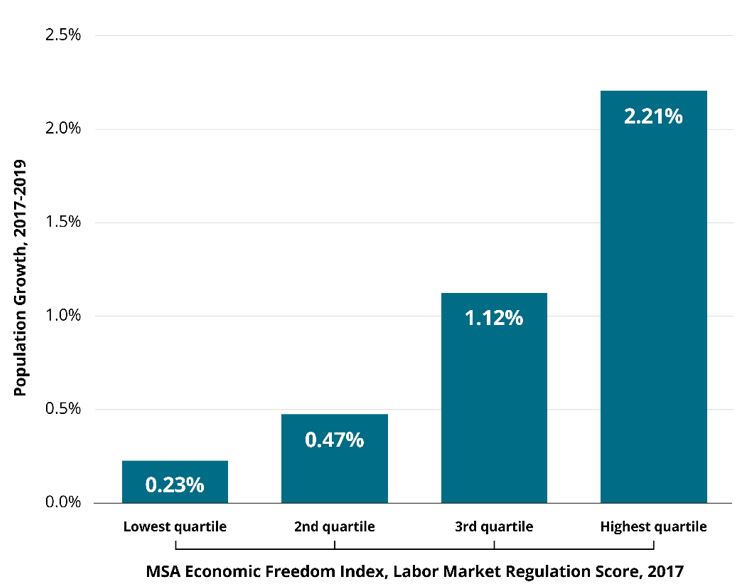
Similar results were found based on labor market freedom. The highest freedom areas saw growth that was about 10 times faster from 2017 to 2019 (Graphic 21).
Graphic 21: MSAs with Higher Labor Market Freedom Have Higher Population Growth
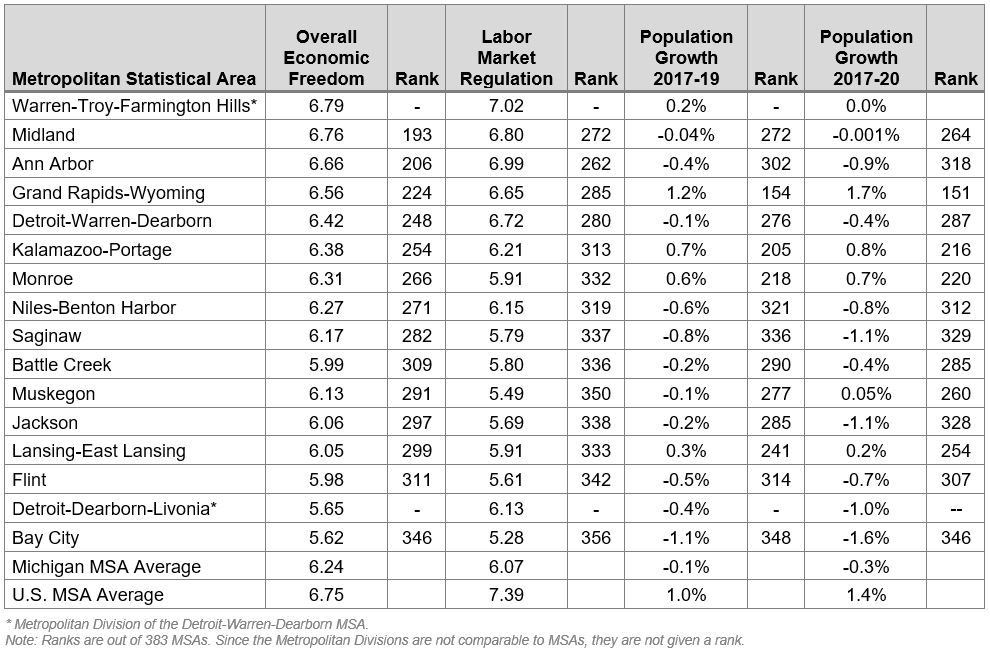
Of the 14 Michigan MSAs, only Grand Rapids, the third-most free in Michigan, saw population growth above the national average (Graphic 22). Only four MSAs saw population increase at all from 2017 to 2019. Population declined in the other 10 MSAs. There was a similar pattern when we examined growth through 2020 (the most recent year available).
Graphic 22: Economic Freedom and Population Growth in Michigan MSAs, 2017-2020
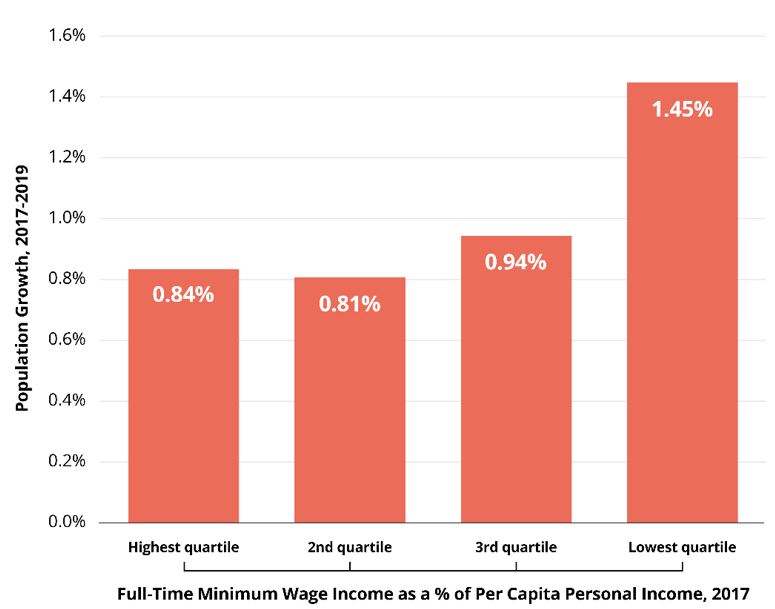
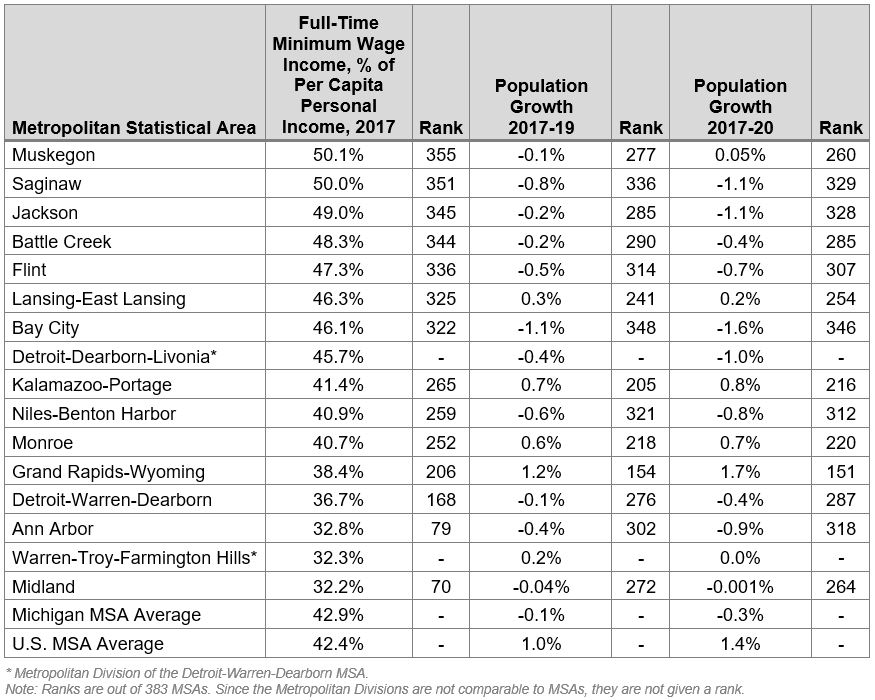
Graphic 23, below, shows that of the 383 MSAs in the country, the ones with the least burdensome minimum wages (full-time income as a percentage of per capita personal income) saw population grow nearly 75% faster than those with the most burdensome ones.
Graphic 23: MSAs with Higher Minimum Wage Burdens Have Lower Population Growth
Graphic 24 gives the numbers for Michigan MSAs. There appears to be a negative statistical correlation between minimum wage burdens and population growth in Michigan MSAs. In both periods, 2017-2019 and 2017-2020, MSAs with lower minimum wage burdens tended to have higher population growth.
Graphic 24: Minimum Wage Burdens and Population Growth in Michigan MSAs, 2017-2020
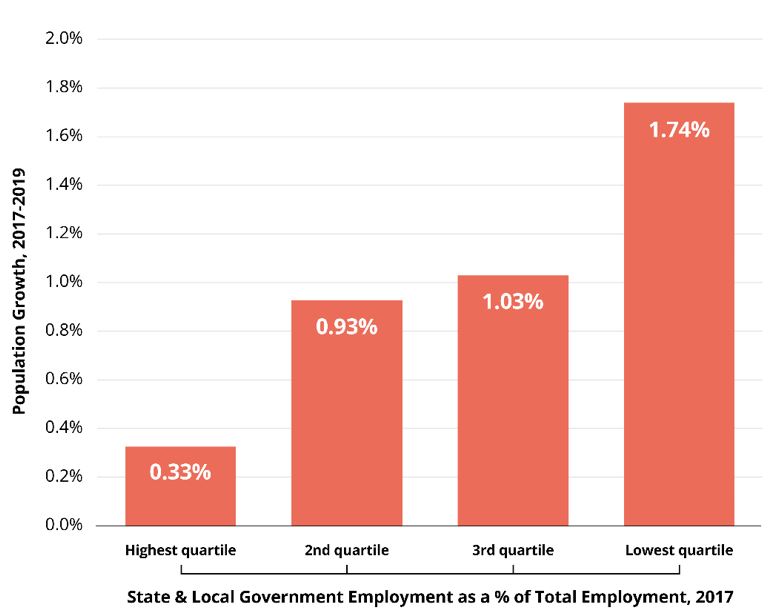
Large bureaucracies seem to be even more problematic for population growth: The MSAs nationally with the lowest government percentage of employment saw population grow more than five times faster than those with the largest bureaucracies (Graphic 25).
Graphic 25: MSAs with Smaller Government Bureaucracies Have Higher Population Growth
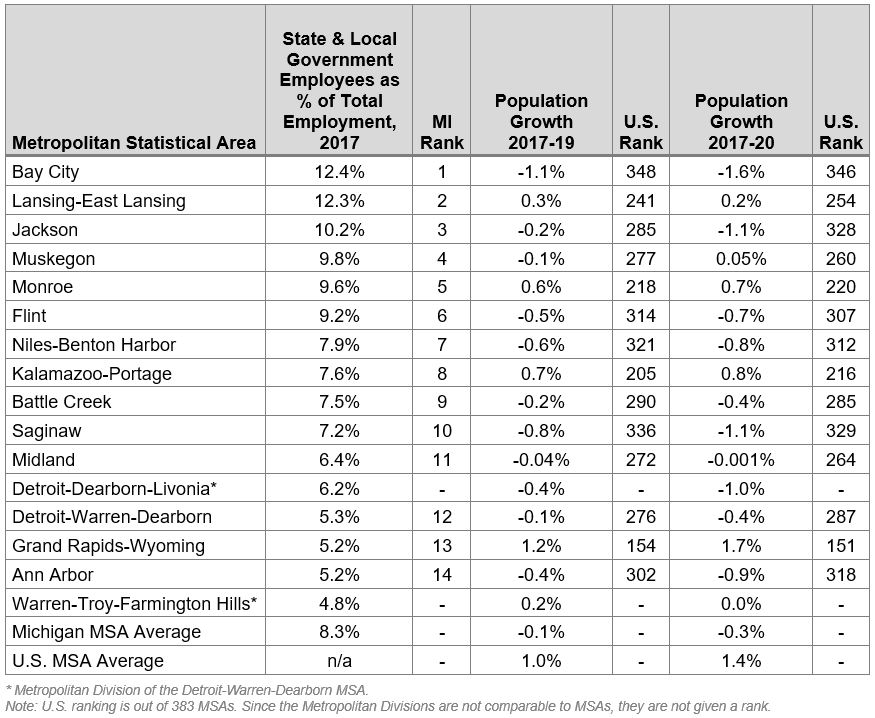
The numbers for Michigan MSAs are in the following table. As with the other variables that are used to measure labor market regulation, government employment appears negatively associated with population growth. The MSAs with larger bureaucracies tended to have less population growth.
Graphic 26: Government Employment and Population Growth in Michigan MSAs, 2017-2020
Has any global or national institution ever attempted to produce a scholarly analysis of economic well-being and ranked the likes of North Korea, Cuba or Venezuela as top performers? Has any scholar argued that the determinants of economic growth lie in the purest of socialist systems? If so, we haven’t seen them.
Scholars from the Fraser Institute and elsewhere, on the other hand, have marshalled enormous amounts of data to study the impacts from economic liberty. They began by looking at freedom levels in different nations, and researchers found associations between countries’ freedom scores and measures of well-being. These same researchers likewise looked at economic liberty (or a lack thereof) in subnational units of government, such as American states and Canadian provinces. Likewise, scholars found many positive associations between economic freedom and well-being.
More recently, and including this study, scholars have begun to find similar positive outcomes between where local governments rank in indices of economic liberty and important metrics such as income, employment and population growth.
Our study presents a clear picture of how Michigan MSAs can improve their economic well-being: increase overall and labor market freedom by reducing policy and regulatory burdens. The big takeaway is that the myriad correlations we’ve identified between local economic freedom and well-being are unlikely to be coincidental.
Policymakers who want to effect positive outcomes, such as lower unemployment rates and a growing population, would do well to study the findings of this and related papers closely. They should adopt the policies demonstrated to improve the economic well-being of their inhabitants and eschew those that don’t. Michigan residents deserve better policy at each level of government.
Our findings also demonstrate that Michigan has a long way to go —its local economic freedom scores and measures of well-being fall short when compared to other states. Only one MSA in the state — Midland — outperformed the average of America’s 383 MSAs and that was only by a statistical whisker. Michigan’s local policymakers should not accept mediocrity. The path to higher freedom scores, lower unemployment, and job and population growth can be found in the variables referenced in this study.
The policy prescriptions we offer should be as clear as the correlations we’ve identified. Keep tax and regulatory burdens light and restrain bureaucratic growth in government. These may seem mundane to some policymakers, but history and evidence demonstrate that exotic central planning schemes aren’t necessary to facilitate economic well-being. Just restraint in the administration of good government goes a long way to promote broad economic growth.
1 “UAW International Headquarters,” https://perma.cc
2 “Right-to-Work States Timeline” (National Right to Work Committee, 2022), https://perma.cc
3 Jarrett Skorup, “Michigan's Right-to-Work Law Led to Huge Drop in Union Membership" (Mackinac Center for Public Policy, March 4, 2021), https://perma.cc/2MCZ-3YMC.
4 Calculations by Jarrett Skorup, based on data compiled by Barry Hirsch and David Macpherson and available at UnionStats.com.
5 James Gwartney et al., “Economic Freedom of the World” (Fraser Institute, 2020), https://perma.cc
6 James Gwartney, Robert Lawson and Walter Block, “Economic Freedom of the World: 1975-1995” (Fraser Institute, 1996), 16, https://perma.cc
7 Dean Stansel, Jose Torra and Fred McMahon, “Economic Freedom of North America 2020” (Fraser Institute, 2020), 2, https://perma.cc
8 Dean Stansel, Jose Torra and Fred McMahon, “Economic Freedom of North America 2020” (Fraser Institute, 2020), 7, https://perma.cc
9 Dean Stansel, Torra Jose and Fred McMahon, “Economic Freedom of North America 2021” (Fraser Institute, 2021), 53, https://perma.cc
10 “Revised Delineations of Metropolitan Statistical Areas, Micropolitan Statistical Areas, and Combined Statistical Areas, and Guidance on Uses of the Delineations of These Areas,” OMB Bulletin No. 17-10 (U.S. Office of Management and Budget, Aug. 15, 2017), https://perma.cc
11 “Metropolitan and Micropolitan: About” (United States Census Bureau, Nov. 22, 2021), https://perma.cc
12 Dean Stansel, “U.S. Metropolitan Area Economic Freedom Index” (Reason Foundation, 2020), 8, https://perma.cc
13 Dean Stansel, “U.S. Metropolitan Area Economic Freedom Index” (Reason Foundation, 2020), 9, https://perma.cc
14 Dean Stansel, “U.S. Metropolitan Area Economic Freedom Index” (Reason Foundation, 2020), 9, https://perma.cc
15 Dean Stansel, “U.S. Metropolitan Area Economic Freedom Index” (Reason Foundation, 2020), 10, https://perma.cc
16 Dean Stansel, “U.S. Metropolitan Area Economic Freedom Index” (Reason Foundation, 2020), 5, https://perma.cc
17 Dean Stansel and Meg Tuszynski, “Sub-National Economic Freedom: A Review and Analysis of the Literature,” Journal of Regional Analysis and Policy 48, no. 1 (2017): 9–10, https://perma.cc
18 Dean Stansel and Meg Tuszynski, “Sub-National Economic Freedom: A Review and Analysis of the Literature,” Journal of Regional Analysis and Policy 48, no. 1 (2017): 10, https://perma.cc
19 Lauren R. Heller and E. Frank Stephenson, “Economic Freedom and Labor Market Conditions: Evidence from the States,” Contemporary Economic Policy 32, no. 1 (2014): 2–3, https://perma.cc
20 Lauren R. Heller and E. Frank Stephenson, “Economic Freedom and Labor Market Conditions: Evidence from the States,” Contemporary Economic Policy 32, no. 1 (2014): 4, https://perma.cc
21 Lauren R. Heller and E. Frank Stephenson, “Economic Freedom and Labor Market Conditions: Evidence from the States,” Contemporary Economic Policy 32, no. 1 (2014): 5, https://perma.cc
22 Lauren R. Heller and E. Frank Stephenson, “Economic Freedom and Labor Market Conditions: Evidence from the States,” Contemporary Economic Policy 32, no. 1 (2014): 4–5, https://perma.cc
23 Jeffrey J. Yankow, “A Longitudinal Analysis of the Impact of State Economic Freedom on Individual Wages,” The Journal of Regional Analysis & Policy 44, no. 1 (2014): 58, https://perma.cc
24 Jeffrey J. Yankow, “A Longitudinal Analysis of the Impact of State Economic Freedom on Individual Wages,” The Journal of Regional Analysis & Policy 44, no. 1 (2014): 62, https://perma.cc
25 Jeffrey J. Yankow, “A Longitudinal Analysis of the Impact of State Economic Freedom on Individual Wages,” The Journal of Regional Analysis & Policy 44, no. 1 (2014): 61, https://perma.cc
26 Jeffrey J. Yankow, “A Longitudinal Analysis of the Impact of State Economic Freedom on Individual Wages,” The Journal of Regional Analysis & Policy 44, no. 1 (2014): 67, https://perma.cc
27 Ryan A. Compton, Daniel C. Giedeman and Gary A. Hoover, “Panel Evidence on Economic Freedom and Growth in the United States,” European Journal of Political Economy2 (2011): 424, https://perma.cc
28 Ryan A. Compton, Daniel C. Giedeman and Gary A. Hoover, “Panel Evidence on Economic Freedom and Growth in the United States,” European Journal of Political Economy2 (2011): 433, https://perma.cc
29 Thomas A. Garrett and Rhussell M. Rhine, “Economic Freedom and Employment Growth in U.S. States,” Review 93, no. 1 (Federal Reserve Bank of St. Louis, January 2011): 5, https://perma.cc
30 Daniel L. Bennett, “Subnational Economic Freedom and Performance in the United States and Canada,” Cato Journal 36, no. 1 (2016): 166–167, https://perma.cc
31 Nathan J Ashby, “Economic Freedom and Migration Flows between U.S. States,” Southern Economic Journal 73, no. 3 (2011): 688, https://www.jstor.org
32 Nathan J Ashby, “Economic Freedom and Migration Flows between U.S. States,” Southern Economic Journal 73, no. 3 (2011): 677, https://www.jstor.org
33 “Kauffman Index of Startup Activity” (Ewing Marion Kauffman Foundation, 2017), 6, https://perma.cc
34 Shishir Shakya and Alicia Plemmons, “The Impact of Economic Freedom on Startups,” Journal of Regional Analysis 51, no. 1 (2021): 30, https://perma.cc
35 Shishir Shakya and Alicia Plemmons, “The Impact of Economic Freedom on Startups,” Journal of Regional Analysis 51, no. 1 (2021): 35-36, https://perma.cc
36 Richard J. Cebula et al., “The Impact of Labor Market Freedom on State-Level In-Migration in the US: A Dynamic Panel Data Analysis, 2008-2016,” Journal of Entrepreneurship and Public Policy 9, no. 1 (2020): 41, https://perma.cc
37 Richard J. Cebula et al., “The Impact of Labor Market Freedom on State-Level In-Migration in the US: A Dynamic Panel Data Analysis, 2008-2016,” Journal of Entrepreneurship and Public Policy 9, no. 1 (2020): 43–44, https://perma.cc
38 Richard J. Cebula et al., “The Impact of Labor Market Freedom on State-Level In-Migration in the US: A Dynamic Panel Data Analysis, 2008-2016,” Journal of Entrepreneurship and Public Policy 9, no. 1 (2020): 49, https://perma.cc
39 Richard J. Cebula et al., “The Impact of Labor Market Freedom on State-Level In-Migration in the US: A Dynamic Panel Data Analysis, 2008-2016,” Journal of Entrepreneurship and Public Policy 9, no. 1 (2020): 47, https://perma.cc
40 Richard Cebula et al., “The Impact of Labor Freedom on Geographic Cost of Living Differentials,” Journal of Entreprenuership and Public Policy 6, no. 3 (2017): 390, https://perma.cc
41 Richard Cebula et al., “The Impact of Labor Freedom on Geographic Cost of Living Differentials,” Journal of Entreprenuership and Public Policy 6, no. 3 (2017): 392, https://perma.cc
42 Richard Cebula et al., “The Impact of Labor Freedom on Geographic Cost of Living Differentials,” Journal of Entreprenuership and Public Policy 6, no. 3 (2017): 391, https://perma.cc
43 Richard Cebula et al., “The Impact of Labor Freedom on Geographic Cost of Living Differentials,” Journal of Entreprenuership and Public Policy 6, no. 3 (2017): 392, https://perma.cc
44 Richard Cebula et al., “The Impact of Labor Freedom on Geographic Cost of Living Differentials,” Journal of Entreprenuership and Public Policy 6, no. 3 (2017): 392, https://perma.cc
45 Richard J. Cebula, “Labor Market Freedom and Geographic Differentials in the Percentage Unemployment Rate in the U.S.,” Journal of Economics and Finance 43 (2019): 828, https://perma.cc
46 Joshua C. Hall, Donald J. Lacombe and Timothy M. Shaughnessy, “Economic Freedom and Income Levels Across U.S. States: A Spatial Data Analysis,” Contemporary Economic Policy 37, no. 1 (2018): 40, https://perma.cc
47 Joshua C. Hall, Donald J. Lacombe and Timothy M. Shaughnessy, “Economic Freedom and Income Levels Across U.S. States: A Spatial Data Analysis,” Contemporary Economic Policy 37, no. 1 (2018): 46, https://perma.cc
48 Richard J. Cebula, John Connaughton and Caroline Swartz, “An Empirical Analysis of the Impact of the Three Labor Market Freedom Indices and Occupational Licensing on Interstate Living-Cost Differentials,” The Journal of Private Enterprise 33, no. 3 (2018): 50, https://perma.cc
49 Richard J. Cebula, John Connaughton and Caroline Swartz, “An Empirical Analysis of the Impact of the Three Labor Market Freedom Indices and Occupational Licensing on Interstate Living-Cost Differentials,” The Journal of Private Enterprise 33, no. 3 (2018): 60, https://perma.cc
50 J. Matthew Shumway, “Economic Freedom, Migration and Income Change Among U.S. Metropolitan Areas,” Current Urban Studies2 6 (2018): 17, https://perma.cc
51 J. Matthew Shumway, “Economic Freedom, Migration and Income Change Among U.S. Metropolitan Areas,” Current Urban Studies2 6 (2018): 6, https://perma.cc
52 J. Matthew Shumway, “Economic Freedom, Migration and Income Change Among U.S. Metropolitan Areas,” Current Urban Studies2 6 (2018): 8-10, https://perma.cc
53 J. Matthew Shumway, “Economic Freedom, Migration and Income Change Among U.S. Metropolitan Areas,” Current Urban Studies2 6 (2018): 11–12, https://perma.cc
54 Imran Arif et al., “Economic Freedom and Migration: A Metro Area-Level Analysis,” Southern Economic Journal 87 (2020): 170–190, https://perma.cc
55 Imran Arif et al., “Economic Freedom and Migration: A Metro Area-Level Analysis,” Southern Economic Journal 87 (2020): 185, https://perma.cc
56 Daniel L. Bennett, “Local Economic Freedom and Creative Destruction,” Small Business Economics: An Entreprenurial Journal 56 (2021): 333, https://perma.cc
57 Daniel L. Bennett, “Local Economic Freedom and Creative Destruction,” Small Business Economics: An Entreprenurial Journal 56 (2021): 339, https://perma.cc
58 Daniel L. Bennett, “Local Economic Freedom and Creative Destruction,” Small Business Economics: An Entreprenurial Journal 56 (2021): 339, https://perma.cc
59 Daniel L. Bennett, “Local Economic Freedom and Creative Destruction,” Small Business Economics: An Entreprenurial Journal 56 (2021): 333, https://perma.cc
60 “Minimum Wage” (Michigan Department of Labor & Economic Opportunity, 2022), https://perma.cc
61 Craig Mauger, “Michigan Judge’s Ruling Could Lead to Minimum Wage Hike for Workers” (The Detroit News, July 19, 2022), https://perma.cc
62 For more information, see: “Michigan $15 Minimum Wage Initiative (2024)” (Ballotpedia, 2022), https://perma.cc
63 “Business Response Survey to the Coronavirus Pandemic: 2020 Results of the Business Response Survey” (U.S. Bureau of Labor Statistics), Table 2e, https://perma.cc
64 Brianna Rice, “New Census Data Show Michigan Population Declining” (Michigan Radio, July 5, 2022), https://perma.cc
65 Richard Vedder, “Right-to-Work Laws: Liberty, Prosperity, and Quality of Life” (Washington DC: Cato Institute, 2010), 174, https://perma.cc
66 Richard J. Cebula et al., “The Impact of Labor Market Freedom on State-Level In-Migration in the US: A Dynamic Panel Data Analysis, 2008-2016,” Journal of Entrepreneurship and Public Policy 9, no. 1 (2020): 49, https://perma.cc