The Michigan Legislature passed legislation in October 2021 to create the Student Opportunity Scholarship Program, which would give thousands of families across the state more spending power to help meet their children's educational needs. This report unpacks this proposed education savings account program and analyzes its potential fiscal impacts.
Michigan families suffered through prolonged school closings and lockdowns that were enacted in response to the COVID-19 pandemic. Most students lost ground academically, especially in mathematics, because of the forced transition to remote instruction, which took an even harder toll on students from disadvantaged groups.[1] With school districts unable to provide reliable, in-person learning environments, thousands of Michigan families sought alternatives in the 2020-21 school year. Families with means to pay enrolled in private schools that provided safe, consistent and effective in-person education. Many families refrained from enrolling their children in kindergarten in fall 2020. These and many others took the plunge into homeschooling their children themselves. They did so without any public support, despite the desperate measures many took to provide a steady learning environment for their children.
Michigan ranks 10th nationally on the latest Education Freedom Index, buoyed in particular by its relatively high degree of homeschooling freedom and access to quality charter school options.[2] The state also finished above the national median for enabling families to access public school districts beyond the borders of the district where they happen to live.[3] Nearly 350,000 Michigan public school students, or one in four, attend either public charter schools or exercise inter-district choice.[4]
While these options benefit many students, parental demand for schooling alternatives still outweighs the supply offered. For instance, a survey found that one-third of Michigan school parents would prefer to send their children to a private school, but only 10% do, as reported for the 2017-18 academic year.[5] Michigan stands in a shrinking minority of states that provide no public support for parents to choose private educational options. The state is increasingly out of step with other states that help parents access private schooling options, policies that have a clear record of success.[*]
A key factor causing Michigan to lag most other states, including all its neighbors in the Great Lakes region, is a uniquely modern but restrictive provision embedded in the state constitution. Adopted through a 1970 ballot initiative, the “anti-parochiaid” amendment forbids both direct and indirect financial aid to private schools — explicitly barring any “payment, credit, tax benefit, exemption or deductions, tuition voucher, subsidy, grant or loan of public monies or property.”[6] While the constitutionality of this provision remains in question, Michigan’s prohibition on supporting private education remains in place. But a recent string of U.S. Supreme Court rulings that have advanced religious liberty and educational choice, including the 2020 case Espinoza v. Montana Dept. of Revenue, offers Michigan families renewed hope.
The state of public opinion is similarly encouraging. Frustration with pandemic school policies has spurred parents to seek further options, and voters have grown more sympathetic to their plight. A fall 2020 Mackinac Center survey found that 67% of Michigan voters favored repealing the constitutional ban on private school aid so the state could provide private tuition scholarships to disadvantaged students, including those who have special needs, are in foster care or have been bullied. More recently, EdChoice reports that 66% of Michigan voters, including 74% of K-12 parents, favor giving parents “a government-authorized savings account with restricted, but multiple uses for educational purposes,” including private school tuition.[7]
Recognizing the trend of growing support, the Michigan Legislature passed legislation in October 2021 to create the Student Opportunity Scholarship Program. The proposal was designed to give thousands of families across the state more spending power to help meet their children’s educational needs.[†] On Nov. 5, however, Gov. Gretchen Whitmer vetoed the legislation. In response, a citizen group organized to collect petition signatures for the purpose of initiating the same legislation and enacting the program. If enough signatures are gathered, the citizen-led initiative, dubbed Let MI Kids Learn, will be decided in 2022 in one of two ways. The Legislature could pass the legislation again and it would become law without the need for the governor’s approval. Otherwise, the initiative will be on the ballot in the 2022 general election and decided by voters.
The basic features of the Student Opportunity Scholarship Program are:
This paper unpacks this education savings account program proposed for Michigan. It puts the proposal in the context of similar efforts in other states to support families’ private education choices. The tax credit funding mechanism aligns with what many other states use, but Michigan’s plan would stand among the broadest in terms of student eligibility and qualified uses of funds. Effective oversight of parent-directed account funds can draw from the approaches other states have taken.
At its core, though, this paper mainly analyzes the fiscal impacts of adopting the Student Opportunity Scholarship plan. Opponents have alleged dire outcomes. But a careful look at the proposal’s details reveals a minor effect on state and local school budgets, with a significant possibility of positive fiscal impacts on a per-student basis.
[*] More than 30 states have enacted voucher, tuition tax credit and/or education savings account legislation. See “School Choice in America Dashboard” (EdChoice, 2022), https://perma.cc/8GQW-V9AN. Of 175 gold-standard research studies on the impacts of private school choice programs, measurable positive impacts outpace measurable negative impacts by more than 12 to one. See “The 123s of School Choice” (EdChoice, April 1, 2022), https://perma.cc/8BLH-88XE.
[†] Two separate but identical versions of the legislative package were passed in late October 2021: House Bills 5404 and 5405, and Senate Bills 687 and 688.
[‡] A child with a disability is defined as in the federal Individuals with Disabilities Education Act, 20 U.S.C.A. § 1401(3). It includes intellectual disabilities, hearing impairments, speech or language impairments, visual impairments, serious emotional disturbance, orthopedic impairments, autism, traumatic brain injury, other health impairments, or specific learning disabilities. See “Section 1401” (U.S. Department of Education, Nov. 7, 2019), https://perma.cc/BRG3-WWX4.
In 1997, the Mackinac Center forwarded a policy solution to advance educational freedom known as the Universal Tuition Tax Credit. The proposed legislation would provide a dollar-for-dollar credit on one of three different state taxes to an individual or business underwriting tuition payments for an elementary or secondary student. Under the plan, the full individual student benefit would be capped at the lesser of two amounts: 50% of state per-pupil revenue or 80% of actual tuition costs.[8]
The Wall Street Journal later recognized the Mackinac Center as the “leading advocate for a universal education tax credit.”[9] Since the Center proposed the Universal Tuition Tax Credit late last century, 20 states have adopted similar legislation.[*] Rather than directly sending state dollars to pay for private schooling, these programs provide tax credits to tuition-paying parents or, more commonly, to K-12 scholarship donors.
The Center updated and improved the tax credit proposal a couple of years later. Key enhancements included an allowance of extra funds to support students needing special education, and additional educational uses of all tax credit funds beyond tuition, such as textbook purchases and school transportation costs.[10]
Proposing the expanded use of these scholarships was well ahead of its time. It was not until 2011 that Arizona became the first state to create a program that included these elements. They’re now commonly called K-12 education savings accounts. These state-funded, restricted-use bank accounts have been available to Arizona families of students with disabilities for a decade, and more recently to students in foster care and those on Native American reservations. Seven other states since have enacted their own ESA programs. Most are limited to students with specific disabilities or otherwise qualifying for special education services.[†] Three of the seven states adopted ESAs in 2021. A notable exception, West Virginia approved the Hope Scholarship Program, the first ESA broadly available to the general student population — 93% of K-12 students are eligible.[11]
[*] The 20 states are Alabama, Arizona, Arkansas, Florida, Georgia, Illinois, Indiana, Iowa, Kansas, Louisiana, Montana, Nevada, New Hampshire, Oklahoma, Pennsylvania, Rhode Island, South Carolina, South Dakota, Utah and Virginia. See “School Choice in America Dashboard” (EdChoice, 2022), https://perma.cc/8GQW-V9AN.
[†] The five states are Florida, Indiana, Mississippi, North Carolina and Tennessee. See “School Choice in America Dashboard” (EdChoice, 2022), https://perma.cc/8GQW-V9AN.
A 2016 Cato Institute report posited the idea of creating a tax credit scholarship mechanism to fund K-12 education savings accounts.[12] Five years later, Kentucky adopted the Education Opportunity Account Program, the first of its kind. Lower-income students throughout the state can use donated funds for various educational services of their choice, while those in select populated counties can also pay for private school tuition from their accounts.[13]
Not to be outdone, neighboring Missouri created the nation’s second tax credit-funded ESA a few months later. The statewide annual limit of $50 million in credits is twice as large as Kentucky’s authorized cap, but it only funds scholarships for students in St. Louis and four of the state’s most populous counties. Priority for Missouri’s Empowerment Scholarship Accounts is given to students from families below a middle-income threshold and students with disabilities.[*]
There are two primary benefits to using private donations and tax credits as a funding mechanism for educational choice. First, the funds never enter government coffers. That creates a layer of separation between regulatory agencies and private education providers, weakening the case for placing more red tape on private schools due to this state-authorized financial aid.[†] Second, it encourages the role of private philanthropy in education. Individuals and businesses have greater incentive to donate scholarship funds that are broadly available to eligible students, and thus are more likely to take direct interest in seeing students served well. In short, it offers a more direct and less bureaucratic form of both funding and accountability.
For their part, ESAs offer a more flexible approach to using funds meant to support learning opportunities. The allowable range of uses for these accounts varies to some degree among the different state programs. Most commonly, though, it authorizes both private school tuition payments and spending on textbooks, curricular materials, testing fees and therapy for children with special learning needs. Some authorizing statutes specifically stipulate that the funds can be saved and used for college or other postsecondary education programs.[14]
A program that combines tax credit funding with ESA flexibility offers the potential to reap the benefits of philanthropic investment, ground-level innovation and family-centered decision-making. But a major challenge lies in growing such programs, as funds must be raised privately, requiring trust between donors and various scholarship-granting organizations. A slower growth curve, however, may be worth the price of a more flexible, dynamic and organic system.
The Let MI Kids Learn ballot initiative represents the latest rendition of this newer model of private school choice. If adopted, it would make Michigan the first state to adopt a tax credit ESA program accessible to eligible students and families no matter where they live in the state.
Michigan voters and policymakers may appreciate the benefits afforded to students and families from these scholarship accounts yet still have concerns about the program’s fiscal impact and level of oversight. Informed by the experiences of other states that have enacted similar programs, the analyses that follow only strengthen the case for Michigan to embrace this policy.
[*] “HCS HB 349 – Relating to Empowerment Scholarship Accounts” (Missouri House of Representatives), https://perma.cc/5QCS-FPWN; Susan Pendergrass, “House Bill 349: Empowerment Scholarship Accounts in Missouri,” Testimony Before the Senate Education Committee (Show-Me Institute March 23, 2021), https://perma.cc/9KRE-R3E4. Missouri’s four charter counties are Jackson, Jefferson, St. Charles and St. Louis. See “County Classifications in the State of Missouri” (Missouri Association of Counties, 2013), https://perma.cc/CFQ5-6MZ4.
[†] Drew Catt, “Breaking Down 'Public Rules on Private Schools” (EdChoice, May 30, 2014), https://perma.cc/H6KA-74J8. Catt’s research found that most regulations on private schools preexist the enactment of private school choice programs and that tax-credit-funded scholarship programs on average face about one-third of the regulatory burden of directly funded programs.
The fiscal effects of educational choice programs may be these programs’ most-studied outcome. Among seven outcomes currently tracked by EdChoice, the number of studies on the fiscal effects of choice programs make up more than 40% of the 175 studies reviewed. There have been 73 studies examining the fiscal effects of choice programs on taxpayers. Of these studies, 68 estimated that these programs generate positive fiscal effects, four found programs to be cost neutral, and five estimated net costs to certain taxpayers. Four of the five analyses that found net costs also reported some net benefits when accounting for both short-run and long-run variable costs.[15]
A recent study by one of the authors (Lueken) estimated the fiscal effects of 40 educational choice programs on state and local taxpayers. It used both short-run and long-run variable cost estimates to generate lower bound and upper bound figures of the fiscal effects of choice programs on taxpayers since their inceptions through fiscal 2018. The programs studied generated between $12.4 billion and $28.3 billion in cumulative net savings, or between $3,300 and $7,500 per student participant. In other words, for each dollar spent on these programs, states or taxpayers experienced up to $2.85 in estimated fiscal savings.[16]
Taxpayer support of public school systems dwarfs public resources devoted to educational choice programs. On average, spending on students enrolled in public schools is nearly three times that used for students who participate in choice programs — $14,000 vs. $5,000, respectively.[17] This gap implies significant fiscal benefits when students leave public schools to participate in educational choice programs. Moreover, choice programs consume only a sliver of total taxpayer support of public school institutions and programs: Just 2% of students enroll in private school choice programs, and these programs receive just 1% of all public funding for K-12 education.[18]
School choice opponents argue that these programs drain resources from public schools and harm students who attend these schools. Some even go as far as claiming that choice will decimate or destroy public education.[19] These critics often point to the cost of choice programs without acknowledging the relevant financial context these programs operate in nor the fiscal benefits these programs generate.
The cost of a school choice program tells just one part of the fiscal story. The net fiscal impact provides a more complete picture — the net fiscal impact of a choice program to the state is a function of both cost and savings:
Overall net fiscal impact of choice program = Program cost – Savings when students leave public schools
While it is true that there is a cost associated with a student who leaves a public school to enroll in a private school choice program, that student also generates savings for the state because most states, including Michigan, fund public schools primarily based on how many students are enrolled. The state fiscal effect then is straightforward, similar to the equation above.
Furthermore, when school districts have fewer students to educate, they have lower costs. In the short run, costs go down by the portion of a district’s spending that is variable. Variable costs are those which vary directly with enrollment. In the long run, all costs are variable, meaning that schools can adjust fully over time to changes in enrollment.
Districts lose students for a number of different reasons — e.g., families want to access a different school, families move, students graduate. The fiscal effects of students leaving via a choice program is the same as that of students leaving for other reasons. Most Michigan school districts have experienced these effects for more than a decade as the state’s total enrollment has continued on a downward trend.[20]
School choice opponents argue that these choice programs hurt districts because funding decreases when enrollment drops. They claim that public schools have high fixed costs, such as electricity bills, maintenance and staff salaries. However, some also argue for increased funding for public schools during times of enrollment growth, claiming schools need more textbooks, supplies or staff. This suggests that public schools have high variable costs. But both cannot be concurrently true. The fact is, despite what school opponents argue, some school costs are more variable than others, but in the long-run, schools can adjust their costs based on their enrollment.
Economist Benjamin Scafidi estimated the short-run variable costs for public schools in the U.S. To identify which costs are variable, he looked at school districts in Georgia with significant declining enrollment. He then observed which types of expenditures school officials were able to reduce proportional to their enrollment decline. That is, he identified where the percentage reduction in an expense category for a district was greater than the district’s percentage decline in enrollment.[21]
Scafidi identified five categorical expenditures that these districts reduced that was more than commensurate with the percentage decline in enrollment. These were instruction, pupil support services, instructional staff support services, food service and enterprise operations.[*] He estimated that these expenditures made up 63% of total expenditures for public schools in Michigan.[22] That is, 63% of all spending for Michigan public school districts is variable in the short run.
The question of whether students who remain in public schools have more or fewer resources for their education when students leave via choice programs depends on the relationship between its short-run variable costs and its reduction in revenue:
District net fiscal impact = Decrease in variable costs – Revenue reduction
As long as variable costs exceed a district’s corresponding revenue reduction as a result of a choice program, then students who remain in public schools will have more resources devoted to their education on a per-pupil basis.
In addition to the regular intake of state, local and federal funds, Michigan public school budgets received over $5.9 billion in COVID-related federal relief.[23] As of April 2022, local school officials had spent less than a quarter of those funds. Both local and national reports indicate some districts have taken in more extra money than they are able to spend.[24] Others are implementing strategies that hold very little promise of improving student achievement, such as issuing large across-the-board employee bonuses.[25]
Students who leave public schools via choice programs generate fiscal benefits for the state. We refer to these students as “switchers.” “Nonswitchers,” then, are students who would enroll in a private school even without financial assistance from a choice program. To the extent that these students qualify for a choice program, they become a new cost to the state. Thus, another necessary factor for estimating the fiscal effects of a choice program is the switcher rate, or the percentage of students participating in the choice program who would enroll in a public school but for the choice program.
It follows that if the switcher rate is greater than the ratio of the average cost of the choice program to the average cost of public schools, then the program will generate net fiscal benefits for the state.[26]
Switcher rate > Avg. cost of choice program per student / Avg. per-pupil cost to educate choice students in public school systems
From the perspective of state taxpayers, the break-even switcher rate is the average per-student cost to fund the choice program divided by the state average per-student cost of educating these students in the public school system.
Michigan’s school funding system protects public school institutions because not all dollars are allocated based on enrollment levels. In Michigan, when districts lose students, they keep all local funds (which are based on local property values, not enrollment) and some federal funds, those based on census tract data and other factors unrelated to enrollment. On average, about 67% of Michigan state and local funds are disbursed based on enrolled students.[27] Thus about a third of a school district’s total funding is unaffected when a student leaves for a different school. This mechanism has fiscal implications when district enrollment changes for any reason, including for a new choice program.
[*] According to the National Center for Education Statistics, enterprise operations “include expenditure for business-like activities (such as a bookstore) where the costs are recouped largely with user charges.” “Documentation for the NCES Common Core of Data School District Finance Survey (F-33), School Year 2016–17 (Fiscal Year 2017)” (National Center for Education Statistics, March 2020), https://perma.cc/9DLQ-5PNA.
Michigan K-12 public school districts receive funding from three sources: local, state and federal revenues. On average, funding for public school districts in Michigan comprises 30.3% local revenue, 57.2% state revenue, and 12.5% federal revenue.[28]

The majority of revenue that districts receive comes through the “foundation allowance” formula. The foundation allowance is a minimum amount of funding per student guaranteed for school districts by the state. This stream of revenue is made of a mix of local and state sources. For fiscal 2022, the minimum foundation allowance is $8,700 per student. The state designates extra funds to districts for students from low-income households, students with disabilities and English language learners, among numerous other categorical grants.[*]
To visualize how the foundation allowance works, think of a jar for each district. The district’s enrollment, characteristics of students and the size of the foundation allowance set by the state determine the size of the jar. The state calculates how much local revenue the district can raise via property taxes and puts that in the jar. Then the state calculates what is needed from state sources to fill the rest of the jar. When enrollment grows, all else equal, the size of the jar increases, and state funds fill the newly created empty space. When enrollment decreases, holding constant all other factors, the jar shrinks, and the state funds once needed for that district are used for a different district or program. The amount of local revenue in the jar does not change as enrollment changes. Nearly all the variability happens by state policy and with state funds.
The state also allows districts with declining enrollment to receive 10% of their per-pupil funding based on the previous year’s spring count, which gives a district some small aid for fixed costs.[†] Further, a small number of districts are allowed to levy additional property tax based on a 1994 agreement to prevent them from enduring funding cuts when a new school finance system, known as Proposal A, was adopted.[29] Some small, rural districts can average their pupil counts for the previous three years for determining their enrollment-based funding levels, reducing the impact of enrollment declines.[30] These different mechanisms function to soften the hit from reduced funding created by a decrease in enrollment.
[*] Districts also receive supplemental funds for English-language learners, students with special needs, and small and remote districts. How these supplemental funds are distributed varies. For example, districts receive a flat amount for each ELL student (ranging from $105 to $935 per ELL student), and special education is funded via reimbursement for special education expenses. “FundEd: State Policy Analysis, A Detailed Look at Each State's Funding Policies: Michigan” (EdBuild, 2022), https://perma.cc/SW8D-9NSA.
[†] To help cope with the pandemic, the state passed a new declining enrollment provision which allowed districts during the 2020-21 school year to receive revenue based on 75% of the prior year’s enrollment count and 25% of the current year’s enrollment count. Since then, funding for districts has returned to being based on 10% of the prior year’s spring enrollment and 90% of the current year’s fall enrollment. Hannah Jarmolowski and Marguerite Roza, “Proceed With Caution: With Enrollment Drops, States Are Looking to Hold District Budgets Harmless” (Edunomics Lab, Georgetown University, February 2021), https://perma.cc/9PR9-GAUR.
Total funding for Michigan public school systems was $14,191 per pupil in FY 2021.[*] When a student leaves a public school, foundation allowance payments by the state will be reduced by $8,700 for most districts.[†] Thus, as long as the state’s cost to support the student in the choice program is less than $8,700, the state benefits fiscally each time a student leaves a public school to participate in the program.
 - click to enlarge")
To gauge the potential fiscal impact on school districts, we first estimate short-run variable costs for public schools. We use a variant of Scafidi’s method by taking a more cautious approach. That is, we consider three of the five categorical expenditures that Scafidi identified as variable in the short run: instruction, pupil support services, and instructional staff support services.[‡] Using school finance data from the U.S. Department of Education, we estimate that 61.7% of total per-pupil expenditures is variable in the short run, or $8,755 per student. This amount is slightly greater than the per-pupil foundation allowance amount of $8,700. Therefore, if students leave a district via a choice program, the district on average has about the same amount of variable cost burden relief with which to offset its revenue reduction of $8,700.
Finally, let’s consider the following example where the average cost to fund an ESA is $7,830, which is 90% of the foundation allowance and the maximum amount the state would pay. Compare this to the foundation allowance, whose maximum cost to the state is $8,700 per public school student. As long as the switcher rate for the ESA program is greater than 90%, i.e., more than 90% of ESA students would enroll in public schools without ESAs available, then the program will produce net fiscal benefits for the state.
To recap: Public school districts would not automatically suffer fiscal harm if students left to participate in an ESA program like the one proposed in Michigan. If the reduction in revenue a district experiences from enrolling one fewer student is less than the short-run variable costs spent per student, the district will not be worse off financially. This means schools could end up with more resources available for each student still enrolled. This is true, in fact, no matter the reason for a student leaving — whether for a new ESA program, a public charter school or to enroll in a neighboring district through Schools of Choice.
From the state’s perspective, it generates fiscal benefits if the average cost for an ESA is less than the average cost for the state for educating those students in the public school system. This also depends on the switcher rate, or the percentage of ESA students who leave public schools. If the switcher rate is greater than the ratio of the average program cost per ESA student and the average cost for the state to educate students in public schools, then the state will fiscally benefit from the ESA program.
[*] Author’s calculation based on data from the 2020-21 National Public Education Financial Survey from the National Center for Education Statistics and the total “Fall 2020 Headcount” in Historical Student Enrollment Counts Data from the Center for Educational Performance and Information. The figure excludes expenditures and enrollments attributed to the state’s 56 intermediate school districts.
[†] The foundation allowance amount for 42 of the 830 public school district and charter schools in Michigan is greater than $8,700. Thus, when a student leaves these districts, the decrease in foundation aid for those districts and public charter schools will exceed $8,700. “2021-2022 School District Foundation Amounts” (Michigan Department of Education), https://perma.cc/4VP5-DLLW.
[‡] By excluding these other two categories, this calculation provides a more conservative estimate of school districts’ variable costs. In fiscal 2021, Michigan school districts and charter schools reported $588,344,559 spent on food services and $0 spent on enterprise operations, a combined $423 per pupil. Including this spending would increase the variable costs calculation to $9,178 per student, or 64.7% of total expenditures.
The estimate in the following section is based on a framework where public school enrollments primarily dictate the amount of state revenue dedicated to foundation allowance payments. But two important caveats need to be added. First, the number of students served in public schools would be affected not only by decisions to switch to private education through a choice program, but by a host of other factors that continue to drive a long-term declining K-12 enrollment trend. Second, state lawmakers could decide to adjust other funding sources within the existing school aid budget that would alter the impacts on local districts in ways not directly related to changes in student enrollment. For example, lawmakers could devote more state aid to the foundation allowance if they reduced how much is spent on categorical grants.
Foundation allowance payments consume most of the state’s School Aid Fund. But decisions over how to use those dollars for various purposes related to education are part of a larger budget negotiation. The amount available to spend is determined by actual and projected calculations of designated School Aid Fund revenue, which comes from a variety of collected tax sources.
Among the items over which the Legislature and governor must reach agreement is the foundation allowance rate. The formula for determining the rate depends on the total funds state officials want to set aside and two projected figures. First, the total amount is divided by the number of full-time equivalent students expected to enroll during the October count period (adjusted by the declining enrollment formula protections described above). Then the anticipated collections of local property tax dollars that fund the foundation allowance are subtracted. Because these figures are estimates but the allowance rate is set in law, the total amount spent will vary at the end of the fiscal year from the initial amount budgeted to pay districts these promised funds.
The amount of money spent annually from Michigan’s School Aid Fund has grown each year since 2013, except for a brief disruption of state revenues during the initial stages of the COVID-19 pandemic. Enrollment in public schools has dropped dramatically over the same period. Just in the past four years, School Aid Fund allocations grew from $12.7 billion to $14.9 billion, or by about 17%.[31] Spending on categorical grants grew substantially more than spending for the foundation allowance — the former increasing by 39%, the latter by only 8%. Categorical spending now consumers 33% of SAF allocations, up from 28% four years ago.
If a newly enacted education savings account program enabled more students to opt out of public schooling, the number of public school students among whom school aid dollars could be distributed would be reduced. The mechanism and source chosen to fund ESAs would more precisely determine the amount available to lawmakers to appropriate among school districts for all purposes, including but not limited to the foundation allowance.
To summarize, the following analysis estimates the fiscal impact of this proposed scholarship program, but other factors unrelated to the program will affect the actual fiscal impact experienced by the state, school districts and taxpayers.
We consider an ESA program funded by tax credits from taxpayer donations to scholarship organizations that award ESAs to eligible students. The program analyzed here includes major elements from a tax credit-funded, ESA program introduced in House Bills 5404 and 5405, legislation that would create the Michigan Student Opportunity Scholarship Program. For simplicity, the analysis does not reflect all the components of the bill that could affect the program’s fiscal impact.[*]
Students eligible for the program must satisfy at least one of the following requirements:
Because there is no requirement for prior-enrollment in public school, the analysis generates fiscal impact estimates under switcher-rate assumptions of 60% and 90%.[‡]
The tax credit rate is 100%, meaning individuals and businesses receive a dollar-for-dollar income tax credit for the amount donated. Total tax credits are limited to $500 million each year. The program allows up to 10% of scholarship-granting organizations’ funds to be used for administrative costs.
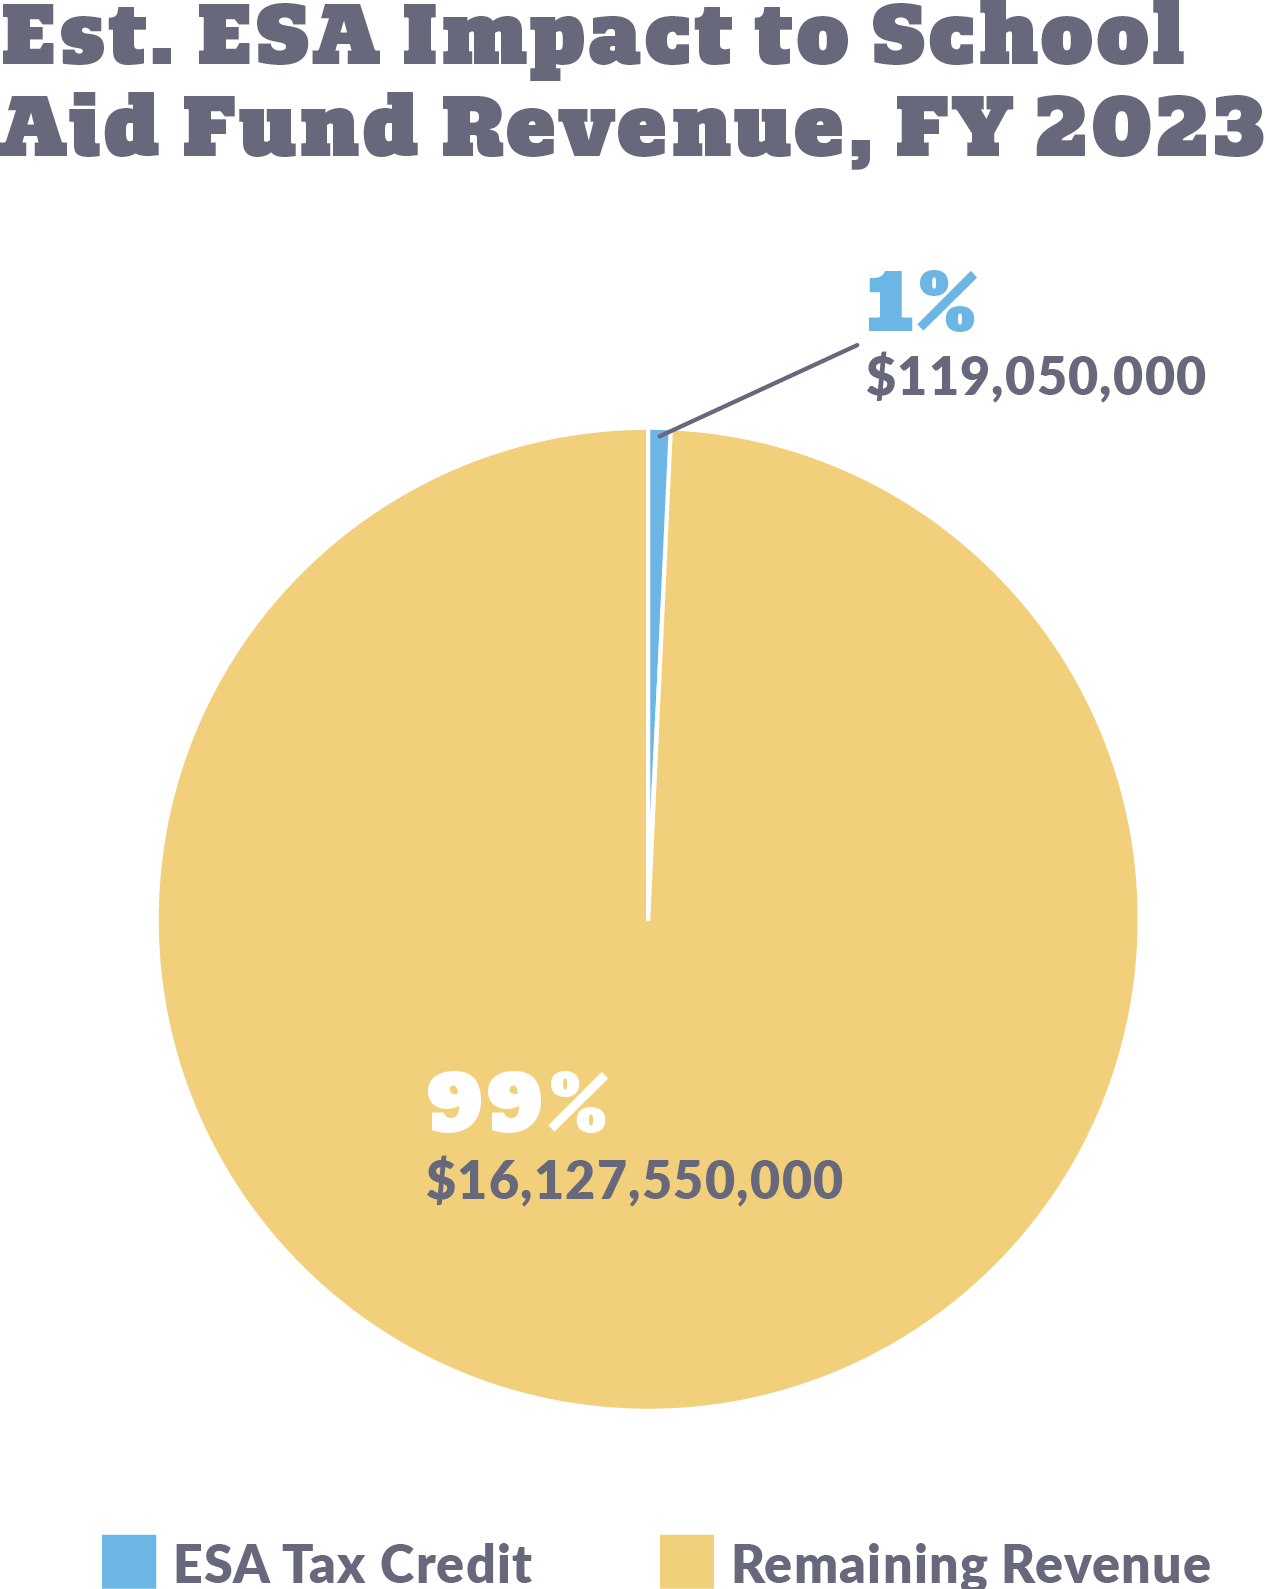
Under current state law, about three-quarters of these tax credits would be applied against the state’s general fund and the rest applied against school aid revenue.[32] If all the tax credits were issued, that would represent about $119 million less in revenue for the School Aid Fund, an amount less than 1% of the fund’s annual intake.
Scholarships are worth up to 90% of the state’s minimum foundation allowance, or $7,830 (= 0.9 x $8,700). Students who have a disability and students from households with income below the income eligibility criteria for the federal FRPL program would receive this maximum amount. Students from households with income above the FRPL threshold but below 200% of this threshold would receive a lesser ESA amount. This amount would be determined by a sliding scale based on household income, with the smallest scholarship equal to five-eighths of the maximum scholarship, or 90% of the foundation allowance. This would translate to a maximum ESA amount of $4,894 (= .625 X $7,830) for students with household income that is 200% of the FRPL threshold.
The analysis generates estimates under two average ESA amounts: $6,000 and $4,000. Because only students with disabilities and those who qualify for the FRPL program are eligible to receive the maximum amount, the average ESA amount will necessarily be less than $7,830. Additionally, as is typical of such programs operating in other states, scholarship-granting organizations would have the flexibility to provide students with scholarship amounts below the state-mandated caps, enabling them to provide aid to a greater number of students.[§]
The program has a limit on tax credit disbursements equal to $500 million. The analysis assumes that the credit limit is reached, i.e., taxpayers donate $500 million during the program’s first year.[**] Assuming a 10% withholding of funds for administrative costs, $450 million in funds would be available for ESA distributions. If the average ESA amount is $6,000, $450 million would fund 75,000 ESA accounts for students, or 9% of the eligible student population. If the average amount is $4,000, 112,500 ESA accounts could be established.[††]
Table 1 below summarizes estimates under these scenarios: switcher rates of 60% and 90%, and average ESA amounts of $6,000 and $4,000. We first walk through our most cautious results, shown in the first column of Table 1 and labeled Scenario 1, which corresponds to an average ESA amount of $6,000 and a 60% switcher rate. Under this scenario, of the 75,000 ESA students, 45,000 would be switchers.
[*] For example, under the proposed bill, students would be able to participate in the ESA program and simultaneously enroll in public schools. The ESA amount for these students would be significantly less than students would receive if they enrolled in nonpublic settings (equal to $500 or $1,100 depending on whether the student has a disability). This component would have the effect of increasing program costs. However, because there is no other choice program currently in operation with a similar feature to inform the present analysis, we do not include it in the analysis. This analysis focuses solely on the fiscal impact of students using the program to enroll in private schools.
[†] A child with a disability is defined as in the federal Individuals with Disabilities Education Act, 20 U.S.C.A. § 1401(3). It includes intellectual disabilities, hearing impairments, speech or language impairments, visual impairments, serious emotional disturbance, orthopedic impairments, autism, traumatic brain injury, other health impairments, or specific learning disabilities. See “Section 1401” (U.S. Department of Education, Nov. 7, 2019), https://perma.cc/BRG3-WWX4.
[‡] The 60% assumption is based on prior survey research by EdChoice which tends to find that, on average, 40% of respondents indicate private school as their most preferred setting for their children when asked, “If it were your decision and you could select any type of school, and financial costs and transportation were of no concern, what type of school would you select in order to obtain the best education for your child?” For example, 39% of respondents in an Iowa survey indicated private school for their choice. This would imply a nonswitcher rate of about 40%. This switcher rate is likely very cautious given that scholarship organizations and private schools tend to have missions oriented around maximizing student participation in choice programs. That is, scholarship organizations are likely driven to “spread the wealth” among as many students as possible. Andrew D. Catt, Michael Shaw, John Kristof, and Trish Wilger, “Iowa K–12 & School Choice Survey” (EdChoice and Iowa Alliance for Choice in Education, January 2021), https://perma.cc/R2UF-XQ63.
The 90% switcher rate is from the body of empirical evidence on private school voucher programs, based on random assignment, which provides information on switcher rates. The programs studied were oversubscribed and held lotteries to determine if applicants received a voucher or not. In these studies, researchers observed the percentage of families who lost a lottery and enrolled their children in public schools after applying to a choice program. Thus, these students would have attended a private school only if they had received a scholarship from a school choice program. Lueken summarized this body of research from six different school choice programs across the nation. He identified 27 estimates of switcher rates from this research and estimated that the median switcher rate directly observed among students who applied to voucher programs but lost a lottery was 90%. Martin F. Lueken, “The Fiscal Impact of K-12 Educational Choice: Using Random Assignment Studies of Private School Choice Programs to Infer Student Switcher Rates” (Journal of School Choice, March 4, 2020), vol. 15, 2: 170-193.
[§] The $4,000 ESA amount is close to the weighted average for scholarship amounts awarded by SGOs in other states with tax-credit scholarship programs, or $4,026. See “School Choice in America Dashboard” (EdChoice, 2022), https://perma.cc/8GQW-V9AN. The $6,000 amount exceeds the average scholarship amount for nearly all existing tax-credit scholarship programs with reportable data and could be viewed as an upper bound on the potential per-pupil cost of the program. The number of total ESAs and associated fiscal impact could be altered by the number of current public school students who receive supplemental ESAs.
[**] If tax credit disbursements equal $250 million, or half of the limit amount, then the fiscal effects estimates will also be half, under the same set of assumptions.
[††] Based on household income data from the U.S. Census Bureau, we estimate that 54% of K-12 students in the state come from households with income below 200% of the FRPL eligibility limit, or more than 821,000 students. U.S. Census Bureau, “Family Type by Presence of Own Children Under 18 Years by Family Income in the Past 12 months (In 2019 Inflation-Adjusted Dollars),” 2019 American Community Survey 1-Year Estimates.
The cost to the state to fund these ESAs would be $500 million (the maximum amount of tax credit disbursements allowed). Foundation allowance payments to public schools would be reduced by $391.5 million (= 45,000 x $8,700).
The net fiscal impact on the state would be a cost of $108.5 million (= $500 million – $391.5 million), or $1,447 per ESA.
Public schools would experience a reduction in foundation allowance payments equal to $391.5 million. Using our estimate for average short-run variable costs per student of $8,755, the estimated reduction in total short-run variable costs related to 45,000 students choosing to leave equals $394 million (=45,000 x $8,755).
The net fiscal impact on public schools is a short-run fiscal benefit equal to $2.5 million (= $394 million – $391.5 million), or $33 per ESA.
The combined net fiscal impact would be a short-run cost equal to $106 million (= $108.5 million - $2.5 million), or $1,414 per ESA.
Note that the estimates discussed above are under an analysis that assumes a high average ESA amount and a relatively low switcher rate.
For an average ESA amount equal to $4,000 and a 90% switcher rate, the net state fiscal impact changes dramatically. This rate would fund 112,500 ESAs with the available $450 million in tax-credit account funds. Of this group, 101,250 would be switchers from public schools.
The cost to the state to fund these ESAs would still be $500 million. Foundation allowance payments would be reduced by $880.9 million (= 101,250 x $8,700).
The net fiscal impact on the state would be a benefit of $380.9 million (= $880.9 million - $500 million), or $3,386 per ESA.
Public schools would experience a reduction in foundation allowance payments equal to $880.9 million. Using the $8,755 estimate for average short-run variable costs per student, the estimated cost reduction related to 101,250 students leaving equals $886.4 million (= 101,250 x $8,755).
The net fiscal impact on public schools is a short-run fiscal benefit equal to $5.56 million (= $886.44 million - $880.88 million), or $50 per ESA.
The combined net fiscal impact would be a short-run benefit of $386.44 million (= $380.88 million + $5.56 million), or $3,435 per ESA.
Table 1 below shows additional details about these scenarios and results from two additional scenarios: a $6,000 average ESA and a 90% switcher rate (Scenario 2) and a $4,000 average ESA and a 60% switcher rate (Scenario 3). The results under these scenarios fall in between those from Scenario 1 and Scenario 4 described above.

Effective oversight of the Student Opportunity Scholarship Program starts with the processes for granting and renewing a nonprofit organization’s authorization to accept tax credit donations. In order to qualify, an organization must be incorporated and have federally recognized 501(c)(3) nonprofit status and conduct background checks on all employees. In applying to the state treasury department, organizations also must explain how they will effectively serve students and families, and approve service providers as options for families to choose. To keep its authorization, an organization must furnish clean audits and limit overhead spending to the legally recognized limits.[33]
Just as is true with the much larger outlays of current education funding, safeguards cannot guarantee the complete prevention of fraud or misuse of funds. But the measures embedded in the Student Opportunity Scholarship proposal are designed to ensure overwhelming fiscal integrity. Included is a measure that automatically requires an account to be suspended in cases where organizations detect substantial misuse of donor dollars.
A 2016 report looked to Arizona, the pioneer state for K-12 education savings accounts, for ways to ensure integrity and minimize fraud.[34] In addition to regular audits, as provided in the Student Opportunity Scholarship legislation, the report cited the use of merchant category codes to help ensure families could not use accounts for illegitimate expenses. These codes could be borrowed from the credit card and debit card industry to reject purchases that do not fit the disclosed educational purposes that meet the guidelines set forth in law.
Under Michigan’s proposal, scholarship-granting organizations “shall implement a commercially viable, cost-effective, and parent-friendly system” for using accounts to pay for educational services.[35] Such systems will not need to invented from scratch, though they may need to make minor adaptations to be used in a Michigan context. The proposal also requires parents to sign a statement acknowledging the eligible spending uses for their accounts.
Commercial vendors have worked to help implement similar programs in other states. Existing and emerging companies in this growing market can bring the expertise needed to provide financial technology and anti-fraud services, so that individual account-granting organizations do not have to reinvent the wheel. Privately contracted technical solutions offer the possible further benefit of streamlining administrative overhead, which could allow additional moneys above the 90% threshold to directly fund scholarships.
The Let MI Kids Learn initiative contains safeguards to ensure the integrity of donated scholarship funds, while encouraging scholarship providers to use funds in an accountable and efficient manner. That should give even greater confidence in the benefits of this proposal.
Michigan Student Opportunity Scholarships would represent a dramatic new way to fund learning by facilitating and incentivizing private donations to aid families directly so they could underwrite the cost of needed educational services. Most students would be eligible to benefit from a scholarship, whether enrolled in a public school or not. Enabling parents to have greater say in their children’s learning would help ensure that students get the attention they need to overcome lost learning and get on a successful trajectory.
Beyond these benefits, the design of the program offers a potential cost savings to both the state government and local school agencies. This impact will depend on the average scholarship size granted and the rate of students who switch from public to nonpublic schools as part of the program. Reasonable estimates indicate that thousands of students could be served with new needed options while public schools preserve and even continue to grow their revenues on a per-pupil basis.
The design of the program is advantageous for creating local, flexible arrangements that best meet individual student and family needs, welcoming both traditional and innovative new education service providers to play an active role. It also would provide direct and organic accountability between students, donors and scholarship providers, with limited room for bureaucratic interference beyond the ability to monitor and enforce fiscal integrity.
While the proposal would create the space for a dynamic, nimble and thriving ecosystem, the challenge comes in filling the space with informed parents, confident donors, savvy scholarship administrators and forward-thinking education providers. The opportunity to put student needs and student learning at the center makes the ambitious goal a worthwhile pursuit.
[1] Megan Kuhfeld et al., “Learning During COVID-19: Initial Findings on Student’s Reading and Math Achievement and Growth” (NWEA Research, Nov. 2020), 3, https://perma.cc/SEP3-R8CM; “What We've Learned about Unfinished Learning,” (Curriculum Associates, March 2021), v, https://perma.cc/7PSN-9AK2.
[2] Patrick J. Wolf, Jay P. Greene, Matthew Ladner and James D. Paul, “Education Freedom and Student Achievement: Is More School Choice Associated with Higher State-Level Performance on the NAEP?” (University of Arkansas, March 2021), 11-12, 15, https://perma.cc/B969-PR46.
[3] Patrick J. Wolf, Jay P. Greene, Matthew Ladner and James D. Paul, “Education Freedom and Student Achievement: Is More School Choice Associated with Higher State-Level Performance on the NAEP?” (University of Arkansas, March 2021), 14, https://perma.cc/B969-PR46.
[4] Authors’ calculations based on data from the Center for Educational Performance and Information.
[5] “Public Opinion Tracker” (EdChoice, April 7, 2022), https://perma.cc/J8TW-Q9UA; “Digest of Education Statistics: 2019” (National Center for Education Statistics,2019), Table 205.10, https://perma.cc/TA43-7BNS.
[6] Mich Const, art. VIII, § 2.
[7] “Public Opinion Tracker: Michigan” (EdChoice, April 7, 2022), https://perma.cc/G8KF-RWHE. The data reflect rolling 12-month results through April 7, 2022. The survey highlights the opinions of 963 voters, including a sample of 482 school parents.
[8] Patrick L. Anderson, Richard McLellan, Joseph P. Overton and Gary Wolfram, “The Universal Tuition Tax Credit: A Proposal to Advance Parental Choice in Education” (Mackinac Center for Public Policy, Nov. 13,1997), 2-3, https://perma.cc/3YP9-9AMP.
[9] “Extra Credit” (The Wall Street Journal, Sept. 5, 2001), https://perma.cc/M422-GA3V.
[10] See “Addendum” in Patrick L. Anderson, Richard McLellan, Joseph P. Overton and Gary Wolfram, “The Universal Tuition Tax Credit” (Mackinac Center for Public Policy, Nov. 13, 1997), https://perma.cc/A44G-DDU5.
[11] “West Virginia: Hope Scholarship Program” (EdChoice, 2022), https://perma.cc/W48Z-RBJ7.
[12] Jason Bedrick, Jonathan Butcher and Clint Bolick, “Taking Credit for Education: How to Fund Education Savings Accounts through Tax Credits” (Cato Institute, Jan. 20, 2016), https://perma.cc/V8LK-T2CS.
[13] “Kentucky: Education Opportunity Account Program” (EdChoice, 2022, https://perma.cc/7AXT-A37M.
[14] See “School Choice in America Dashboard” (EdChoice, 2022), https://perma.cc/8GQW-V9AN.
[15] “The 123s of School Choice” (EdChoice, April 1, 2022), https://perma.cc/8BLH-88XE.
[16] Martin F. Lueken, “Fiscal Effects of School Choice: Analyzing the Costs and Savings of Private School Choice Programs in America, (EdChoice, November 2021), 3, https://perma.cc/8BNJ-BZNT.
[17] Martin F. Lueken, “Fiscal Effects of School Choice: Analyzing the Costs and Savings of Private School Choice Programs in America, (EdChoice, November 2021), 4, https://perma.cc/8BNJ-BZNT.
[18] Martin F. Lueken, “Fiscal Effects of School Choice: Analyzing the Costs and Savings of Private School Choice Programs in America, (EdChoice, November 2021), 11, https://perma.cc/8BNJ-BZNT.
[19] Jason Bedrick and Ed Tarnowski, “Who’s Afraid of School Choice? Examining the Validity and Intensity of Predictions by School Choice Opponents, (EdChoice, December 2021), https://perma.cc/M6KC-6ENM.
[20] “Pupil Membership History: FY 1994-95 to FY 2021-22” (Michigan Senate Fiscal Agency, Jan. 20, 2021), https://perma.cc/JFR4-QE6U.
[21] Benjamin Scafidi, “The Fiscal Effects of School Choice Programs on Public School Districts” (The Friedman Foundation for Educational Choice, March 2012), https://perma.cc/T2BX-YFED.
[22] Benjamin Scafidi, “The Fiscal Effects of School Choice Programs on Public School Districts” (The Friedman Foundation for Educational Choice, March 2012), 13, https://perma.cc/T2BX-YFED.
[23] "Michigan School District: Extra COVID Funds Breakdown" (Mackinac Center for Public Policy, December 2021), https://perma.cc/P2WD-JC9U.
[24] Matt Barnum, "Schools Got Record COVID Money for Teacher Jobs, Building Upgrades. Why Haven't They Spent It?" (USA Today, March 18, 2022), https://perma.cc/Q8KZ-HAQ2; Melissa Frick, "Grand Rapids Public Schools Struggling To Spend Federal Dollars Ahead of Deadline" (MLive, Feb. 13, 2022), https://perma.cc/4NTJ-86R8.
[25] Tom Gantert, "Debt-Ridden Flint Schools To Give Each Employee $22k in Federal COVID-19 Money" (Michigan Capitol Confidential, Mackinac Center for Public Policy, Feb. 21, 2022), https://perma.cc/6G7V-HFJQ.
[26] Martin F. Lueken and Benjamin Scafidi, “Myth: School Choice Siphons Money Away From Public Schools and Harms Taxpayers” in Corey A. DeAngelis and Neal P. McCluskey, eds., School Choice Myths: Setting the Record Straight on Education Freedom (Cato Institute, 2020).
[27] “Student-based Allocation: Doling Out Dollars Based on Student Needs,” (Edunomics Lab, Georgetown University, 2022), https://perma.cc/AM6K-5CNU.
[28] Author's calculations based on 2020-21 National Public Education Financial Survey data.
[29] Ben DeGrow, “How School Funding Works in Michigan: The Foundation Allowance” (Mackinac Center for Public Policy, July 19, 2017), https://perma.cc/XV39-CUUL.
[30] MCL § 388.1606(4)(i),(x).
[31] "Summary: Executive Budget Recommendation for Fiscal Year 2018-19" (Michigan House Fiscal Agency, Feb. 15, 2018), https://perma.cc/8LZG-8QEC; "Summary: Executive Budget Recommendation for Fiscal Year 2022-23" (Michigan House Fiscal Agency, Feb. 2, 2022), https://perma.cc/4GLB-7PMS.
[32] MCL § 206.51(2). See also "Distribution and Earmarking of Michigan's Major State Taxes" (Michigan Senate Fiscal Agency, May 2020), https://perma.cc/PN9A-ZCM7.
[33] “Student Opportunity Scholarship, S.B. 687 (S-1) & 688 (S-1): Summary as Passed by the Senate” (Michigan Senate Fiscal Agency, Oct. 25, 2021), https://perma.cc/67AP-AWUG.
[34] Jason Bedrick, Jonathan Butcher and Clint Bolick, “Taking Credit for Education: How to Fund Education Savings Accounts through Tax Credits” (Cato Institute, Jan. 20, 2016), https://perma.cc/V8LK-T2CS.
[35] “Student Opportunity Scholarship, S.B. 687 (S-1) & 688 (S-1): Summary as Passed by the Senate” (Michigan Senate Fiscal Agency, Oct. 25, 2021), 8, https://perma.cc/67AP-AWUG.