Click here to view the PDF of the full study.
This year marks the 10th anniversary of Michigan’s tourism promotion campaign known as Pure Michigan. It was in May of 2006 when the first taxpayer-funded commercials ran featuring voiceovers by popular Michigan actor Tim Allen. Similar commercials hit national media in 2009. Over that time, the state has spent $261 million on efforts to promote the Michigan “brand” and make the state a travel destination.
No matter the popularity of these types of programs, taxpayers and policymakers should ask how effective this spending is. This money could potentially be put to more effective use that would generate better economic returns for state residents, such as for improved roads, public infrastructure or even an across-the-board reduction in Michigan’s personal income tax. The aim of this study is to assess the effectiveness of state-funded tourism promotion.
This year marks the 10th anniversary of Michigan’s tourism promotion campaign known as Pure Michigan. It was in May of 2006 when the first taxpayer-funded commercials ran featuring voiceovers by popular Michigan actor Tim Allen.[*] Similar commercials hit national media in 2009.[†] Over that time, the state has spent $261 million on efforts to promote the Michigan “brand” and make the state a travel destination.
No matter the popularity of these types of programs, taxpayers and policymakers should ask how effective this spending is. This money could potentially be put to more effective use that would generate better economic returns for state residents, such as for improved roads, public infrastructure or even an across-the-board reduction in Michigan’s personal income tax. The aim of this study is to assess the effectiveness of state-funded tourism promotion.
This type of analysis is necessary because the state’s effort to measure the impact of the Pure Michigan program is inadequate. Each year the Michigan Economic Development Corporation, the state’s main economic development operative, contracts with a company to produce a report analyzing the economic returns of its taxpayer-funded tourism promotion effort. And each year, this company reports an enormous “return on investment” from this spending. But there are several reasons to view these findings with skepticism.
The MEDC has an incentive to puff up its claims of success. The very survival of the department — and the jobs of its employees — relies on the appearance that its efforts create more employment and wealth for Michigan residents. In fact, when determining which firm to hire to conduct annanalysis of its tourism promotion program, MEDC correspondence indicates that department officials purposely sought out a firm that would help justify spending on tourism promotion.
To generate a return on investment figure for its tourism promotion program, the MEDC uses Longwoods International. The MEDC has hired this company for several consecutive years on a no-bid basis. Longwoods’ analysis of the 2015 Pure Michigan advertising campaign claims that for every $1 invested in out-of-state advertising, the state collects $7.67 in new taxes. This is up from a $6.87 return for the 2014 campaign. In fact, the ROI for Pure Michigan spending, according to Longwoods, has steadily increased for nine consecutive years, growing from $2.11 in 2006 to $7.67 in 2015, a 264 percent increase.[‡] It’s as if there’s no limit to the investment return of state-funded tourism advertising.
Unfortunately, the work that Longwoods does for the state is not subject to any type of review or third-party validation, largely because Longwoods maintains that its method for deriving these
[*]Emily Guerrant, Michigan Economic Development Corporation, email correspondence with Michael LaFaive, Mackinac Center for Public Policy, Nov. 29, 2015.
[†]For an example, see: “A Simple Sunrise” at https://goo.gl
[‡]“Michigan 2015 Tourism Advertising Evaluation and Image Study” (Longwoods International, April 2016), 60, https://perma.cc
The state of Michigan has created numerous economic development programs and departments over the last several decades. The Great Lake State’s modern era of taxpayer-funded efforts to protect existing jobs and create new ones can be traced back at least as far as Governor Kim Sigler in the 1940s.[1] This study attempts to measure the economic impact of just one of these programs: state-funded tourism promotion.
This analysis uses national data and employs a statistical model whose design was informed by a review of existing academic literature on the subject. It also examines the state of Michigan’s effort, through the Michigan Economic Development Corporation, to measure the success of its tourism promotional program. Finally, this report concludes with recommendations for reform based on these analyses.
Michigan operates a department dedicated to promoting tourism called Travel Michigan, whose mission is to promote the state as a travel destination, among other duties.[2] The office was named in 1997, but the existence of a state travel promotion arm can be traced as far back as 1945 when it was called the “Travel Bureau.”[3] Today the MEDC promotes the state in part by running tourism advertising campaigns inside and outside of Michigan. In the past 10 years more than $261 million has been appropriated for the cause.[4]
State-funded tourism promotion often uses a slogan or tagline to distinguish itself. For instance, during Gov. James Blanchard tenure (1983-1991), Michigan’s promotional campaign was called “Say Yes to Michigan!”[5] Today’s tourism promotion efforts can be traced back to Gov. Jennifer Granholm in 2005 and is known as “Pure Michigan.”[6] This campaign has been continued and expanded under current Gov. Rick Snyder.[7] In fiscal year 2016, $33 million was appropriated for Pure Michigan, and this at the time was the second largest appropriation for this purpose to date — although, Michigan’s tourism industry has called for even larger amounts.[*]
Michigan has dramatically increased its use of taxpayer-funded tourism promotion over the last decade. In 2003, the state spent only $0.82 per capita.[8] For 2016, that figure was $3.43, a whopping 318 percent increase.[9] The same trend is found via a different measure: a ratio of tourism promotion spending to state personal income. In 2003, the state spent three-tenths of a penny ($0.003) per dollar of personal income on tourism promotion spending, but by 2015 this had more than doubled to seven-tenths of a penny ($0.007) per dollar of personal income.[10]Michigan is not the only state in the union to adopt tourism promotion subsidies as part of an overall economic development strategy — most states routinely appropriate money for tourism promotion and most have done so for many years.[11] This study takes advantage of this fact and uses data from all 48 states from 1973 through 2012 to analyze the impact of taxpayer-funded tourism promotion on states’ tourism industries.[†]
[*]The largest appropriation ($33,217,500) to date in 2016 came in FY 2009 and came from appropriations from the state’s general fund ($5,717,500) and from 21st Century Jobs Fund revenues ($27,500,000). Ben Gielczyk, “Pure Michigan Tourism Marketing Campaign”
(Michigan House Fiscal Agency, Oct. 29, 2015), https://perma.cc
[†]Hawaii and Alaska spend taxpayer resources on promoting tourism but are not included in our calculations due to the fact that they are not contiguous to the continental United States.
The fact that the MEDC is in charge of assessing the effectiveness of Pure Michigan is problematic because the MEDC is also the government agency that funds tourism promotion programs. It is clearly in its best interest to show a positive return on investment of their funding decisions. If this assessment did not show a positive return on investment, the MEDC’s funding stream for tourism promotion would be questioned, reduced or eliminated, which would threaten the size of the MEDC’s budget. While this arrangement by itself does not preclude the state from effectively analyzing the impact of its tourism promotion spending, it does require that any analysis under this arrangement be done in an open and transparent way and that any results be treated with an extra level of scrutiny.
The MEDC has for years hired Canada-headquartered consultant Longwoods International to perform return on investment calculations for its Pure Michigan program. Longwoods has been hired at least six times according to reports listed on the MEDC’s website.[12] The total amount spent on these Longwoods reports is about $1 million.[13]
There is evidence to suggest that this incentive problem did have an impact on the MEDC’s decision to award a no-bid contract to Longwoods International. In explaining why it awarded a no-bid contract to Longwoods, the MEDC wrote: “The objective of this contract is to prove that the benefits for conducting a paid advertising program for tourism out weight [sic] the costs.”[14]
Additionally, the MEDC also stated in justifying its no-bid contract with Longwoods that the study they would be paying for “can demonstrate not only the success of the program, but prove that the investment of state funds provides a higher rate of return on tax dollars than the investment costs.”[15] In other words, MEDC officials sought out a consultant who would produce the findings they wanted — specifically, that their tourism promotion spending had a positive return on investment and was, therefore, a justified use of taxpayer resources.
Since the MEDC’s aim was to secure a positive result from a study of Pure Michigan’s effectiveness, selecting Longwoods appears to have been the correct choice. This firm has been hired by many different states over the last decade or more and have produced similar results — all positive or neutral returns on investment — no matter what tourism promotion program they study. Below is a table of some of the findings from other Longwoods studies.[*]
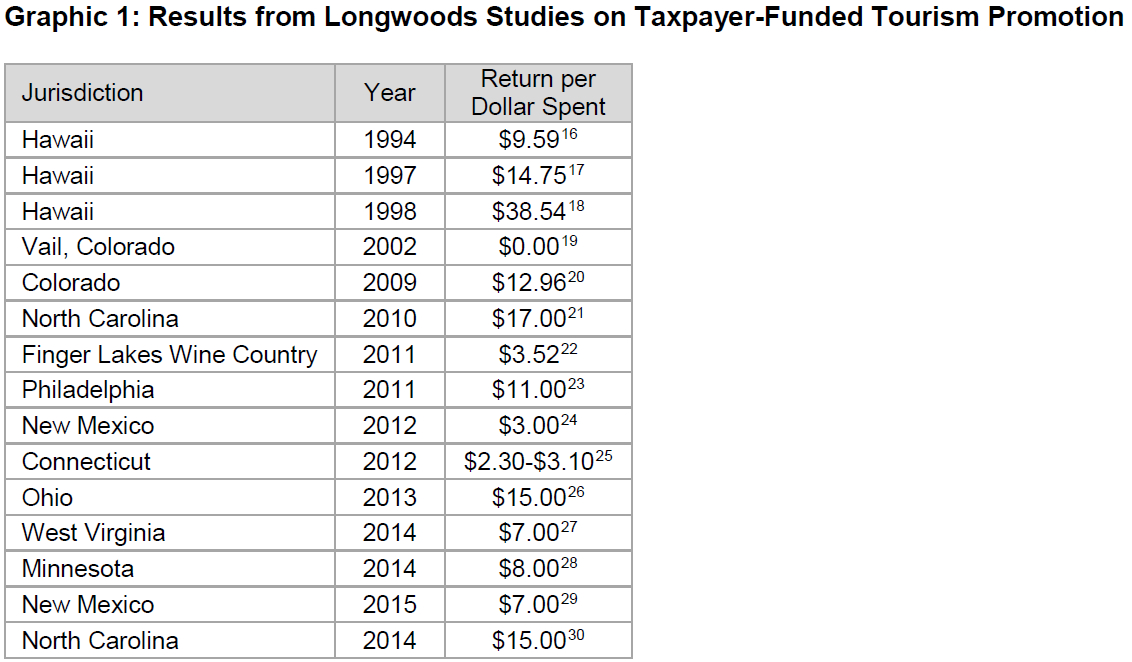
The incentive problem also runs the other way: As it has become the go-to source for governments to provide evidence for their spending on tourism promotion, Longwoods has an incentive to ensure that their results please the agencies paying the bill. A negative return on investment might undermine the ability of state agencies to receive funding for tourism promotion, which would mean Longwoods would have fewer potential clients. It would be harder for Travel Michigan or other tourism offices to engage in “budget justification” if their own consultants demonstrate a failure to produce positive returns, and consultants know that.
One observer, cited in an academic paper on this subject, noted that economic impact experts hired to provide analyses “are in truth the exact equivalent of an expert witness in a lawsuit who comes to testify in support of the side that is paying the expert’s bill. An expert whose testimony harms his employer’s case doesn’t get much repeat business.”[31]
To produce a calculation of the positive return on investment of state-funded tourism promotion, Longwoods uses a tool it developed called “R.O.EYE,” a play on the common investment acronym for return on investment. Using this methodology, Longwoods estimated in the 2016 report, “Michigan 2015 Tourism Advertising Evaluation and Image Study,” that Pure Michigan’s out-ofstate advertising campaign generated $7.67 in revenue to state coffers for every $1.00 spent, an astonishing 667 percent return in just one year.[32] Longwoods refuses to explicitly demonstrate how it obtains its return on investment figures, claiming their method is proprietary and leaving taxpayers and policymakers with a methodological “black box.”
Scientific studies assert to test a hypothesis, detail the methodology used to test this hypothesis, identify required assumptions and shortcomings and list all data sources. This method produces results that can be replicated and reviewed by others. Outcomes that are replicated by third parties are more robust than those that are generated by just one party (especially considering the interests one party may have in producing a particular outcome). Unfortunately, Longwoods’ reports fail to meet these common scientific standards, because they do not fully disclose their methodology or sources, making replication impossible.
Longwoods’ report on the impact of spending on Pure Michigan’s 2015 tourism promotion campaign only discloses the following information about its methodology: 1) It uses an online survey of a representative sample of American adult travelers; 2) The survey asks 4,000 participants about their opinion of Michigan as a place to vacation, their history of vacationing in Michigan and whether they are familiar with Pure Michigan’s advertisements; 3) Its trademarked R.O.EYE model deploys an experimental design and estimates how many more people vacationed in Michigan because of the Pure Michigan ads.[33]
To its credit, Longwoods International has provided additional information when asked, such as the company’s treatment of “response bias” and the source of certain data used to derive its calculations. And Bill Siegel of Longwoods has always graciously fielded questions from author LaFaive. But an explicit derivation of the math behind the return on investment claims has never been provided, as Longwoods maintains its methodology is proprietary, and thus not open to public scrutiny, even though it is used explicitly to guide public policy decision making.
Although there are many research journals devoted to the topic of tourism, there are relatively few published articles that assess the impact of state-funded tourism promotion.[*]
And of the 25 academic papers and three book chapters reviewed in preparation for this paper, only one stands out for its recent focus on multistate subsidies to promote tourism.[34]
That paper was published in the Journal of Travel Research and authored by John Deskins and Matthew T. Seevers. In it, they also recognized the dearth of literature on the subject of statespecific subsidies for tourism promotion.[†] In their review of the existing literature, they found only two studies that covered more than one American state.
The first, a 1979 paper from the Council of State Governments, “concluded that the size of a state’s travel budget predicts neither traveler expenditures nor tax collections in the state,” according to Deskin and Seevers.[35] The second, published in 1990 and authored by John Hunt found that from 1981 to 1986, “correlations between budgets and tourist expenditures remain low.”[36] Deskin and Seevers do note, however, that Hunt also examined links between tourism budget growth “and market share of tourism expenditures” and found a positive relationship. That is, there was a correlation between larger state spending on tourism and the share of tourismrelated expenditures in a state.[37]
In their paper, Deskins and Seevers investigate the extent to which state-funded tourism promotion impacts economic growth as measured by gross state product and growth in employment. They employ regression analysis using a dataset that runs between 1985 and 2003 and find the impact from increases in state tourism spending “depends on the existing level of tourism expenditures in the state.”[38] The authors conclude that for states with relatively low levels of tourism, state-funded tourism promotion may increase employment and tourism. But, they also find “that effect diminishes as initial levels of tourism expenditures increase.” For states that have relatively high levels of tourism, Deskins and Seevers found that “employment can decline following increased [state-funded tourism promotion] through own-source (state-based) revenues.”[39]
The state of Michigan from 1985 to 2003 spent slightly less than other states on tourism promotion, suggesting that an increase in spending may have a net positive impact on employment growth. Deskin and Seevers, however, failed to find a statistically significant relationship between spending on tourism promotion and state GSP growth.[40] So, even if increasing tourism promotion spending increases private sector employment, the economic gains of this job growth do not appear to boost gross state product — a standard measure of the overall well-being of a state economy.
They write:
Overall, we find that increased tourism promotion spending can increase total private-sector employment in states with low levels of initial tourism expenditures, but this does not carry through to a statistically significant, corresponding relationship between tourism promotion spending and privatesector gross state product growth. Although we do not test the hypothesis explicitly, the findings seems to indicate that the modest employment gains that may be observed are likely low-paying jobs, such that the corresponding income gains are not significant enough to translate into a statistically reliable observed increase in gross state product.[‡]
There are other academic papers that analyze state subsidies for tourism promotion, but most touched more tangentially on the issue, addressing topics such as theoretical modeling, practical issues among free-riders, online marketing, literature reviews in “tourism demand modelling and forecasting,” and other more general tourism-related issues.
A few academic studies did actually attempt to estimate employment or the return on investment from state subsidies to tourism or tourism promotion through advertising. Those, however, involved other countries, such as Italy and Australia, and the results were mixed. In “Is Subsidising Tourism Firms an Effective Use of Public Funds?” the authors looked at 3,800 tourism projects in Italy subsidized by nearly €2 billion in grants and conclude that the results of their analysis “demonstrate, in fact, that in the short term, the policy increases employment in subsidized firms, but the effects on labour productivity are negative, casting some doubts on long-term profitability.”[§]
In a 2009 Journal of Travel Research paper “Measuring the Return from Australian Tourism Marketing Expenditure,” authors Nada Kulendran and Larry Dwyer calculate return per dollar invested for international tourism ads. The dollar results are striking, with ratios as high as 36 to one for New Zealand and as low as seven to one for ads run in the United States.[41] In a similar 2010 study “Measuring the Returns on Hong Kong’s Tourism Marketing Expenditures,” the authors found ratios running from as high as 9.5 to one to as low as 2.5 to one.[42]
These represent positive returns in terms of dollars invested and dollars received, however, both papers show very low returns on new tourist arrivals resulting from the marketing. In their review of these papers Haiyan Song, Larry Dwyer, Gang Li and Zheng Cao write that “the magnitude of the effect of marketing expenditures has been found to be as low as several hundredths.”[**] That is, government marketing expenditures did little to boost new arrivals. The reason there remains a high return on market dollars expended though, is because “on average, every tourist spends up to several thousand (Australia, Hong Kong) dollars.”[43]
[*]Scholar Chris Ryan, writing in a 2005 Tourism Management article, ranked the top three tourism-related journals as Annals of Tourism
Research, Tourism Management and Journal of Travel Research. He did this by accessing a database of research from CAB International
and recording their “top journals based on frequency of hits in searches.” Chris Ryan, “The Ranking and Rating of Academics and Journals
in Tourism Research,” Tourism Management 26 (2005): 658, https://perma.cc
[†]There are more papers that cover tourism marketing and returns on investment, but those involve other nations, such as the islands of Hong Kong and Australia. See for example, Hanquin Qiu Zhang, Nada Kulendran and Haiyan Song, “Measuring Returns on Hong Kong’s
Tourism Marketing Expenditure,” Tourism Economics 16, no. 4 (2010): 853, https://perma.cc
[‡]John Deskins and Matthew Seevers, “Are State Expenditures to Promote Tourism Effective,” Journal of Travel Research 50, no. 2 (2011): 166, https://perma.cc
[§]This study is a project-specific one in Europe and perhaps of limited applicability in the case of state-sponsored tourism promotion. We include it here for two reasons. It is an interesting study worthy of review for those interested in the subject, and as a function of
thoroughness. Despite being only obliquely related to state tourism promotion in these United States we nonetheless wish to be thorough in
our review of existing literature involving government subsidies and tourism. Cristina Bernini and Guido Pellegrini, “Is Subsidising Tourism
Firms an Effective Use of Public Funds,” Tourism Management 35 (2013): 156–167, https://perma.cc
[**]Haiyan Song et al., “Tourism Economics Research: A Review and Assessment,” Annals of Tourism Research 39, no. 3 (July 2012): 4, https://perma.cc
Pure Michigan’s award-winning commercials have proven themselves extremely popular with the Michigan public. That the commercials are popular, however, does not make them effective in helping grow the state’s economy. In part because the MEDC has failed to provide transparent, and thus, valuable estimates of the impact of spending on tourism promotion, this study attempts to evaluate this question. A brief description of the methodology is provided below and an appendix to this text contains a full explanation of the model used in this analysis.
Publicly available data from the U.S. Census Bureau, U.S. Department of Labor and the U.S. Travel Association for all of the contiguous 48 states from 1973 to 2012 was used. A statistical analysis of these data estimates the economic impact of both the level and growth of state-funded tourism promotion spending on gross state product and income in three tourism-related sectors: hotels and accommodations, amusements and recreation and arts and entertainment. These sectors were chosen because they are the most likely to be directly impacted in a measurable way by state tourism promotion spending. Importantly, since tourism-related spending is a broad suite of economic activity including such diverse products as fishing bait, museum admissions and airline tickets, it is impossible to measure every possible component. So, in this analysis, choosing those items most likely to be impacted offers a glimpse in to the magnitude of the overall impact.
The following is the equation employed to measure the impact of state promotion efforts:
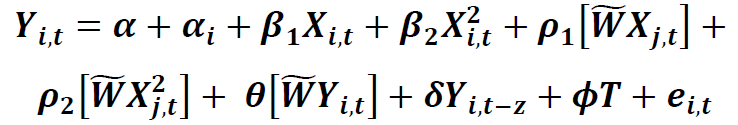
The Y symbol and related subscripts represent the value of incomes or GSP by (i) state and (t) year. The letter X on the right side of the equation represents inflation-adjusted, state-funded tourism promotion spending. Other terms involve statistical weights that measure the role of state tourism activity and state-funded tourism spending in adjacent regions as well as fixed effects, which capture those aspects of each state that impact tourism activity and that are largely unchanging over time, such as the length of Michigan’s coastline or California’s sunshine.
As a consequence, this model controls for such things as state tourism promotion spending, average tourism promotion spending in nearby states and previous years’ income in each sector analyzed. The analysis also includes a battery of tests for statistical significance and other statistical tests for determining whether or not there might be statistical factors that were unaccounted for in this model (such as large changes to tourism spending in other states).
A detailed explanation of the model and the rationale for its many parts may be found in the section titled in “Appendix: An Estimation Strategy of State Tourism Spending Impacts.”
[*]Some text below was taken from work previously published in December 2015 by the Mackinac Center for Public Policy. Michael LaFaive, “MEDC’s Pure Michigan Puffery” (Mackinac Center for Public Policy, Dec. 3, 2015), https://perma.cc
State government spending on tourism — including Michigan’s popular “Pure Michigan” campaign — do not, on average, boost gross state product or income in a meaningful way in any of the three sectors examined in this analysis: hotel and accommodations, amusement and recreation and arts and entertainment. While the model did show that state tourism promotion produced a statistically significant gross positive result in two industries, the benefits were tiny and outweighed by the costs to the state economy as a whole.
One positive finding was that for every $1 million increase in state tourism promotion spending in the average state there was a corresponding $20,000 increase in revenue for the accommodations industry. The accommodations industry includes businesses that provide overnight stays such as hotels, motels and bed-and-breakfast lodging on a short-term basis.[*] The model found no improvement in the incomes of accommodations employees.
To put this result into perspective, consider that the Pure Michigan advertising campaign received an increase of $4 million from 2015 to 2016. Based on the model’s results of the average effect of state-funded tourism promotion from the 48 contiguous states, that $4 million would translate into an additional $80,000 in new income for all businesses in Michigan’s accommodations industry. Another way of thinking about this statistically significant result is that it is a negative 98 percent “return on investment.” In other words, for each dollar states “invest” in tourism promotion, they lose 98 cents and are left with only 2 cents of value.
These statistical findings are based on a national average. The Michigan-specific results were not statistically different from these. Some states, however, did stick out from the crowd. In separate estimates for one of the two statistically meaningful variables (accommodations income) only Mississippi, Idaho, Washington, Maryland and Nevada showed that they were both statistically significant and different from the average results. This means that all other states experienced a similar state tourism spending effect to the national average or this factor had no measurable impact in these states.
Only these five states had statistically larger and more meaningful impacts than the other states in our model. In these states, the impact of a $1 million state tourism spending produced as much as a $300,000 increase in hotel and accommodations GSP, but this is still far below a level of efficacy.
Other findings from this analysis include:
[*]Specifically, the “elasticity” of state tourism spending to hotel and accommodation gross state product (the value of accommodation
product) was a puny 0.2. Elasticity is a method for measuring the sensitivity to one item relative to a change in another. In other words, an
elasticity of 0.2 means that a $1,000,000 increase in state tourism spending in the average state would result in just $20,000 more in
spending on the accommodations industry. “Regional Economic Accounts” (Bureau of Economic Analysis), https://perma.cc
[†]We were unable to examine state tourism promotion spending on arts and entertainment GSP due to changes in federal data collection methods. The United States government switched its coding of National Income Accounts from Standard Industrial Classification to the North American Industrial Classification System. When the change was made the category for arts was compiled from several sectors, making consistent measurements difficult. National Income Accounts is simply the accounting mechanism through which the federal government records economic activities. The SIC system was born in the 1930s and coded industries by a four digit number — from metal mining to financial services. The NAICS codes replaced and updated SIC codes and were implemented in 1997 in the United States.
This study suggests that state tourism promotion efforts come up short as a development tool, at least as measured by their impact on the hotel and accommodations, amusement and recreation and arts and entertainment industries. While government tourism promotion does show some positive impacts, it appears, on average, to be a net negative for taxpayers in Michigan and elsewhere.
Based on these findings, Michigan policymakers should conduct a meaningful performance and impact study of the current Pure Michigan campaign. The results from the statistical analysis presented in this report casts significant doubts on whether spending on Pure Michigan is economically beneficial for the state. In addition, the MEDC has too much incentive to game the results of the studies it currently purchases to justify this spending.[*] In other words, taxpayers shouldn’t have to spend another dime promoting the tourism industry until the state can prove through a neutral, robust and independent analysis that these investments are justified.
In order to produce such an impact study, policymakers must use a competitive bidding process for the project. No-bid contracts to consultants whose study methodology is secret and who always produced positive results that benefit the agency paying for it should raise red flags. This means that the MEDC should not be in charge of funding or producing a study on the economic effectiveness of the Pure Michigan program. Another department, such as the Office of the Auditor General, should be tasked for this purpose.
Policymakers should also mandate that any economic impact or return on investment study of spending on tourism promotion contain an “opportunity cost” component. There are direct tradeoffs associated with spending taxpayer money on tourism promotion. In order for this spending to be effective, it must return more money to state and local treasuries or more benefits to taxpayers than spending that same amount of money on other programs would.
On this subject, John L. Crompton writes:
Opportunity costs are the benefits that would be forthcoming if the public resources committed to a tourism project were (1) redirected to other public services or (2) retained by the taxpayer. Government investment in tourism projects and programs will have an economic impact, but the key question is, compared to what? Does government spending on tourism stimulate the economy more than other kinds of investment? “In other words, is it better than paying a crew to dig a hole and fill it back up again (which might have fewer negative social and environmental impacts than the new [tourism project]?” (quoting Dittmar, 1999)
...
Conceptually, for an investment of public money to be justified, it must meet the criterion of highest and best use. That is, it should yield a return to residents that is at least equal to that which could be obtained from other ventures in which the government entity could invest. The issue of opportunity costs is the fundamental social issue associated with government investment in tourism. The key question is not whether an investment in tourism is likely to have a positive economic impact. Rather, it is whether more benefits would be generated from any number of alternative government expenditures, such as investment in a local college, public schools, transportation infrastructure, health programs or incentives to attract other kinds of businesses to locate in the community.
Thus, a positive economic impact does not mean that a tourism project or program should be supported, because the opportunity cost associated with this investment may be unacceptably high.[44]
[*]Other state-funded studies of state-funded economic development efforts done by consultants have fallen apart upon close examination, suggesting skepticism of the studies the MEDC pays for to justify the Pure Michigan spending program is warranted. For examples, see: Diane Katz, “Should the State Boost Broadband?” (Mackinac Center for Public Policy, Jan. 29, 2002), https://perma.cc
Michigan’s most recent state-funded tourism promotion effort, known as “Pure Michigan,” has been running commercials in an attempt to attract visitors for more than 10 years. These advertisements have won numerous awards and are popular with much of the public. But their popularity does not make them automatically successful from an economic perspective.
The rationale for spending taxpayer dollars on promoting tourism in Michigan is for economic development. The idea is that if the state spends money to advertise itself, more tourists will come to Michigan and the state economy will grow. The government will also benefit from capturing more tax revenues from an increase in business activity and jobs.
This study attempts to analyze whether or not this spending actually does boost economic activity in the hotel and accommodation, amusement and recreation, and arts and entertainment industries. It uses a large, national statistical model with more than three decades of data from 48 states in an attempt to measure the effectiveness of state-funded tourism promotion campaigns, such as Pure Michigan. The statistical model attempts to measure the impact of tourism promotion spending over time on gross state product and income for these three industries, all while controlling for many factors that might impact these sectors of the economy.
The results in arguably the most sensitive area of tourism-related businesses is the impact on the accommodations industry, such as hotels and motels. The model found a statistically significant, gross positive impact, but it was very small on average. For every additional $1 million spent on tourism promotion about $20,000 in extra income was generated for the hotel and motel industry. While this was a national model, Michigan was not any different from the average. Maryland, Mississippi and Nevada had large and statistically meaningful returns — one as large as $300,000 for every additional $1,000,000 spent. Even with this large return, however, it — like the national average — represents a large net negative return.
The Michigan Economic Development Corporation believes that Pure Michigan has been a raging success. The MEDC has claimed in 2016 that Pure Michigan’s out-of-state advertising campaign in 2015 generated a 667 percent return on investment. That is, for every $1 spent on the advertising campaign, $7.67 was returned in the form of additional tax income for the state.
But its evidence comes from a report produced by a consultant, Longwoods International, whom they selected on a no-bid basis to provide analysis for their program’s success. Internal documents from the MEDC make it clear that it expected to get positive results from this report. Longwoods International refuses to provide a transparent explanation for how it derives these return on investment calculations. The method, they report, is proprietary.
This is disturbing for a number of reasons. What the MEDC and their consultant are effectively saying is, “trust us, we know we’re right and we know what is good for Michigan.” Given the incentives that the MEDC faces to present itself as a public success and for consultants to retain generous clients, it is not unfair to question these claims and be highly skeptical of them.
State lawmakers should put the Pure Michigan spending program on pause until validated evidence is secured demonstrating that spending taxpayer money on promoting the tourism industry yields positive economic returns for the public. That means a new study and perhaps a new methodology from a consultant chosen from several who openly compete for the work. The bidding process should be managed by a more independent organization, such as the Auditor General of Michigan. The study in question may wish to also discuss the opportunity cost of running the program. Might Pure Michigan dollars be better spent elsewhere?
An analysis of taxpayer support for tourism promotion spending requires an econometric strategy with three objectives. The empirical model should capture the impact on tourism-related industries (here hotels and accommodations, amusement and recreation and arts and entertainment). This estimation should allow for the potential for nonlinear effects. Second, the model should permit estimation of the cross-border effects of tourism spending. Finally, the model should account for trend dynamics and spatial interactions that, if omitted, might bias the estimates of the impact of state spending on tourism promotion.
The approach used here calls for impacts estimated in a simple model that account for the magnitude of state spending on tourism promotion, temporal correlation and spatial correlation. It also controls for effects within each state that are invariant during the observed period, so-called fixed effects. This type of model is often referred to as a spatial Durbin model in that the specification incorporates the spatial and time autocorrelation features.45 This specification takes the form:

Y is the value of output or income (aggregate or disaggregated by industry, in either levels per capita or growth rates) in state i, in year t across the lower 48 conterminous states. The coefficient a is a common or fixed-effect intercept; X is real state tourism spending in state i, in year t; and, χ2i,t its squared value. This and the dependent variable is weighted in state j by the spatial weights matrix W̃, which is the first order contiguity matrix of states. The coefficient on this variable is ρ. The mxz space-recursive vector is denoted by θ, and δ is the usual temporal autoregressive coefficient, the optimal lags of which were selected by minimization of the Akaike Information Criterion.46 The disturbance term e, is considered to be iid×N(Ο,σ2).
In practice then the spatial component W̃Xj,t will be the mean value of the dependent variable in the contiguous counties in each state in the current time period t. The space-recursive vector is this variable in z lags.[*] We also include a time trend θΤ specifically to account for changes in household consumption pattern over the sample period. For example, real personal consumption expenditures on amusement parks more than doubled in per capita terms during the sample period.[47]
For some specifications the dependent variables are demeaned in a process outlined in a 2005 paper by Pesaran to remove spatial heterogeneity which might not be captured in the spatial Durbin model.[48] This is a cautionary step which will be applied to some of the estimates of tourism in levels. This step is motivated by the common fact that we do not know the source of spatial influence across states.
State government support for tourism expressed in direct marketing and support for development projects also offers some endogeneity concerns. States with a larger tourism sector might face stronger lobby efforts to engage in tourism promotion spending. This is not likely a large concern given that every state in our sample has, at some time, engaged in tourism spending. Nevertheless, the model employs two methods to address this concern. The first substitutes the per capita measures of tourism-related economic activity to growth rates. The second identifies what accounts for the likelihood that existing natural features in each state may influence support for state-funded, tourism-related development. To do this, the model estimates the relationship between state tourism spending in each state and the elevation span (distance between the tallest and lowest geographic point in each state). This offers the following relationship:
Χi,t = α + ψi + ei,t (Equation 2)
Χi,t — ei,t is the adjusted value of state tourism is related spending in each year t, in each state i.
The selection of an appropriate pooled econometric model is subject to ongoing debate.[49] The chief concerns are the choice of using fixed effects or random effects. There is also some concern that fixed-effect estimates may not be compatible with spatial analysis. A spatial Durbin model, however, offers a method for analyzing spatial impacts in a fixed-effect setting.[50] This is the strategy employed in this model, though it might limit the ability to directly extend this analysis, such as interacting tourism spending with the presence of a statewide hotel tax. Since there are other estimation procedures for use in such a setting, this is not likely to seriously limit the extension of this research.
Incomes in each of the affected sectors represent a good choice for policy considerations related to state tourism promotion spending. The impact of state tourism spending on sectional, tourismrelated economic activity can be deduced from these. This will be followed by tests that evaluate the sectorial adjustment within the counties where data permits. These disaggregated tests, however, are limited due to the lack of available data, specifically in rural counties.
These data are collected from the Bureau of Economic Analysis Regional Economic Information System. Data from state tourism promotion spending are reported in Graphic 2.
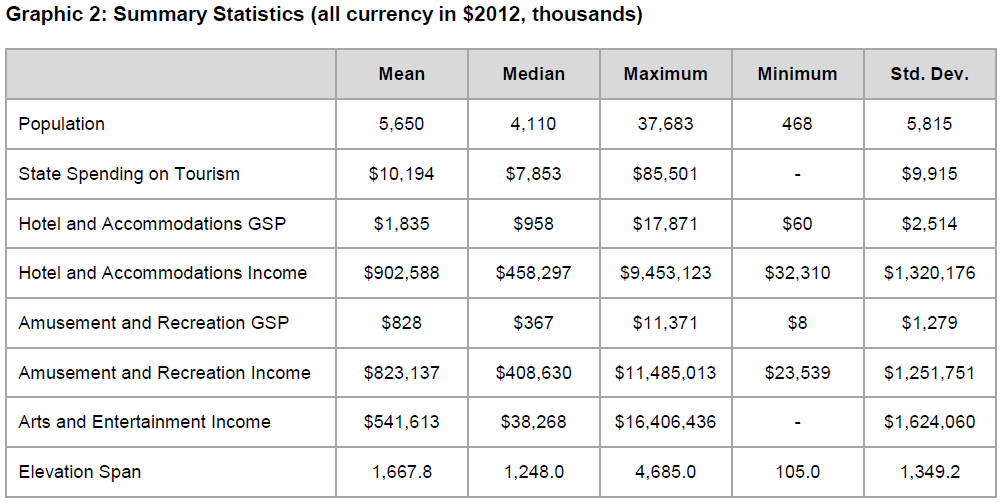
The model was populated with these data and analyzed with Equation 1 for hotel income, amusement and recreation income, and arts and entertainment income separately, since each of these sectors represent the core of tourism-related economic activity. While other sectors benefit from tourism activity, such as agriculture, travel services, retail sale of petroleum products, these are likely to be far more diffusely impacted by tourism spending than sectors that are directly influenced by visitor spending. In that sense, this analysis cannot be a complete benefit-cost analysis of state tourism spending which might require a general equilibrium modeling approach.[†]
The availability of data offer some opportunities and limitations. By employing both state GSP and personal incomes by sector during the observation period, the aggregate effects of tourism GSP can be isolated and analyzed as to whether those effects are transmitted to other inputs, such as labor, rent and proprietors’ income in these sectors. Ideally, capital, rents and profitability in these sectors, by state, would be estimated, but those data are unavailable. Also, national income accounts from the Standard Industrial Classification to North American Industrial Classification System were modified during the period of study. This reclassification imposed little change on hotel and accommodations and amusement and recreation data, but did impact the availability of arts and entertainment data. A NAICS binary variable to control for this accounting change was included, but GSP-to-income comparison for the arts and entertainment sector was not made, because this seems to be the most problematic of nonfarm transitions to NAICS.
Graphic 3 below reports results from estimates from the hotel and accommodations sector. Standard errors have been treated with White’s heteroskedasticity invariant, variance-covariance matrix.[51] The major effects in levels (with Pesaran adjustments), growth rates and growth rates adjusted for endogeneity are reported, as are interpretation of the results and estimates on the impact of state-funded tourism promotion spending on hotels and accommodations.[52] The asterisks mark the level of statistical significance for these figures, using the standard designation.
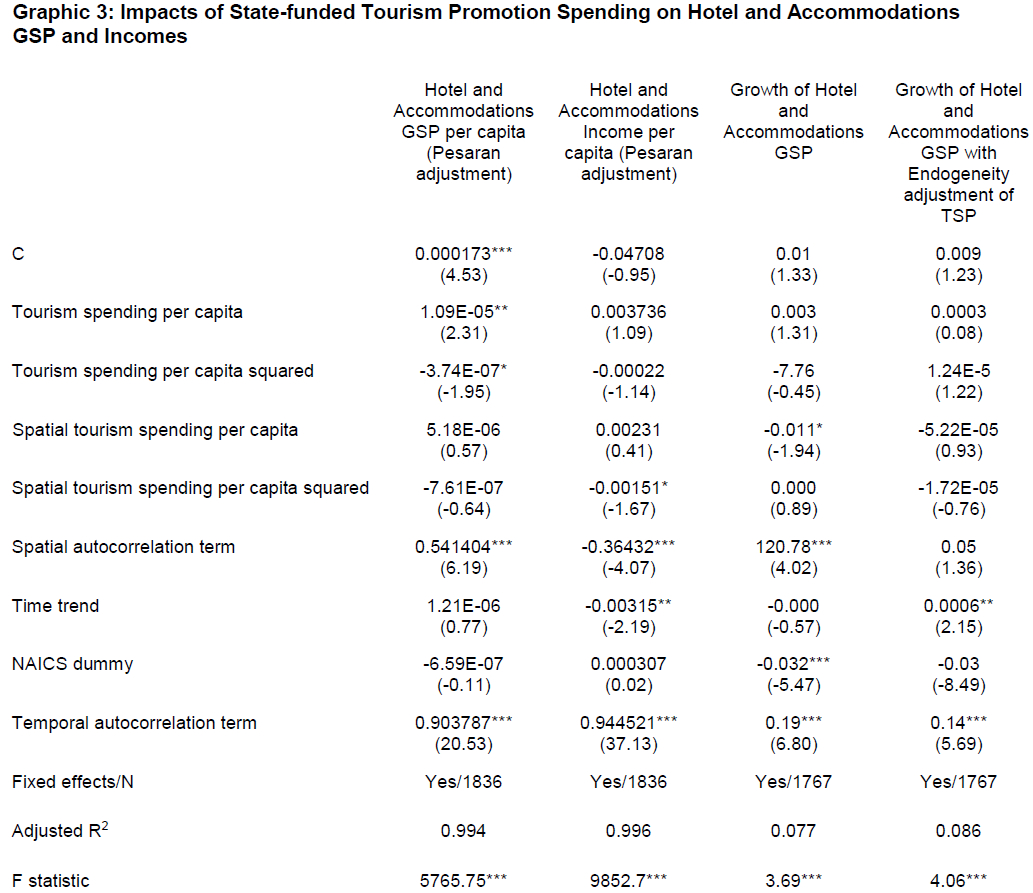
In general, the overall results of these models are the most informative. State-funded tourism promotion spending in neighboring states is largely not a factor in hotel and accommodations income nor GSP, as evidenced by the weak statistical significance of the spatial tourism spending coefficients. This holds for the nonlinear term (squared value), though in incomes it does become modestly statistically significant. The spatial and temporal autocorrelation terms are both statistically meaningful and offer reasonable magnitude and signs to hotel and accommodations GSP and incomes in each state.
The direct assessment of the GSP and income impact of state-funded tourism promotion spending finds that it boosts GSP in hotels and accommodations. This suggests that this model is sufficiently sensitive to detect impacts of this spending. However, the magnitude of the effect is small, with an elasticity of hotel and accommodation GSP to state tourism spending of roughly 0.02. To place this in context, the estimates indicate that a $1 million increase in state-funded tourism promotion spending in the average state during this period would have resulted in about a $20,000 increase in GSP in the hotels and accommodations industry. The data do not clearly specify the type of spending in a way that allow us to evaluate the elasticity of advertising or programmatic analysis, but it is clear that in aggregate, state-funded tourism promotion has a very small impact upon hotel and accommodation GSP, which is an important component of the overall tourism industry.
The two models analyzing growth rates yield no evidence that state-funded tourism promotion is influencing GSP growth in hotels or accommodations. This result holds when corrected for endogeneity, as described above.
Of interest also is the divergent results from GSP and personal incomes. While there is a very small impact of state-funded tourism promotion on GSP, there is no impact on hotel and accommodations income. So, the GSP growth generated by tourism promotion does not transmit to labor earnings through higher wages and salaries for hotel and accommodations employees. As previously noted, data are not available to more precisely estimate which factors of production (profit, interest or rent) these GSP increases flow to, but it appears that they do not accrue to labor.
This examination of hotel and accommodation sector GSP and income suggests a very small impact of state-funded tourism promotion on average across the 48 contiguous states. However, it still could be the case that there is an impact on other tourism-related industries, such as amusement and recreation or arts and entertainment. Graphic 4 reports results from estimates from the amusement and recreation sector. Standard errors have been treated with White’s (1980) heteroskedasticity invariant, variance-covariance matrix. As with the hotel and accommodation models, there is no evidence of shared unit root in these data.
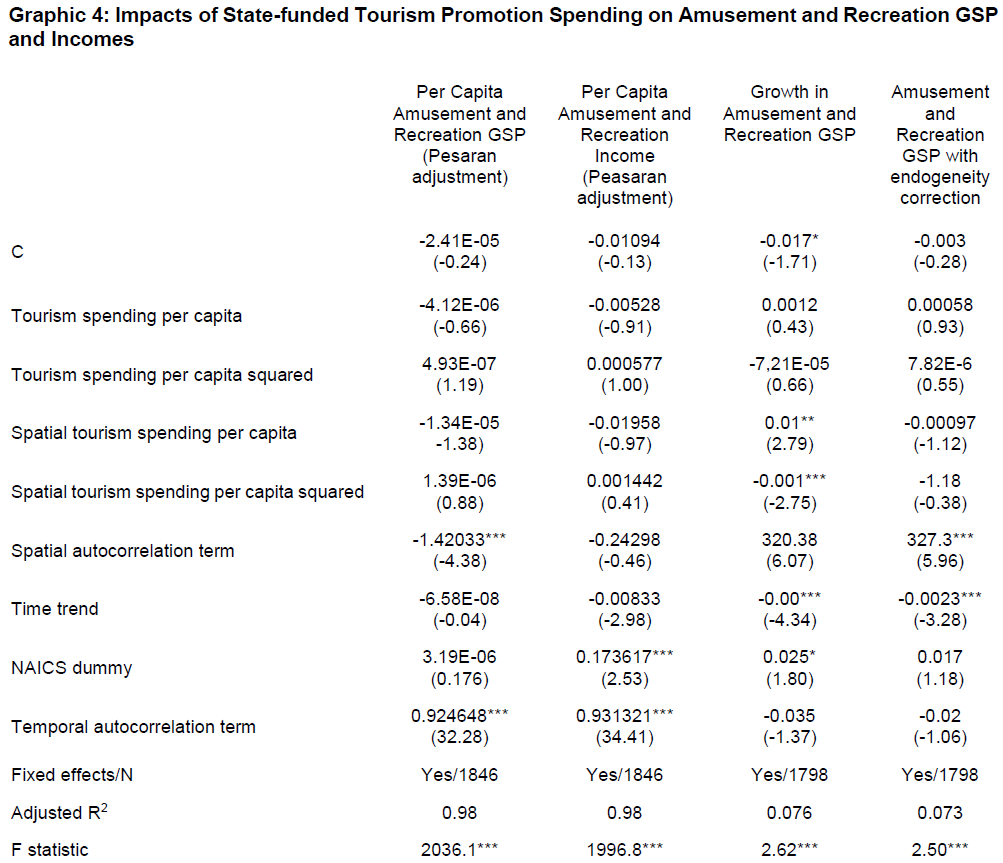
Further, the full models repeat the sensitivity of amusement and recreation to state tourism spending as does the first model. Unlike the first model, state-funded tourism promotion is not correlated with changes in either GSP or income in the recreation and amusements sector. Thus, the low magnitude of impacts detected in the first models on hotels and accommodations finds even less impact on the second tests for amusement and recreation.
Graphic 5 below reports results from estimates based on arts and entertainment data. Because of the NAICS reclassifications, however, only the impact of state-funded tourism promotion on arts and entertainment income could be assessed. Standard errors have been treated with White’s [1980] heteroskedasticity invariant, variance-covariance matrix, and again these data do not share a common unit root.
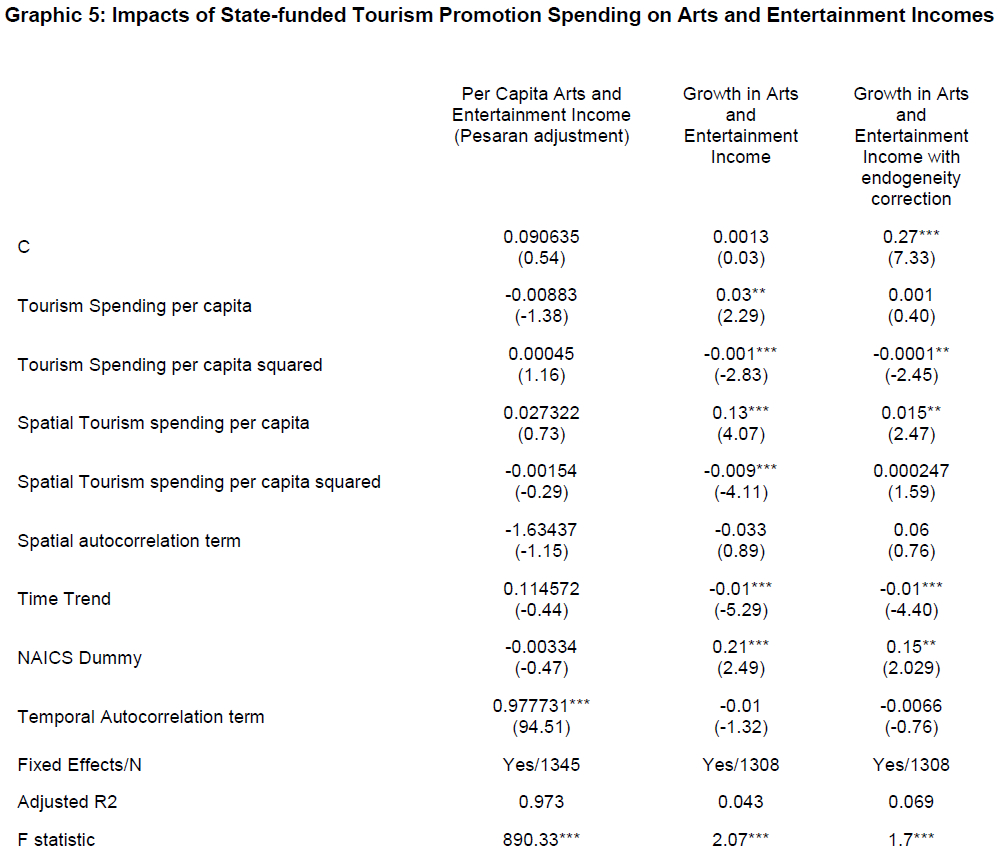
In this test of arts and entertainment income, the estimate in levels shows no statistically significant impact of state-funded tourism spending. However, in the growth model without endogeneity adjustments, there is a statistically significant, but economically miniscule impact on arts income. Calculating the impact in year one, spending $1,000,000 in additional state tourism promotion would increase total art and entertainment income by less than $35,000 in the average state. These results are statistically significant, but are far below the threshold of economic consequence.
In this one model of income growth in arts and entertainment, 13 states showed impacts for tourism spending that were statistically different from zero. All were negative, suggesting much of the observed negative impact tourism spending had on arts and entertainment was limited to those states, though another dozen more showed impacts that were close to generally accepted levels (10 percent).
[*]Spatial autocorrelation may occur in noncontiguous counties. So, it is possible to correct for the influence of distance using such measures as county centroid distances in a GIS setting. In practice, political boundaries are most commonly used since this is where data is collected. Also, estimating the influence of space in more distant counties increases calculation costs significantly.
[†]For the sector list and a CGQ modeling approach to tourism, see: Adam Blake and Jonathan Gillham, “A Multi-Regional CGE Model of Tourism in Spain” (Brussels: European Trade Study Group, Sept. 2001).
The three sets of tests reported here are designed to evaluate the impact of state-funded tourism promotion spending on the major components of tourism activity in each state: hotel and accommodations, amusement and recreation, and arts and entertainment. The size and changes to tourism-related GSP and incomes are largely related to factors that are invariant across time and spatial effects, such as surrounding state earnings in these sectors. This is unsurprising. Households undertake tourism-related expenditures to visit natural resources and amenities that rarely change. So, popular beach visitation locations such as Florida, Georgia and South Carolina would expect annual tourism GSP and worker incomes to be largely related to the fact that all have beaches and are contiguous, even if some amenities (such as Orlando’s theme parks) have seen significant improvements in recent years.
Insofar as these models were able to capture the bulk of tourism-related economic activity in a given state, this analysis offers a clear result. State-funded tourism promotion has a very small impact on tourism-related economic activity and does not appear to impact salary or wages for workers in these sectors. There is evidence that it boosts GSP in the hotel and accommodations sector and income in the arts and entertainment sector, but the effect sizes are incredibly small and of little practical economic significance.
The result reported above was estimated across all cross sections of states, and so is a national average. However, in separate estimates for one statistically meaningful variable with positive results of tourism spending (hotel and accommodations GSP), only Mississippi, Idaho, Washington, Maryland and Nevada had coefficients that were both statistically significant and different from the GSP estimate reported above. This means that all other states had either the same GSP of state tourism spending or no measurable impact. Notably, only five states had impacts that were larger than the reported coefficient above and statistically meaningful. In these states, the GSP impact of a $1,000,000 state tourism expenditure was as high as $300,000 for hotel and accommodations GSP, but even this is still far below a level of efficacy in this setting.
It is possible that the state-funded tourism promotion boosts revenues and earnings for advertising firms and other economic sectors not estimated here. Since most retail and restaurant purchases are made by locals, estimation of these impacts is not fruitful. Also, statefunded tourism promotion may increase expenditures at public sector tourism sites (state parks, etc.), resulting in higher incomes for public employees. Since data on hotel and accommodations, amusement and recreation, and arts and entertainment are private sector only, this model does not assess that hypothesis.
The authors would like to thank the following people for their assistance in producing this report:
Although these individuals helped significantly in the researching and writing of this study, any errors in the report are the responsibility of the authors themselves.
1 Michael LaFaive and Michael Hicks, “MEGA: A Retrospective Assessment” (Midland, MI: Mackinac Center for Public Policy, April 12, 2005), Appendix E, https://perma.cc
2 “Michigan Economic Development Corporation: An Overview for Joint Select Committee on Economic Growth,” PowerPoint (Senate Fiscal Agency, Aug. 23, 2006), https://perma.cc
3 MCL § 2.102a.
4 Ben Gielczyk, “Pure Michigan Tourism Marketing Campaign” (Michigan House Fiscal Agency, Oct. 29, 2015), https://perma.cc
5 Michael D. LaFaive, “A Brief History of State Economic Development” (Mackinac Center for Public Policy, Oct. 6, 2005), https://perma.cc
6 Ben Gielczyk, “Pure Michigan Tourism Marketing Campaign” (Michigan House Fiscal Agency, Oct. 29, 2015), 2, https://perma.cc
7 Ibid.
8 John Deskins and Matthew Seevers, “Are State Expenditures to Promote Tourism Effective,” Journal of Travel Research 50, no. 2 (2011): 158, https://perma.cc
9 This calculation was performed by James Hohman, assistant director of fiscal policy, using data from the U.S. Census Bureau and the State of Michigan.
10 John Deskins and Matthew Seevers, “Are State Expenditures to Promote Tourism Effective,” Journal of Travel Research 50, no. 2 (2011): 158, https://perma.cc
11 John Deskins and Matthew Seevers, “Are State Expenditures to Promote Tourism Effective,” Journal of Travel Research 50, no. 2 (2011): 154, https://perma.cc
12 “Tourism Advertising Evaluation and Image Study” (Michigan Economic Development Corporation, 2016), https://perma.cc
13 “Purchase Order - PO#: PO-3260” (Michigan Economic Development Corporation, Oct. 20, 2014), https://perma.cc
14 Maria Mendez, “Notice of Intent to Purchase” (Michigan Economic Development Corporation, Aug. 25, 2010), 2, https://perma.cc
15 Ibid.
16 “Longwoods International Accountability Research” (Honolulu, HI: Hawaii Visitors and Convention Bureau, Aug. 2002), https://perma.cc
17 Ibid.
18 Ibid.
19 “Quantifying the Bottom Line Value of Events and Sponsorships in the Context of Brand Advertising” (Longwoods International, Sept. 20, 2007), https://perma.cc
20 Bill Siegel, “What Happens When You Stop Marketing: The Rise and Fall of Colorado Tourism” (Longwoods International, March 18, 2009), 11, https://perma.cc
21 “2014 North Carolina Image and Advertising Accountability Research” (Longwoods International, Jan. 2015), 114, https://perma.cc
22 Jeff Murray, “Consultant: Finger Lakes Wine Country Advertising Campaign Well Worth the Investment” (Longwoods International, Feb. 28, 2011), https://perma.cc
23 “The Art of Collaboration” (Greater Philadelphia Tourism Marketing Corporation, 2012), 7, https://perma.cc
24 Jeri Clausing, “New Mexico Tourism Says New $1.2 Million Advertising Campaign Yielded a 3-to-1 Return,” Times Colonist, Dec. 19, 2012, https://perma.cc
25 These were projections made by Longwoods. “Funding Connecticut’s Tourism Promotion: A White Paper” (Connecticut Department of Economic & Community Development, May 2012), https://perma.cc
26 “TourismOhio Marketing Returns $15 for Every Dollar Invested” (Ohio Department of Development, March 21, 2013), https://perma.cc
27 “2014 West Virginia Image and Advertising Accountability Research” (Longwoods International, Nov. 2014), 125, https://perma.cc
28 “Minnesota 2013 Tourism Advertising Evaluation and Image Study” (Longwoods International, March 31, 2014), https://perma.cc
29 “New Mexico Tourism Advertising ROI Study” (Longwoods Interntional, July 2015), 10, https://perma.cc
30 “2014 North Carolina Image and Advertising Accountability Research” (Longwoods International, Jan. 2015), 114, https://perma.cc
31 John L. Crompton, “Economic Impact Studies: Instruments for Political Shenanigans?,” Journal Article, Journal of Travel Research 45, no. August (2006): 70, https://perma.cc
32 “Michigan 2015 Tourism Advertising Evaluation and Image Study” (Longwoods International, April 2016), 60, https://perma.cc
33 Ibid., 5-7.
34 John Deskins and Matthew Seevers, “Are State Expenditures to Promote Tourism Effective,” Journal of Travel Research 50, no. 2 (2011): 154–170, https://perma.cc
35 Ibid., 156.
36 Ibid.
37 Ibid.
38 Ibid., 154.
39 Ibid.
40 Ibid., 166.
41 Nada Kulendran and Larry Dwyer, “Measuring the Return from Australian Tourism Marketing Expenditure,” Journal of Travel Research 47, no. 3 (2009): 275–284, https://perma.cc
42 Hanquin Qiu Zhang, Nada Kulendran and Haiyan Song, “Measuring Returns on Hong Kong’s Tourism Marketing Expenditure,” Tourism Economics 16, no. 4 (2010): 853, https://perma.cc
43 Haiyan Song, professor of tourism, School of Hotel and Tourism Management, The Hong Kong Polytechnic University, email correspondence with Michael LaFaive, Mackinac Center for Public Policy, Nov. 11, 2015.
44 John L. Crompton, “Economic Impact Studies: Instruments for Political Shenanigans?,” Journal Article, Journal of Travel Research 45, August (2006): 75–76, https://perma.cc
45 Michael J. Hicks and Kristy L. Wilburn, “The Regional Impact of Wal-Mart Entrance: A Panel Study of the Retail Trade Sector in West Virginia,” The Review of Regional Studies 31, no. 3 (2001): 305–313, https://perma.cc
46 Hamparsum Bozdogan, “Akaike’s Information Criterion and Recent Developments in Information Complexity,” Journal of Mathematical Psychology 44, no. 1 (2000): 62–91, https://perma.cc
47 Author’s calculation based on data from the U.S. Bureau of Economic Analysis and Reis.
48 M. Hashem Pesaran, “Estimation and Inference in Large Heterogeneous Panels with Multifactor Error Structure,” Econometrica 74, no. 4 (March 2006): 967–1012, https://perma.cc
49 Badi H. Baltagi, Econometric Analysis of Panel Data, Vasa, Third Edit. (John Wiley & Sons, Ltd, 2005), https://perma.cc
50 Michael J. Hicks and Kristy L. Wilburn, “The Regional Impact of Wal-Mart Entrance: A Panel Study of the Retail Trade Sector in West Virginia,” The Review of Regional Studies 31, no. 3 (2001): 305–313, https://perma.cc
51 Halbert White, “A Heteroskedasticity-Consistent Covariance Matrix Estimator and a Direct Test for Heteroskedasticity,” Econometrica 48, no. 4 (1980): 817–838, https://perma.cc
52 M. Hashem Pesaran, “Estimation and Inference in Large Heterogeneous Panels with Multifactor Error Structure,” Econometrica 74, no. 4 (March 2006): 967–1012, https://perma.cc