Michigan’s net-zero energy plans are all pain for no real gain.
Modeling completed by the Center of the American Experiment and Always On Energy Research for the Mackinac Center for Public Policy demonstrates that achieving net-zero goals will cause Michigan’s already-high electricity prices to skyrocket. Initial versions of similar legislation proposed in 2023 would have mandated that the state receive 100% of its electric supply using solar, wind and battery backups by 2050.
That plan would cost Michiganders $386 billion by 2050, which amounts to an average annual cost increase of $2,746 per customer, or an additional $228.83 on monthly utility bills.
That’s not all: It would expose Michigan residents to a greater risk of blackouts. Our modeling shows that relying on a wind-, solar-, and battery-based grid could lead to numerous blackouts throughout the year. The most prolonged blackout based on the model would last 61 continuous hours during winter, when Michigan residents need reliable energy the most.
Despite this enormous cost and the threat of multi-day blackouts, the 100% solar, wind, and battery mandate would avert a paltry 0.0015° C of global warming by 2100. Forcing Michigan residents to endure extreme costs to achieve minuscule climate benefits is nonsensical and dangerous.
Attempting to achieve the net-zero targets found in Gov. Gretchen Whitmer’s “MI Healthy Climate Plan” would result in drastic increases in electricity rates. Rate increases like these would seriously harm Michigan families and businesses. Gov. Whitmer’s net-zero mandates would reduce the reliability of Michigan’s electric grid, potentially leaving Michigan residents cold and in the dark for as long as 61 continuous hours during January and February.
To address the shortfalls and immense costs associated with meeting net-zero targets, we developed three policy recommendations that will maintain systemwide reliability and control the rising costs of electricity for Michigan residents.
Immediately halt the planned early closures of coal, nuclear and natural gas plants.
The net-zero plans to rush the closure of reliable baseload power plants will leave Michigan residents at high risk of electric service shortfalls. Michigan legislators should pass an immediate moratorium on the closure of large, reliable generation facilities, at least until equally reliable facilities can replace their entire production.
Create a Reliable Portfolio Standard.
Low-cost estimates for building and operating wind and solar present an overly optimistic picture of the costs of this proposed energy transition. Michigan legislators should require the Michigan Public Service Commission and public utilities to use a “reliable portfolio standard” and factor an “all-in cost” of wind and solar in their energy plans. This would protect the public by requiring utilities to restore the importance of maintaining grid reliability as their primary goal.
Enact an “Only Pay for What You Get” Act.
Michigan legislators should protect residents and ratepayers by allowing utilities to charge only for the reliable energy they provide. Under the current regulatory system, monopoly utilities can force ratepayers to finance building new generation even if it weakens grid reliability, such as with wind and solar projects.
Wind turbines, for example, produce an average of about 15% of their potential output at any given time due to their weather dependency.[1] An “Only Pay for What You Get” Act would allow Michigan utilities to bill customers for no more than 15% of the cost of wind turbines — the portion that contributes to grid reliability.
Michigan’s pursuit of net-zero energy targets is a fatally flawed and increasingly dangerous endeavor. It will lead to enormous costs for ratepayers and an increased risk of blackouts. These harms do not outweigh the potential environmental benefits, which are, at best, a negligible reduction in the average global temperature decades into the future.
State policymakers should focus on practical solutions rather than burdening families and businesses with skyrocketing electricity bills and jeopardized grid reliability. Michigan can safeguard its energy future by halting the premature closure of reliable power plants, ensuring transparency in the total cost of net-zero energy plans and enacting an “Only Pay for What You Get” Act. A balanced energy path for Michigan will prioritize energy affordability, reliability and security, which are essential to protect the well-being of Michigan residents.
[*] Authors’ note: This report builds on and closely follows the framework of modeling and a series of reports completed by Isaac Orr and Mitch Rolling of Always On Energy Research. The modeling work underlying this report has been used to forecast the cost of energy portfolios across the country and has found similar energy policy challenges in Minnesota, Wisconsin, Virginia, Washington, North Carolina and Colorado.
Michigan is unique in many ways, perhaps most noticeable in its geography and proximity to the Great Lakes. Despite its unique nature, the state’s elected officials are promoting energy policies that have damaged access to reliable and affordable energy in states like California, Texas and in several European countries.
While California and Texas are doubling down on their plans to transition from coal, natural gas and nuclear energy sources to unreliable and expensive wind and solar, other countries, like the United Kingdom, have elected to hold off on implementing their full net-zero goals. For example, in late 2023, then-British Prime Minister Rishi Sunak paused the U.K.’s net-zero transition.[2] In April 2024, Scotland’s government also abandoned its goal to achieve a 75% reduction in CO2 emissions by 2030. Scotland’s Net Zero and Energy Cabinet Secretary Màiri McAllan said the country’s goal “is out of reach.”[3]
These nations are not alone. Major companies are also pulling back from their unrealistic net-zero plans. “Oil giants have begun tapping the breaks” on their previous net-zero commitments laments Grist staff writer Kate Yoder.[4] She noted that BP abandoned its target to reduce emissions by 35% by 2030, pledging a 20- 30% reduction instead. Both Shell and Exxon, meanwhile, stopped funding some so-called renewable energy projects. BP is also considering dropping its goal of reducing oil and gas production by 40% by 2030.[5]
But in Michigan, the plans for rushing an energy transition are proceeding at full steam. In late 2023, the state Legislature passed bills to codify Gov. Whitmer’s “MI Healthy Climate Plan,” which aims for net-zero greenhouse gas emissions in Michigan by 2050. The state’s two monopoly utilities have plans to build more wind, solar and battery facilities and decommission power plants fueled by coal and natural gas.
We modeled two scenarios that describe the range of potential cost and grid reliability impacts imposed by Michigan’s net-zero mandates. This modeling demonstrates that achieving Gov. Whitmer’s net-zero goals will further raise Michigan’s already-high electricity prices. This holds regardless of how the state meets these mandates, whether it entails going to a 100% wind-, solar- and battery-based grid or using less drastic changes to retain reliable generation sources and reduce costs on ratepayers.
Transitioning Michigan’s electric grid to rely almost wholly on wind and solar with battery storage — the Wind, Solar, Battery, or WSB, scenario in our modeling — would cause the state’s residents to pay $124 billion in additional costs by 2035 and $386 billion by 2050. Those increases would add up to an average annual utility bill increase of $2,065 in 2035 for Michigan families. That average increase amounts to an additional $172.08 per month and increases the average 2022 monthly electric utility bill of $117.57 in Michigan by 146% to $289.65. Compounding these problems, our modeling reveals that Michigan residents would be exposed to blackouts, some of which could last for as long as 61 continuous hours during the winter.
Our second scenario to meet CO2 emissions reduction goals — the Lower Cost Decarbonization, or LCD, scenario — models the costs of retaining the state’s existing large coal and natural gas facilities for their full expected life cycles but retrofitting them with carbon capture and storage equipment, or CCS. While these plants continue to operate, the scenario forecasts the costs of building new nuclear plants. Using coal and natural gas with CCS, as well as new nuclear, the LCD scenario achieves the desired CO2 reductions but saves ratepayers $90 billion out to 2035 and $180 billion out to 2050 compared to the WSB scenario. The LCD option also avoids the potential for extended and dangerous blackouts.
To be clear, there is no inexpensive way to meet the CO2 reduction targets Michigan officials have written into legislation.
The MI Healthy Climate Plan will impose something that fits between the WSB and LCD scenarios on the spectrum of methods to meet Michigan’s net-zero mandates. It would add substantial costs to the state’s electricity future. Michigan already has the highest electricity rates of its neighboring states.[6] At the same time, Michiganders suffer from some of the worst electric service reliability in the nation.[*] Net-zero energy plans will only add to Michigan families’ and businesses’ energy burdens.
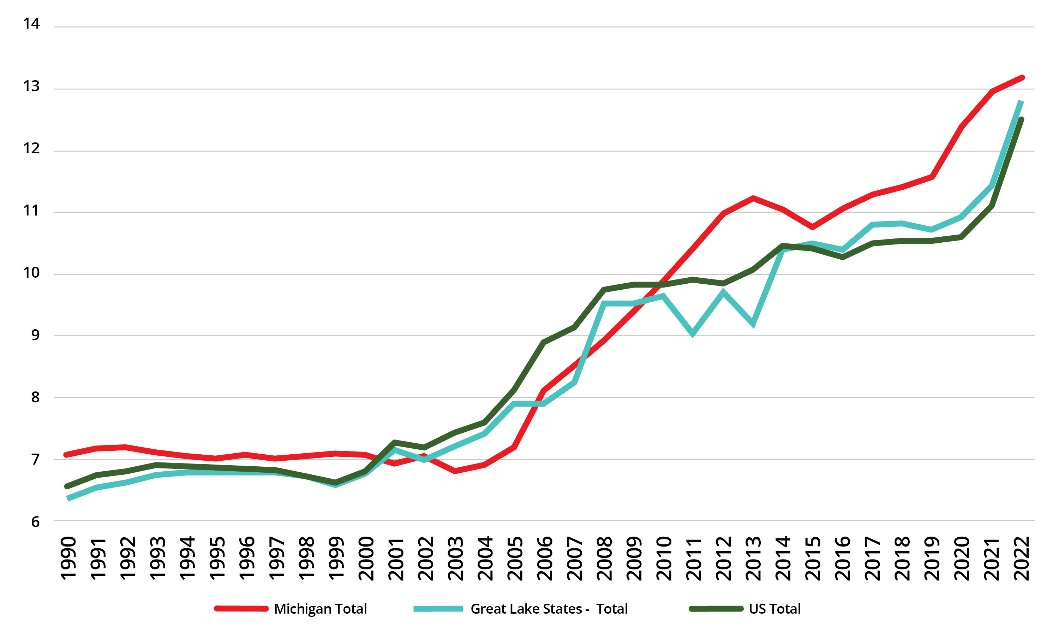
Source: Energy Information Administration
Energy industry experts, including utility executives, officials at the Federal Energy Regulatory Commission, and electric grid operators warn that early closure of baseload plants will cause a net loss of generation capacity and leave the region at risk of shortages.[7] Experts highlight the growing risks of attempting to replace them with unreliable and intermittent energy sources like wind and solar.
Erratic power generation drives away businesses and leaves residents vulnerable, especially during the heat of summer or cold of winter. Addressing the reliability issues imposed by wind and solar is both challenging and expensive. Their intermittent nature requires utilities to take on massive projects to build thousands of new turbines and install millions of solar panels to meet the public’s electricity needs. They also need to build new transmission lines and large batteries. Our modeling confirms the costs of rapid expansion in generation and transmission infrastructure will be immense.
Net-zero plans are fundamentally flawed for various environmental and economic reasons. If state officials ignore those reasons and continue to pursue net-zero policies, however, the LCD scenario is a more prudent means of meeting the CO2-reduction mandates proposed by Gov. Whitmer and Michigan legislators. Our modeling demonstrates that achieving many of the same emissions-reduction goals at far lower costs while retaining grid reliability is possible. This is accomplished by:
Retaining existing coal- and natural gas-powered baseload generation plants for their complete expected life cycle.
Adding carbon capture and storage equipment to these plants to reduce atmospheric emissions of CO2 from these generation plants.
Reopening the Palisades Nuclear Plant with appropriate equipment and infrastructure upgrades to ensure continued safe and reliable operations.
Building additional nuclear plants to provide reliable, clean, safe and efficient electricity.
The LCD option offers a harm-mitigating option that will achieve the net-zero policy goals espoused by Gov. Whitmer and lawmakers, lower the costs of making this energy transition and reduce the risk of blackouts.
[*] In the Michigan Public Service Commission’s 2022 annual report, it “found current [utility] distribution planning approaches insufficient to address pressing matters of reliability of service to customers and found Michigan’s distribution system reliability inadequate and current plans for improvements insufficient.” See: “Annual Report 2022,” (Michigan Public Service Commission, March 6, 2023), 29, https://perma.cc
Gov. Whitmer outlined her goal to achieve net-zero CO2 emissions for the state by 2050 in her MI Healthy Climate Plan. It was the foundation for the bills passed in the Legislature in late 2023. Michigan’s two large monopoly utilities — DTE Energy and Consumers Energy — have also produced “integrated resource plans” that detail their future energy production. While these plans differ in detail, they both claim the need to mitigate the alleged harmful effects of climate change.
As such, the future of electricity generation in Michigan is in flux. State policymakers and public utilities have pledged to make significant changes, but the specific reforms that will ultimately be enacted are still being legislated, planned, debated and litigated.
The MI Healthy Climate Plan is based on a series of executive directives and orders issued by Gov. Whitmer in February 2019 and September 2020.[8]
This directive added Michigan to the United States Climate Alliance, “a bipartisan coalition of governors securing America’s net-zero future by advancing state-led, high-impact climate action.”[9] It committed the state to, among other things, “implement policies that advance the goals of the Paris Agreement, aiming to reduce greenhouse gas emissions by at least 26-28 percent below 2005 levels by 2025.”[10]
The Paris Agreement is a “legally binding international treaty on climate change” signed by 196 parties (or nations) in 2015. The agreement's stated goal is to reduce CO2 emissions as a means “to limit the temperature increase to 1.5° C above pre-industrial levels.”[11] While President Trump has once again pulled the country out of the Paris Agreement with his Jan. 20, 2025, executive order, Michigan remains an active participant in the U.S. Climate Alliance and committed to meeting its previously established goals.[12]
This directive was signed on Sept. 23, 2020, and declared that climate change is “already degrad[ing] Michigan’s environment, hurt[ing] our economy, and threaten[ing] the health and well-being of our residents, with communities of color and low-income Michiganders suffering most.”[13] It claims that inaction has already had “devastating consequences for future generations.” The directive instructs that these effects “will only intensify.”
Michigan can “avoid some of the worst harms” associated with climate change by rapidly reducing greenhouse gas emissions, according to the directive. The goal is to build a “carbon-neutral state” to protect the environment and public health and maintain a resilient economy.
The directive commits the state to achieve “economy-wide carbon neutrality no later than 2050” and “net negative greenhouse gas emissions thereafter.” It requires all state-owned and operated buildings to reduce energy use by 40% and be fully carbon-neutral by 2040.
This order created the Council on Climate Solutions, an advisory body to the state environment department meant to guide the development and implementation of the MI Healthy Climate Plan. The council is to be made up of the heads of several state agencies and “14 residents of this state appointed by the governor representing the range of sectors, experiences, and expertise relevant to this issue.” The order requires that all state departments, agencies, commissions, and officers “must give to the Council, or any member or representative of the Council, any necessary assistance required by the Council” to achieve its mission “so far as is compatible with their duties and consistent with this order and applicable law.”[14]
Details of the MI Healthy Climate Plan
The MI Healthy Climate Plan covers many topics. The report’s overarching goal is to make Michigan carbon neutral by 2050. This means the state emits only as much CO2 as it offsets. The plan recommends phasing out coal power plants and generating 60% of the state’s electricity from so-called renewable sources — largely wind and solar — by 2030. It seeks to reduce carbon emissions from homes and businesses, build more electric vehicle charging stations, support “climate-smart agriculture,” and calls for a mandate that 40% of all state funding for these purposes “benefit Michigan’s disadvantaged communities.”[15]
The MI Healthy Climate Plan repeatedly attempts to link extreme, but not unprecedented, weather events in Michigan to human-caused climate change. However, these attempts fail to do more than advance a generalized claim that some weather event occurred because of climate change with the, at best, questionable defense that the “impacts of the climate crisis are irrefutable.” We provide examples of how these claims are refutable and that the weather events described can be easily explained as part of a normal weather cycle in “Appendix 1: MI Healthy Climate Plan Fails to Justify Net-Zero Mandates.”
The primary focus of energy legislation passed in late 2023 is best summed up by testimony given on June 21, 2023, to the Michigan House of Representatives Energy, Communications, and Technology Committee. The testimony comes from the primary sponsor of one of the bills, Rep. Betsy Coffia, D-Traverse City. Rep. Coffia explained that the bill package “codifies the governor’s MI Healthy Climate Plan.”[16] The Senate bills have a similar end goal.[17]
Amended versions of this legislation were passed by the Michigan House and Senate and signed by Gov. Whitmer on Nov. 28, 2023. At the same time, the governor also signed House Bill 5120 into law. This bill effectively removed the ability of elected township and county governments to have the final say in decisions about where to site wind turbines and solar panels. Final authority was handed over to appointed officials at the Michigan Public Service Commission.
Defending the policy, the chair of the commission, Commissioner Dan Scripps, argued that the state “can’t allow projects of statewide importance that are critical to our state energy security to be vetoed on purely local concerns.”[18]
The bills passed in November 2023 require the state to meet a variety of so-called green or clean energy requirements. Their mandates include:
Extend the 15% renewable energy credit portfolio through 2029, increases it to 50% from 2030 through 2034, and to 60% in 2035 and after.[19]
Require electricity providers to meet an 80% “clean energy” portfolio from 2035 through 2039 and a 100% portfolio in 2040 and after.
Clean energy systems are defined as those that generate electricity without producing greenhouse gas emissions. Electricity generated from new nuclear plants counts as clean energy. Natural gas — with a minimum 90% carbon capture and storage — can count toward the clean energy portfolio after 2035.
Disallow purchased renewable energy credits to meet the renewable energy standard after 2035. This means utilities cannot rely on other sectors or technologies that have lower greenhouse gas emissions to make the emission cuts and then purchase the right to claim those cuts. The generation technologies used by the utilities must be able to meet the reduction requirements themselves.
Expand the cap on participation in the distributed generation program from 1% to 10%. Customers enrolled in the program receive credits for electricity “outflow” to the grid. These “net metering” programs effectively subsidize residential solar system owners. They benefit from receiving above wholesale payments for the energy they generate for the grid.
Require electricity and natural gas providers to file an energy waste reduction plan starting January 2025.[20] Each plan must meet a 1.5% total “incremental energy savings” and include a goal of 2% waste reduction annually, increasing from the current 1% annual reductions.[21]
Allow land protected, or offered special tax concessions, as farmland to be developed as an industrial solar generation facility and retained for that use for up to 90 years.[22]
The 2023 legislation passed in Michigan demonstrates a worrying rush to mandate the use of unreliable and costly energy sources, predominantly wind and solar, to advocate for electrification, and reduce the use of oil, coal and natural gas. Unfortunately, wind and solar fail to deliver the reliability and affordability essential to power a contemporary industrial economy. Despite claims to address climate change and environmental health, the legislation overlooks the inherent costs and challenges of intermittency imposed by wind and solar technologies. By ignoring the necessity of dependable and cost-effective electricity, these laws will burden customers with exorbitant costs and weakened grid reliability.
Much like the governor’s MI Healthy Climate Plan and the net-zero energy bills passed in late 2023, the focus of Michigan’s two largest monopoly utilities has been a substantial energy transition. This has been the case since May 2018 at least, when both DTE Energy and Consumers Energy struck a backroom deal with California billionaire and environmentalist Tom Steyer. In that agreement, both utilities committed to a 50% “clean energy” standard by 2030, half from increasing wind and solar generation and half from energy efficiency.[23] Steyer agreed to cease funding a ballot initiative that would have forced the state to achieve a slightly more aggressive goal of having 30% of electric supply from wind and solar by 2030.
In just five short years, both utilities have massively increased their wind and solar targets. In their state-approved integrated resource plans, a type of long-term planning document, they are pursuing aggressive wind and solar buildouts as part of larger net-zero goals.[*]
[*] IRPs detail a utility’s plan for supplying electric services to its customers. They are required by state law and must be approved by the Michigan Public Service Commission. Interested parties are allowed to intervene in the hearings that are held by the MPSC, challenge the utility’s long-term plans and petition the commission to require changes in the plan. As a means of obtaining support for their plan, the utility and intervenors can reach a settlement agreement that is then presented to the commission for their review and acceptance.
DTE Energy’s long-term integrated resource plan commits to the “faster shutdown of the utility’s remaining coal-fired power plants and significant investment in wind and solar generation and energy storage.”[24] The utility has publicly committed to reaching CO2 neutrality by 2050.[25]
The plan includes:
Accelerating the retirement of the Monroe Power Plant from 2040 to 2032.[*] Under the new agreement, two of the plant’s units will be retired by 2028 and the other two by 2032.
Spending $125 to $154 million to convert the Belle River Power Plant, currently a coal-fired baseload plant, to a natural gas peaking plant.[†] As a peaking plant, Belle River will supply energy only in periods of peak electricity demand.[26]
Retiring two of the existing, diesel-fueled peaking plants at River Rouge and St. Clair in 2024.
Adding 600 megawatts of wind and solar generation from 2026-2028 and 1,000 megawatts in 2029 and 2030. DTE intends to add 15,400 megawatts of wind and solar generation by 2042.[27]
Adding more than 2,900 megawatts of energy storage by 2042.[28]
Increase targets for energy waste reduction to 2% from 2023 to 2027.[‡]
Increase the cap on its distributed generation program to 6%.[§]
[*] The Monroe plant is made up of four separate 817 megawatts to 823 megawatts boilers. See “Form EIA-860 detailed data with previous form data (EIA-860A/860B)" (U.S. Energy Information Administration, September 2022), 2021 data, https://www.eia.gov
[†] The Belle River Plant is made up of two separate 698 megawatts coal-fired boilers.
[‡] Michigan Public Act 295 of 2008 defines energy waste reduction as “energy efficiency,” and “Load management, to the extent that the load management reduces provider costs,” or “Energy conservation, but only to the extent that the decreases in the consumption of electricity produced by energy conservation are objectively measurable and attributable to an energy waste reduction plan.” See: “Clean and Renewable Energy and Energy Waste Reduction Act – Act 295 of 2008,” (State of Michigan, 2008), https://perma.cc
[§] Michigan’s distributed generation program is set up to encourage residents to install renewable generation that is connected to the grid. Those customers enrolled in the program are paid by their utility for the electricity that their generation equipment produces beyond their own needs, and that is sent out to the grid. The Energy Information Administration defines “distributed generator” as “A generator that is located close to the particular load that it is intended to serve. General, but non-exclusive, characteristics of these generators include: an operating strategy that supports the served load; and interconnection to a distribution or sub-transmission system (138 kV or less).” “Glossary” (U.S. Energy Information Administration, 2025), https://perma.cc
Consumers Energy’s long-term integrated resource plan commits the utility to expediting the closures of its remaining coal-fired power plants and the rapid construction of wind and solar generation with a mix of battery and pumped hydro energy storage.[29] The utility has publicly committed to reaching CO2 neutrality by 2040. The plan includes:
Speeding up the closure of the J.H. Campbell Power Plant by 15 years, from 2040 to 2025.[*]
Purchasing the Covert Generation Station, a natural gas baseload power plant.[†]
Continuing operation of units three and four of the D.E. Karn Generating Complex, a 1,402 megawatts pair of natural gas-fueled peaking plants — one 693 megawatts and one 710 megawatts — in Bay County through May 2031, to maintain overall system reliability.
Adding approximately 8,000 megawatts of solar generation by 2040.
Adding 550 megawatts of energy storage by 2040.
Our modeling indicates that this will impose massive costs and threaten reliable electricity services to the residents of Michigan.
[*] The Campbell Plant is made up of three separate boilers — 265 megawatts, 379 megawatts, and 917 megawatts — and is located in Port Sheldon Township. See “Form EIA-860 detailed data with previous form data (EIA-860A/860B)” (Energy Information Administration, September 2022), 2021 data, https://www.eia.gov
[†] The Covert Plant is made up of three combined cycle turbines — each combined cycle set up consists of one 245 megawatts combustion turbine and one 147 megawatts steam part — and is located in Covert Township. See “Form EIA-860 detailed data with previous form data (EIA-860A/860B)” (U.S. Energy Information Administration, September 2022), 2021 data, https://www.eia.gov
In 2022, Michigan generated 34% of its electricity supply with natural gas, 30% from coal, 22% from nuclear, 8% from wind, 2% from biomass, and 1% each from petroleum, other gas, hydroelectric, and solar.
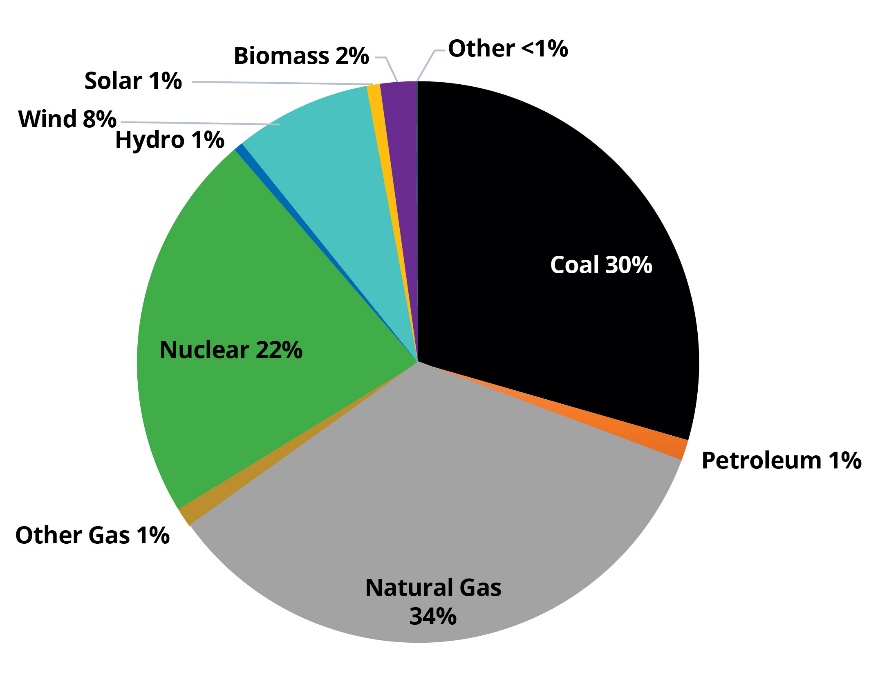
Source: Michigan Public Service Commission
This electricity mix would drastically change under the net-zero plans proposed in Gov. Whitmer’s MI Healthy Climate Plan, the 2023 legislation and in the monopoly utility’s IRPs.[*] Our modeling attempts to estimate how these plans might be achieved and how much this might cost Michigan ratepayers and businesses. It presents two potential scenarios that could be used to achieve the net-zero emissions targets established in the state’s plans. They are the Wind, Solar and Battery scenario, or WSB, and the Lower Cost Decarbonization scenario, or LCD. We expect that, if the state continues to pursue its net-zero goals, the final scenario chosen by state officials will land somewhere between these two modeled scenarios. Currently, with a 60% wind and solar mandate by 2035 and 100% clean energy mandate by 2040, the costs and reliability issues will be closer to the WSB scenario.
[*] The currently approved Integrated Resource Plans for major investor-owned utilities across the state, like Consumers Energy and DTE Energy, would also require this mix to fundamentally change.
The WSB scenario estimates the costs of transitioning Michigan’s current electricity grid to 100% carbon-free electricity using wind, solar, hydro, battery storage and existing nuclear power plants. This scenario was based on the original legislative proposals that were later amended and signed into law. They intended to transition the state’s electric grid to wind, solar, and battery backup by 2035. In the modeling scenario, fossil fuels like coal, natural gas or petroleum are replaced with wind and solar generation, plus battery storage. We have retained the modeled spectrum as a means of demonstrating the range of potential costs associated with achieving the governor’s net-zero goals.
The LCD scenario is less aggressive in transitioning to a net-zero system. It estimates the cost of retrofitting existing large coal and natural gas plants with carbon capture and storage, building new nuclear small modular reactors, nuclear APR-1400s, and adding a small amount of battery storage.[*] This scenario models the installation of carbon capture on the Monroe and Campbell coal plants, as well as the Blue Water Energy Center and Zeeland natural gas plants.
[*] The APR-1400 is a 1,400 MWe is a “two-loop pressurized water reactor,” designed by Korea Hydro & Nuclear Power Co., Ltd. See: “APR1400 Design Control Document Tier 2: Chapter 1—Introduction and General Description of the Plant” (U.S. Nuclear Regulatory Commission, August 2018), https://perma.cc
The model uses 2022 electricity demand and wind and solar capacity factors to determine how much electricity wind, solar and battery storage sources would have to generate on an hourly basis to meet the state’s peak load.
Existing Levelized Cost of Energy values are based on the Federal Energy Regulatory Commission Form 1 files from 2020.
Capital costs and LCOE values for new construction are based on the Energy Information Administration’s 2023 assumptions.
Consumers Energy's capital structure and cost of capital assumptions are used as listed in their public reporting.
The Palisades nuclear plant comes back online in 2028 at a cost of $1 billion.
The Belle River coal facility converts to peaking natural gas in 2026.
New natural gas fuel cost of $3.61 per million British thermal units is based on EIA average.
Michigan transitions to an electricity grid powered by wind, solar, battery storage and existing nuclear by 2035.
Coal plants retire on an accelerated schedule.
Michigan transitions to an electricity grid powered by nuclear plants, coal and natural gas facilities using carbon capture and storage, and a small amount of battery storage by 2050.[*]
Coal plants retire on their original schedules.
[*] Carbon capture and storage, or carbon capture utilization and storage, is described by the International Energy Agency as “the capture of CO2, generally from large point sources like power generation or industrial facilities that use either fossil fuels or biomass as fuel.” After CO2 is captured, it is typically compressed and moved to a storage location, such as deep saline aquifers. Captured CO2 can also be used in a variety of industrial applications, such as enhanced oil recovery. See, "Carbon Capture Utilisation and Storage" (International Energy Agency, 2025), https://perma.cc
State officials have made it clear they are committed to achieving net-zero goals by relying mainly on wind and solar, with some battery backup.
The model predicts that this plan would require the construction of 40,771 megawatts of new solar capacity, 39,699 megawatts of new wind capacity and 25,267 megawatts of battery storage capacity by 2035.
These theoretical representations can provide policymakers with a broad estimate of the potential costs of these net-zero plans, but it is highly unlikely that eliminating all greenhouse gas emissions from Michigan’s electric generation is possible.
Our model also calculates the costs of achieving net-zero targets by 2050 using a mix of existing coal and natural gas plants with carbon capture and building new nuclear. The timeline of the LCD scenario was based on reaching the governor’s net-zero goal by 2050 using reliable energy sources, while also extending new costs over a longer timeline.
The WSB scenario requires retiring all carbon-dioxide-emitting sources:
7.6 gigawatts of coal-powered generation.
12 gigawatts of natural gas.
0.5 gigawatts of petroleum.
0.5 gigawatts of biomass.
It also requires replacing this generation with wind, solar and battery resources:
39.7 gigawatts of wind-powered generation.
40.8 gigawatts of solar generation.
25.3 gigawatts of four-hour battery storage.
The modeled WSB scenario would cost Michigan residents $124.3 billion through 2035 and $385.7 billion through 2050.
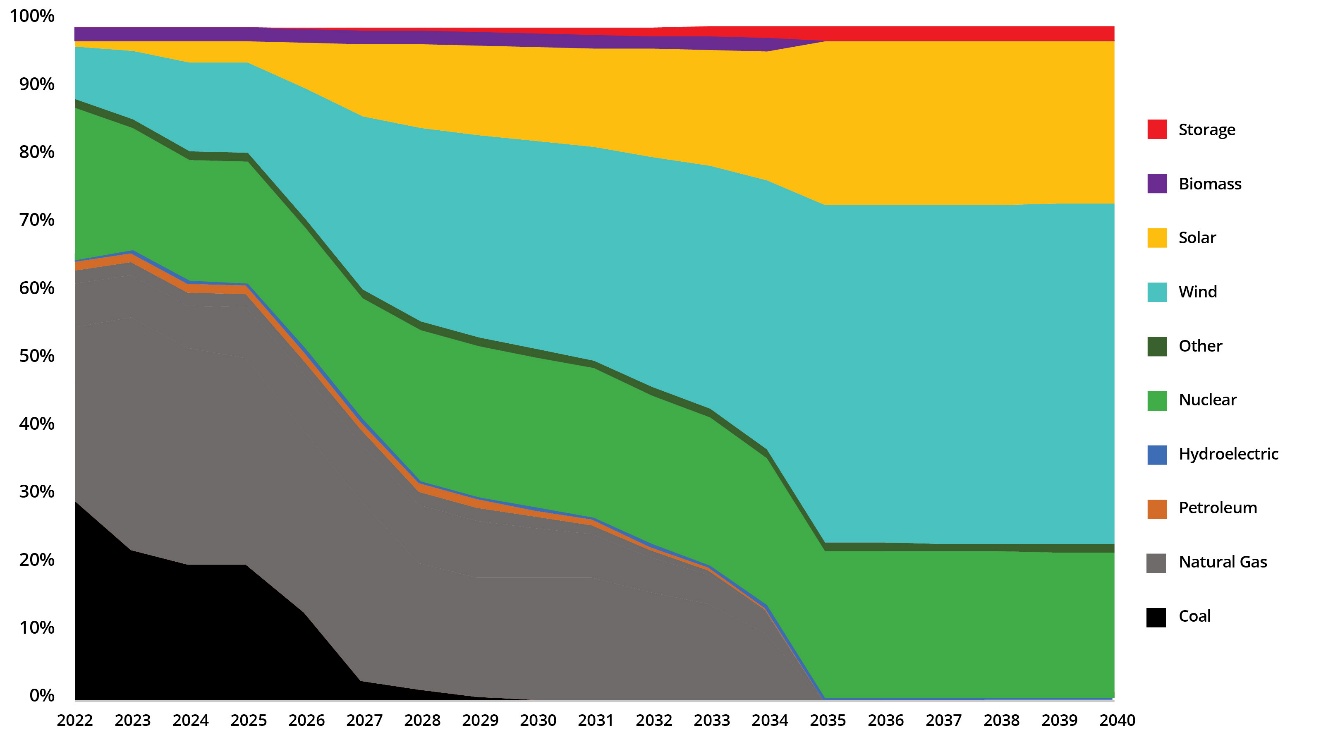
Our modeling forecasts capacity shortfalls based on Michigan’s electricity demand and wind and solar capacity factors experienced in 2020 and 2021.[*] Grid reliability is impacted negatively due to the system’s heavy reliance on intermittent generation sources and short-term backup, specifically wind, solar and four-hour battery storage systems. To achieve the net-zero energy plan goals by 2035, Michigan’s electric grid would need to be made up primarily of wind (50%), solar (24%) and nuclear (22%). This is a massive expansion of wind and solar generation, which currently comprise only 8% and 1% of generation, respectively.
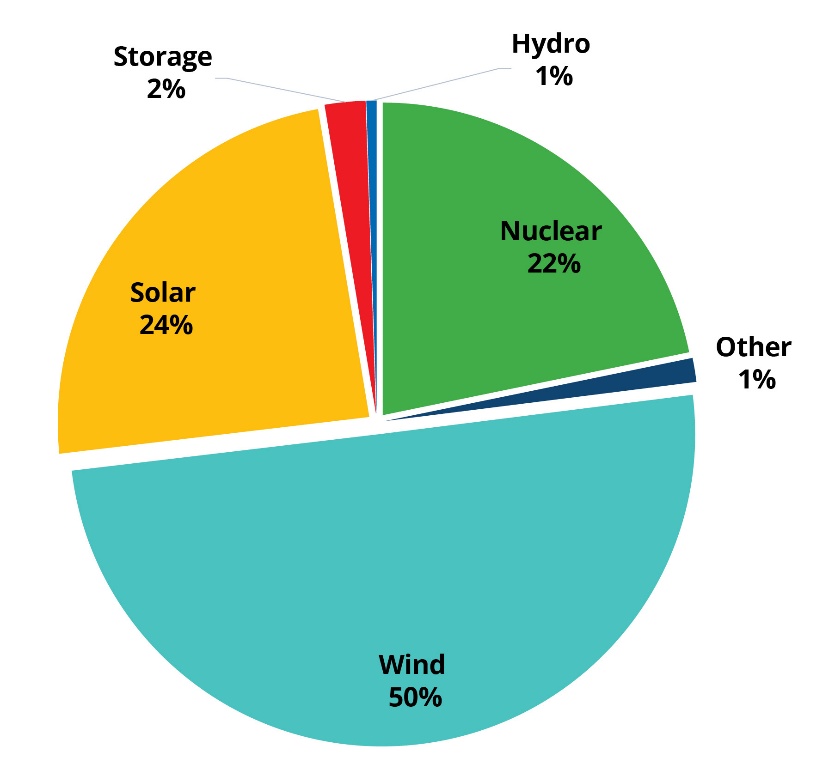
[*] Capacity factor is defined by the Energy Information Administration as “The ratio of the electrical energy produced by a generating unit for the period of time considered to the electrical energy that could have been produced at continuous full power operation during the same period.” See, "Glossary: Capacity factor" (International Energy Agency, 2025), https://perma.cc
The LCD scenario also meets the requirements of the Whitmer net-zero plan. This plan equips existing coal and natural gas power plants in Michigan with carbon capture and sequestration equipment and builds new nuclear power plants and a small amount of battery storage by 2050.[*]
This scenario keeps most of Michigan’s existing large, baseload coal and natural gas plants online longer than the Whitmer plan would. Doing this allows the plants to provide reliable, affordable electricity while new nuclear power plants are being constructed. Keeping these coal plants online longer substantially reduces the costs of the governor’s plan to overhaul Michigan’s electricity grid. The longer these coal and natural plants serve the grid, the less expensive the net-zero transition.
The LCD scenario would require retiring or retrofitting these generation sources in Michigan:
7.6 gigawatts of coal: 4.8 gigawatts retrofitted, 2.8 gigawatts retired.
12 gigawatts of natural gas: 2.1 gigawatts retrofitted, 9.9 gigawatts retired.
0.5 gigawatts of petroleum.
0.5 gigawatts of biomass.
3.2 gigawatts of wind.
0.4 gigawatts of solar.
It would also require replacing this retired capacity with:
12 gigawatts of nuclear SMR.
5.6 gigawatts of nuclear APR-1400.
0.3 gigawatts of battery storage.
[*] The LCD scenario does not mandate a 90% carbon capture rate as is required by Public Act 235 of 2023.
The LCD scenario would cost Michigan residents $34.2 billion through 2035 and a total of $205.9 billion through 2050.
Based on electricity demand and capacity factor data from 2020 and 2021 in Michigan, no capacity shortfall events were predicted in any of the years analyzed under the LCD scenario.
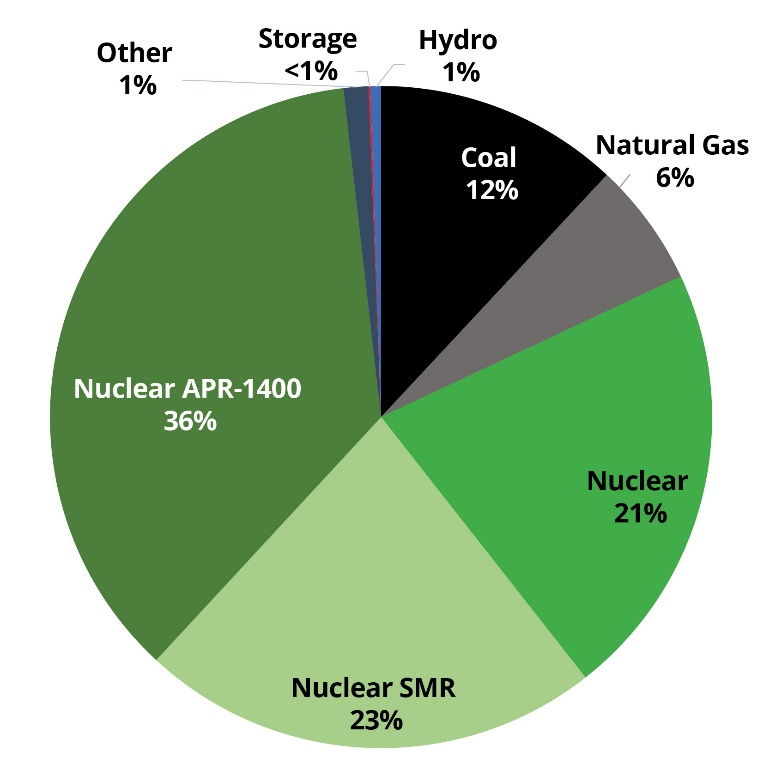
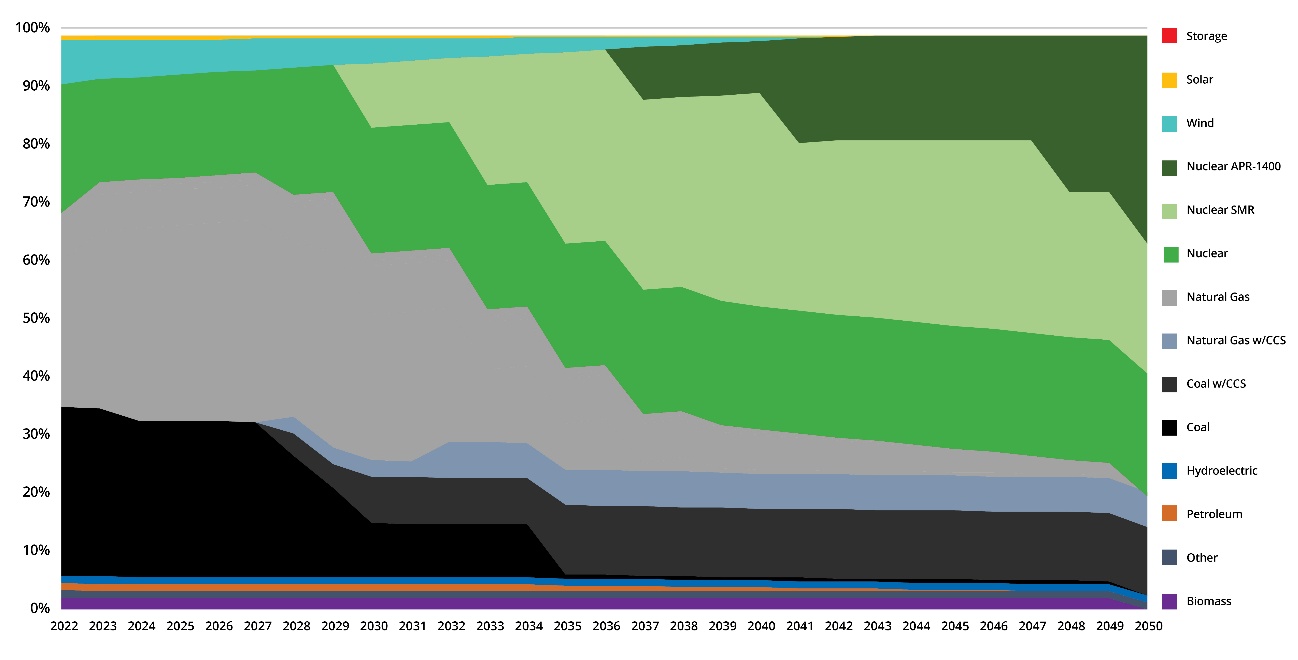
Reliability is retained due to relying on existing coal and natural gas generation (with carbon capture) and then transitioning to nuclear generation. To achieve the net-zero goals by 2050, Michigan’s electric grid would be made up primarily of baseload nuclear (57%), nuclear SMR (23%), retrofitted coal (12%), retrofitted natural gas (6%), and the remainder 2% supplied by a mix of hydro, storage and other minor sources.
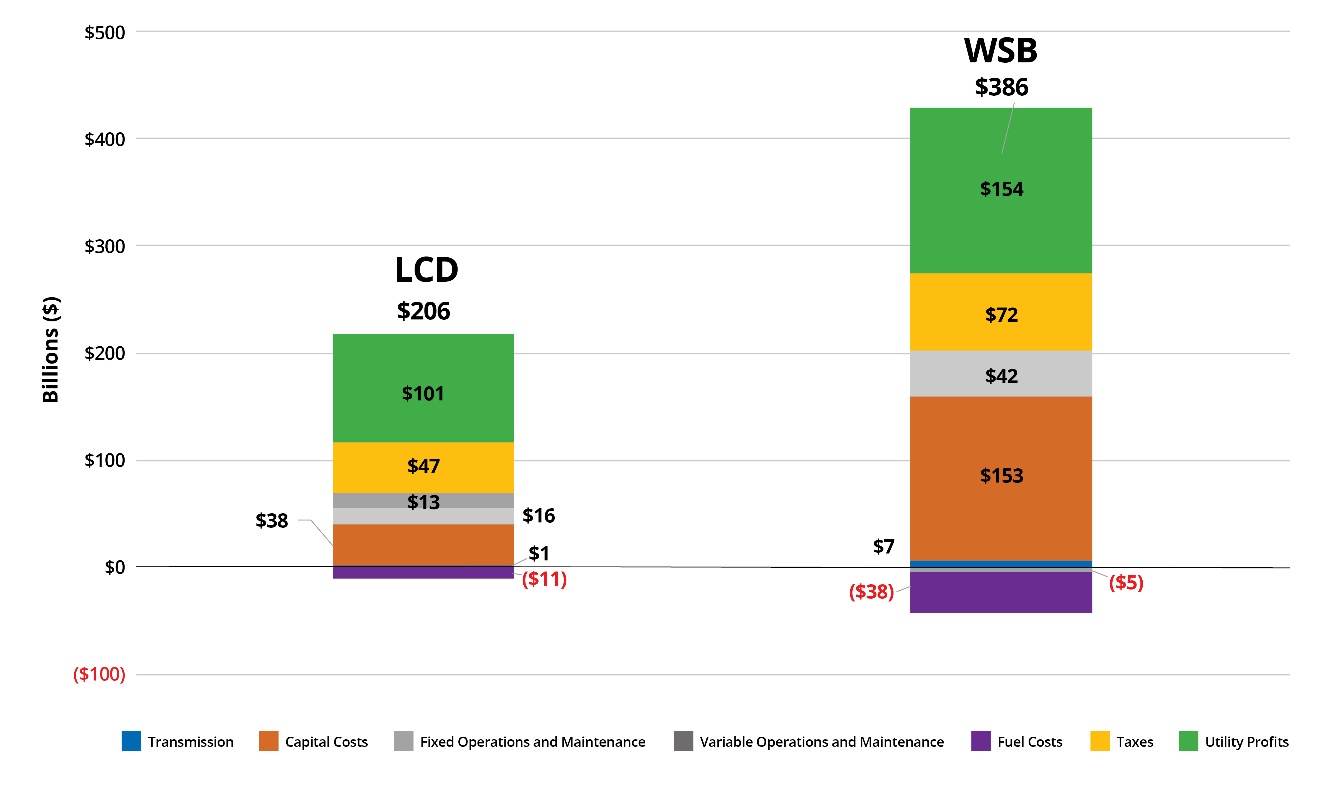
According to our model, the WSB scenario would cost $385.7 billion through 2050. The two most significant expenses are $153 billion in utility and $154.3 billion in capital costs. Other costs include $37.4 billion in operations and maintenance expenses, $6.5 billion in transmission expenses, and $72 billion in additional tax expenses.[*]
Additional costs far exceed any reductions in expenses these changes may create. For instance, utilities will spend less on fuel, such as coal, natural gas, petroleum, etc., but our model estimates this will only save them about $38.4 billion through 2050.
WSB Scenario Total Additional Cost through 2050 ($billion)
| Utility Profits | Taxes | Fuel Costs | Variable Operations & Maintenance |
Fixed Operations & Maintenance |
Capital Costs | Transmission | Total Additional Costs |
| $154.4 | $72.3 | $-38.4 | $-4.7 | $42.1 | $153.5 | $6.5 | $385.7 |
In comparison, the cost of implementing the LCD plan, while still expensive, is far less. The LCD scenario will cost Michigan residents $206 billion by 2050, $180 billion less than the WSB scenario. The two largest expenses in the LCD scenario consist of $101.2 billion in utility profits and $47.5 billion in tax expenses. There are also $38.3 billion in additional capital costs, $29.5 billion in operations and maintenance expenses and $0.9 billion in transmission expenses.
LCD Scenario Total Additional Cost through 2050 ($billion)
| Utility Profits | Taxes | Fuel Costs | Variable Operations & Maintenance |
Fixed Operations & Maintenance |
Capital Costs | Transmission | Total Additional Costs |
| $101.2 | $47.5 | $-11.4 | $13.2 | $16.4 | $38.3 | $0.9 | $206 |
[*] Michigan’s monopoly utility companies are guaranteed an approximate annual 10% return on equity on all undepreciated assets. Because the WSB scenario requires these utilities to rapidly expand their assets, these payments to utilities make up a significant portion of the extra costs of the WSB approach. The MPSC notes in their December 1, 2023, order on the DTE request for a rate increase that the framework for establishing a fair return on equity is based in the U.S. Supreme Court cases Bluefield Waterworks & Improvement Co v. Pub Serv Comm of West Virginia, 262 US 679; 43 S Ct 675; 67 L Ed 1176 (1923); Fed Power Comm v. Hope Natural Gas Co, 320 US 591; 64 S Ct 281; 88 L Ed 333 (1944); and Michigan Bell Tel Co v. Mich Pub Serv Comm, 332 Mich 7, 38; 50 NW2d 826 (1952). "Order: Case No. U-21297" (Michigan Public Service Commission, Dec. 1, 2023), https://perma.cc
Implementing a net-zero emissions scheme is expensive regardless of the technologies used to achieve emissions reduction mandates. That means both scenarios — WSB and LCD — will substantially increase the cost of electricity for all ratepayers, including schools, businesses and households. However, the LCD scenario is a far lower-cost option to achieve the state’s net-zero goals.
While the WSB scenario frontloads the cost of achieving net-zero goals, the investments in carbon dioxide reduction that are part of the LCD scenario are implemented more gradually. Maintaining existing plants and extending the timeline to achieve CO2 reductions cuts off years of costs by stretching out this spending.
Our model estimates that, based on the actual electricity demand in Michigan in 2020 and 2021, a WSB scenario would result in numerous supply shortfalls. The wind, solar and battery capacity built to satisfy 2022 demand would fail to meet demand for a combined 71 hours over six capacity shortfall events, or blackouts, in five different months. The maximum capacity shortfall would be nearly 8,286 MEGAWATTS.
Using 2020 historical demand data, the system would fail to meet demand for a combined 142 hours over nine blackout events in three different months, with the maximum capacity shortfall being nearly 12,126 MEGAWATTS.
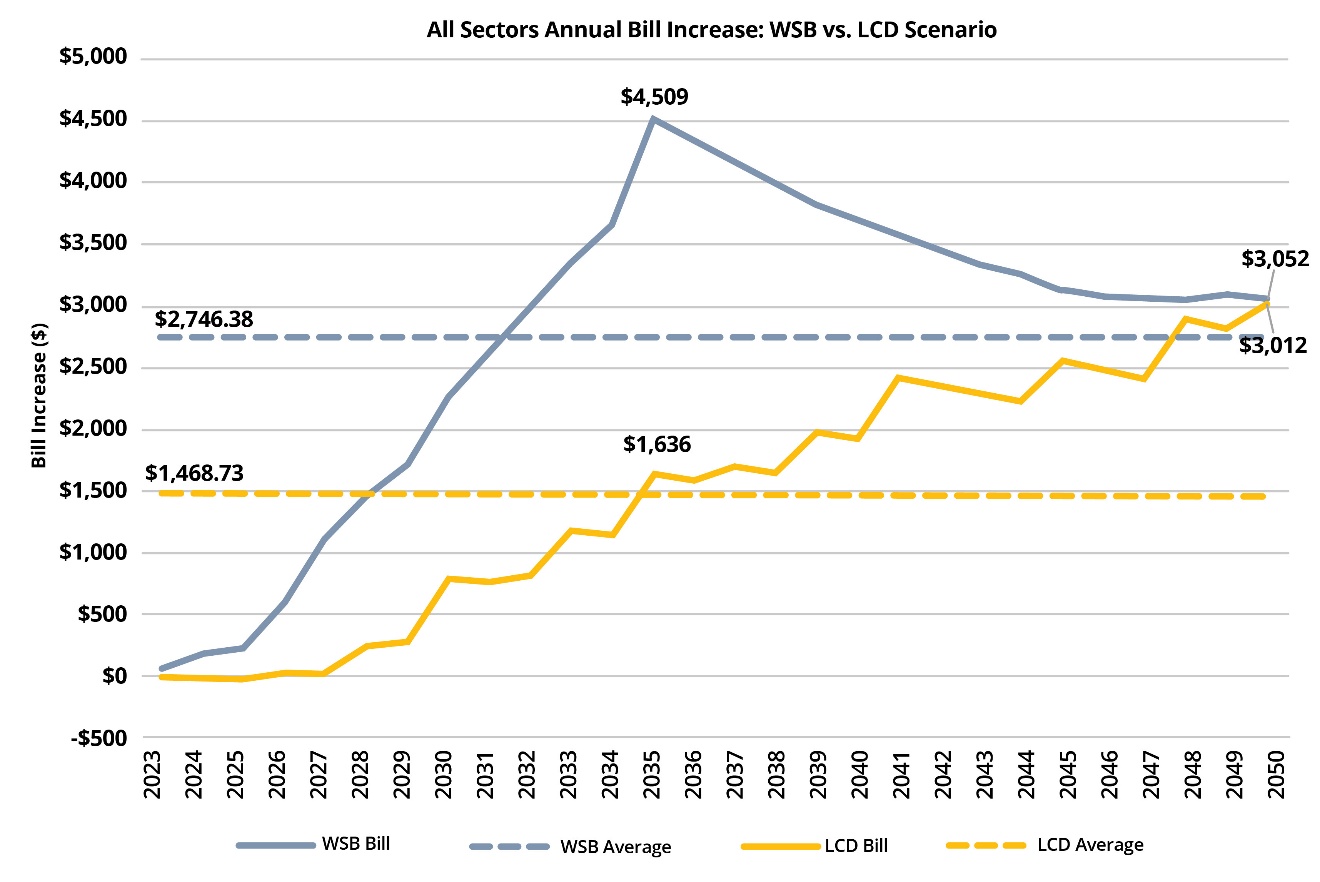
Under the WSB scenario, average electricity rates for all sectors would more than double. Our model showed ratepayers would face an increase of 18.93 cents per kWh, from 12.93 cents in 2021 to 31.86 cents in 2035, nearly a 150% increase. By 2050, the initial glut of spending on wind and solar would begin to decline, and rates would decline to 25.56 cents per kWh (still a 98% increase over Michigan’s 2021 average rate).[*]
Increases in electricity rates would impact the typical Michigan resident. According to our model, under the WSB scenario, annual electric bills would increase by an average of $2,746 over the modeling period (out to 2050). These estimates are determined by taking the forecast annual cost of achieving net-zero under the WSB plan and dividing it between all Michigan utility ratepayers — residential, commercial and industrial.
[*] Based on past rate approvals, this decline is unlikely to lead to an actual rate decrease for Michigan residents. Instead, decreased generation costs would likely be captured as increased profits for Michigan’s monopoly utilities. See: Jason Hayes, “In Michigan, lower energy rates or free thermostats?” (Michigan Capitol Confidential, Feb. 14, 2023), https://www.michcapcon.com
Even though both scenarios would impose significant increases on ratepayers, electricity rates under the LCD scenario would be far lower than in the WSB scenario. When averaged across all sectors — residential, commercial and industrial — electricity rates under the LCD scenario increase by 6.85 cents per kWh, from 12.93 cents in 2021 to 19.78 cents by 2035, a 53% increase. By 2050, rates increase by a total of 12.42 cents per kWh to 25.35 by 2050, a 96% increase.
Under the LCD scenario, annual electric bill will increase by an average of $1,469 over the modeling period (out to 2050).
A key difference between the two scenarios is that Michigan utility customers will not have to frontload the costs of an enormous amount of expensive wind, solar and battery installations in the LCD scenario. The costs for utilities to achieve the net-zero mandate begin to decline in the WSB scenario, but if the modeling scenarios were carried beyond 2050, the LCD scenario would see similar decreases in costs as the initial investments in nuclear and carbon capture infrastructure are paid off.[*] The WSB scenario, on the other hand, would plateau at these higher costs, as repowering wind and solar facilities every 10 to 20 years is necessary.[30] This mandatory spending will cancel out the shrinking costs of the initial glut of wind and solar infrastructure built by utilities.
Our modeling detailed similar impacts for residential, commercial and industrial rates, as shown in the following table.
| WSB Scenario | |||||||||||
| 2021 baseline | 2035 | 2050 | |||||||||
|---|---|---|---|---|---|---|---|---|---|---|---|
| Costs | Cents/kWh | Monthly | Annual | Cents/kWh | Monthly | Annual | ∆% | Cents/kWh | Monthly | Annual | ∆% |
| Residential | 17.54 | $118 | $1,415 | 43.20 | $290 | $3,480 | 146% | 34.67 | $233 | $2,793 | 98% |
| Commercial | 12.31 | $686 | $8,236 | 30.32 | $1691 | $20,292 | 146% | 24.33 | $1,357 | $16,284 | 98% |
| Industrial | 7.69 | $30,414 | $364,970 | 18.94 | $74,916 | $898,992 | 146% | 15.20 | $60,120 | $721,429 | 98% |
| Overall average | 12.93 | $152.25 | $1,827 | 31.86 | $528 | $6,336 | 146% | 25.56 | $407 | $4,879 | 98% |
| LCD Scenario | |||||||||||
| 2021 baseline | 2035 | 2050 | |||||||||
| Costs | Cents/kWh | Monthly | Annual | Cents/kWh | Monthly | Annual | ∆% | Cents/kWh | Monthly | Annual | ∆% |
| Residential | 17.54 | $118 | $1,415 | 26.83 | $180 | $2,162 | 53% | 34.38 | $231 | $2,770 | 96% |
| Commercial | 12.31 | $686 | $8,236 | 18.83 | $1,050 | $12,600 | 53% | 24.13 | $1,346 | $16,152 | 96% |
| Industrial | 7.69 | $30,414 | $364,970 | 11.76 | $46,517 | $55,8204 | 53% | 15.07 | $59,609 | $71,5308 | 96% |
| Overall average | 12.93 | $152.25 | $1,827 | 19.78 | $289 | $3,463 | 53% | 25.35 | $403 | $4,839 | 96% |
The WSB and LCD scenarios lead to similar costs by 2050. The primary difference and the cause of very high costs early in the WSB scenario is the massive build-up of wind, solar and battery infrastructure in the WSB scenario. This build-up causes the rapid increase in rates across all customer classes.
Rushing to meet net-zero goals with wind, solar and batteries also requires closing reliable and affordable fossil and nuclear generation capacity, necessitating the immediate construction of wind turbines, solar panels, battery backup, and new transmission lines. The LCD scenario, on the other hand, arrives at the same destination but takes a less drastic and less costly approach.
Higher electricity costs are an inevitable result of achieving net-zero mandates. While adding carbon capture to existing fossil-fueled generation facilities and building new nuclear facilities will raise costs significantly, this option remains far less expensive (and destabilizing) than the wind and solar route.
As noted previously, the LCD scenario, or policies that reduce reliance on wind and solar while maintaining existing, and (at least partially) depreciated, generation assets will help to reduce the significant early capital expenditures seen in the WSB scenario. Requiring a wind-, solar-, and battery-based grid entails far higher levels of electric generation and transmission capacity to account for the unavoidable intermittency of those generation sources. The spending and utility profits associated with building, operating and maintaining that level of capacity, as well as continued payments approved by state regulators to cover utility costs related to the rushed closure of baseload capacity, cannot be avoided.
[*] Note that the design life of an APR-1400 reactor is 60 years, approximately three times longer than most wind and solar facilities (if those facilities are used for their full expected 20-year design life). See: Han-Gon Kim, “The Design Characteristics of Advanced Power Reactor 1400” (The International Atomic Energy Agency), https://perma.cc
Our model focused on balancing the demand and supply of electricity. Consumers respond to weather changes by increasing their electricity use to power air conditioning units, fans or heaters. If demand and supply are not balanced, brownouts and blackouts occur, leaving customers without power. Utilities are forced to ration electricity and require consumers to reduce their electricity use if the supply fails to meet the demand.
Demand response programs have historically been targeted toward business and industrial customers, who agree to voluntarily reduce their electricity use during periods of high demand, such as on very hot or cold days.[31] These customers, in return, tend to pay rates lower than residential customers. Utilities have begun, however, expanding demand response programs to residential customers.[32]
It is increasingly common for utilities nationwide to send out warnings to their entire customer base — residential, commercial, and industrial — asking that they reduce electricity use to help avoid systemwide instability.[33] In these residential demand response programs, utilities use incentives, such as small rebates to a ratepayer’s annual bill, to encourage customers to sign up for these programs. They allow the utility to access and disable the appliances in a household that use significant amounts of electricity, like air conditioning units. When wind and solar generation lags on cloudy or windless days, utilities can remotely disable home HVAC systems to reduce overall demand.
If these demand response programs do not work, utilities and regional grid operators could be forced to implement brownouts or blackouts. These would shut down electric service for parts of the grid to avoid a more significant systemic failure. This occurred in Texas during Winter Storm Uri in February 2021. The state’s grid operator imposed systemwide, multi-day blackouts when cold weather pushed electric demand beyond the system’s ability to supply reliable electricity to customers.[34]
Wind and solar advocates argue that by “overbuilding” generation and transmission capacity, as well as rapidly expanding battery storage, it is possible to overcome the inherent intermittency of wind and solar. They argue that the wind will always be blowing, or the sun will always be shining somewhere. If it is a cloudy and windless day in Michigan, the sun or wind could produce electricity in Minnesota or Illinois that could be transmitted to Michigan. Battery backup could also help supply the electrical demand for an area experiencing a cloudy, calm day.
However, this plan overlooks the fact that nearby states are typically impacted by the same weather systems, which tend to produce regional effects. It is unlikely that there will be sufficient wind or solar supply in one state, for example, if there is not enough in adjacent states. Additionally, this level of overbuilding imposes massive costs on utility customers, not only for the costs of building more generation capacity, which requires steel, concrete, copper, construction, transportation, and more, but also for increased utility profits, property taxes and subsidies.
In a December 2024 Substack post, Robert Bryce explained how a “wind drought,” or period of “dunkelflaute,” as it is known in Germany, led to massive increases in electricity prices across large portions of the European Union.[35] Low wind speeds spiked electricity prices across Europe to the highest seen in 18 years.
Bryce explained that Norwegian prices also spiked, even though the nation has ample supplies of reliable hydroelectric, because its grid is interconnected with Europe’s. Dangerous net-zero plans being implemented in Germany that rely heavily on wind and solar have forced the nation to look outside its borders for electricity. High demand spikes prices for all connected nations.
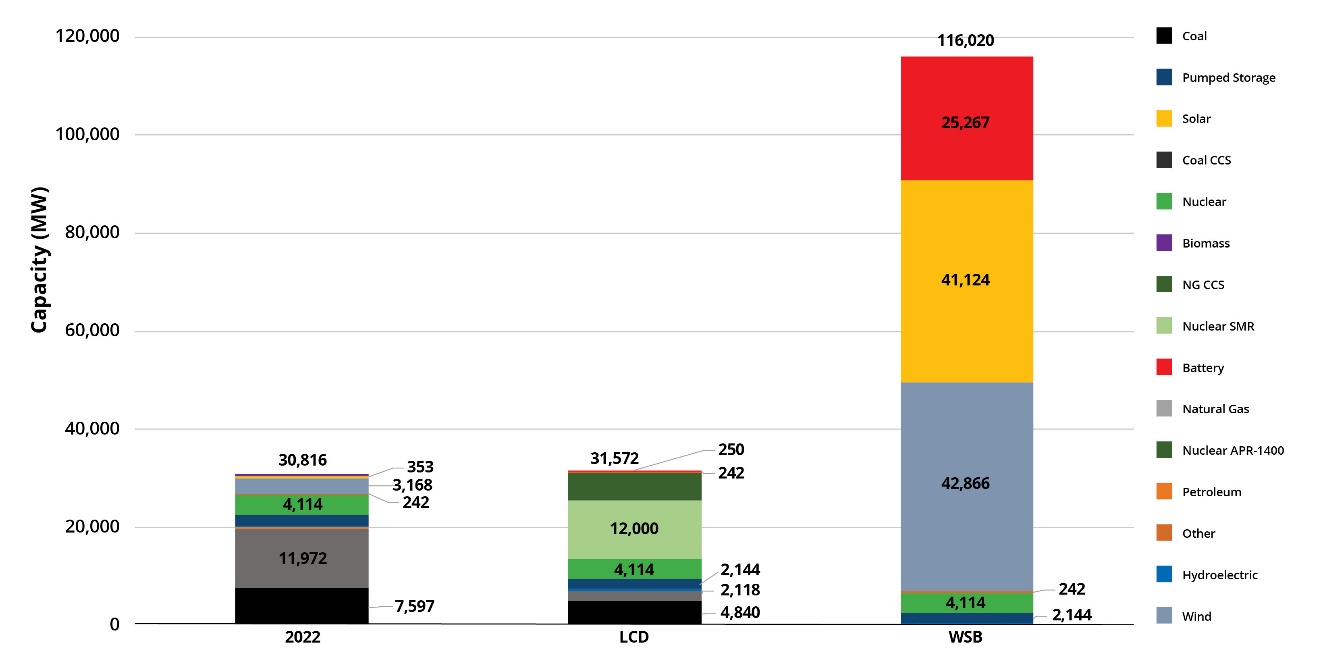
Similar net-zero plans being implemented in the Midwest will mean Michigan will have to build significantly more generation capacity under the WSB scenario to meet real-time demands for electricity. Federal data indicate that Michigan had 30.816 gigawatts, or 30,816 megawatts, of total generation capacity in 2022. Achieving net-zero goals via the WSB scenario would require the state to support 116,020 MEGAWATTS of generation capacity by 2050. This amounts to building and operating 3.76 times more power plant capacity than is currently needed to meet Michigan’s electricity demand.
Our model shows that meeting the 100% wind-, solar- and battery-based plan would require installing and operating more than 13 times more wind generation capacity than the state currently has. It would have to increase from 3,168 megawatts in 2022 to 42,866 megawatts in 2050. Solar generation capacity will have to increase even more dramatically, from 353 megawatts in 2022 to 41,124 megawatts in 2050 — a 100-fold increase. Battery and other storage will need to grow from 2,144 megawatts of pumped hydro storage in 2022 to 27,411 megawatts, including 25,267 megawatts of new four-hour battery storage by 2050.
These generation technologies were selected because they were the most cost-effective means of meeting the carbon dioxide reduction targets and maintaining grid reliability using only wind, solar, and battery technologies.
It's clear the rapid increase in wind and solar generation facilities will require a great deal of land. A 2021 Princeton University study outlined five technical pathways that researchers believed could achieve a federal net-zero goal. The pathways ranged from a low of 0.25 million square kilometers (almost 97,000 square miles) to a high estimate of 1.1 million square kilometers (almost 425,000 square miles).[36] This equates to between 3% and 12% of the nation’s 3.53 million square miles of land.
On the low end — 3% — the study estimates that a land area the size of Illinois and Indiana would be covered by wind installations and an area the size of Connecticut would be covered by solar installations. On the higher end — 12% — wind installations would cover a land area equivalent to the states of Nebraska, Kansas, Oklahoma, Arkansas, Missouri and Iowa. Solar installations would cover land equivalent to the area of West Virginia.

Source: Princeton University
Government officials in Michigan claim the state can meet net-zero mandates using far less land than the Princeton study estimates. In testimony before the Michigan Senate Energy and Environment Committee, Michigan Public Service Commission Chair Dan Scripps explained the amount of land needed to meet the state’s net-zero goals. “The highest number in terms of the amount of acreage of direct land use under a high-growth scenario, again, is about 209,393 acres of new land,” explained Scripps. “That's a big number. But in context, it represents about 0.55% of Michigan's total projected or total area. And so it’s a significant growth — and I am not here to pretend otherwise — over what’s in place today. But it's still about one-half of 1% of Michigan's total land.”[37]
Dedicating more land to wind and solar facilities is already encountering significant local opposition.[*] This will continue if 209,000 more acres of land, at a minimum, are to be developed. This is why the Michigan Legislature passed Public Act 233 of 2023.[38] The law takes wind and solar siting decisions away from townships and counties across the state and gives the Michigan Public Service Commission final authority.[†]
Meeting the requirements of the Whitmer MI Healthy Climate Plan would require Michigan to cover hundreds of thousands of acres of land, using millions of tons of metals and concrete, and spending hundreds of billions of dollars to achieve CO2 reduction targets. At the same time, as it increases resource use and imposes hundreds of billions of additional dollars in unnecessary costs on Michigan residents, the Whitmer net-zero plan will also negatively impact overall grid reliability.
[*] Robert Bryce’s “Renewable Rejection Database” shows that over 60 proposed wind and solar projects have been killed as a result of growing public opposition. See: “Renewable Rejection Database” (Robert Bryce, 2025), https://robertbryce.com
[†] During 2024, a citizen’s initiative attempted to collect signatures to repeal the portions of Public Act 233 of 2023 that removed local control over siting decisions. Called Citizens for Local Choice, the group was unable to gather sufficient signatures to have their ballot initiative included in the November 2024 ballot.
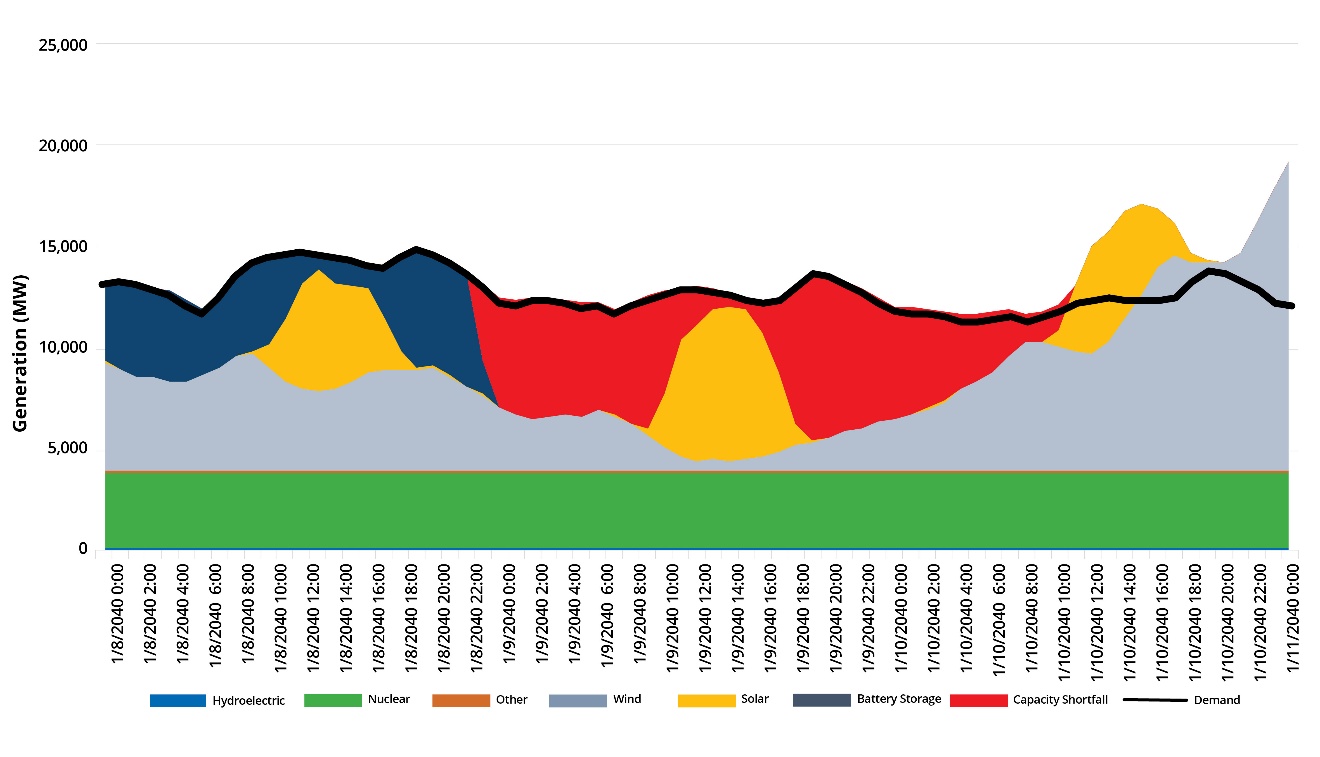
The graph below shows the projected electricity to be generated by each type of resource in the WSB scenario in 2040 during a three-day period in January. It is based on federal data for electricity demand and regional generation data from the Midcontinent Independent System Operator and the National Renewable Energy Laboratory. It uses the actual electricity demand from Jan. 8 through Jan. 10 in 2022 to estimate what the demand might be during those three days in 2040.[*]
These dates were selected because they show a period of high, or peak, electricity demand that is compounded by limited supply, as solar production is limited by Michigan’s overcast winter weather. In other words, this provides a test of the viability of the electricity grid envisioned by the state’s energy plans under normal but straining conditions.
Michigan’s electric grid must be constructed to supply sufficient electricity at all times, including during these peak periods. This requires building a safety margin, or reserve margin, of electricity generation. This reserve margin works similarly to a fall restraint harness or protection for workers who perform tasks at elevation. The harness a worker wears must be rated to hold the worker’s weight plus an additional safety margin. This ensures the harness will always provide enough restraint if a worker falls.[39]
This reserve margin is evident in the graph below. The black line shows predicted demand over the three days. Wind generation is depicted by light blue and varies based on wind speeds. Solar generation is depicted by the orange-yellow color. Solar generation grows from approximately 10 a.m. until it peaks at around 3 p.m. and then declines to zero by early evening, between 5 and 6 p.m.[40] Battery storage is depicted in a dark blue and appears when it is called on to provide backup energy when wind and solar are incapable of meeting electricity demand.
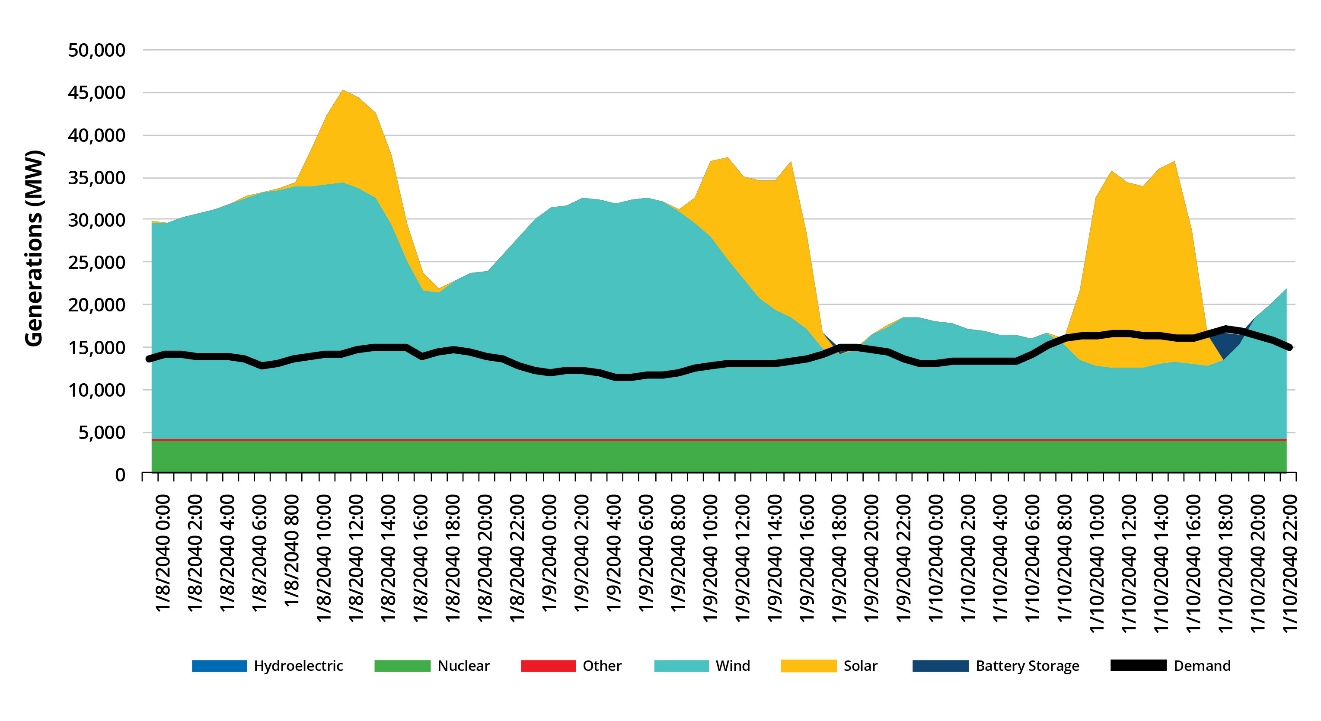
When wind and solar exceed demand (rise above the black line on the graph), the electricity they produce is used to charge batteries. When the batteries are fully charged, additional wind or solar generation must be curtailed — operators must stop exporting the electricity being generated to the grid to avoid system instability.[†] More curtailing will be required to maintain system integrity as net-zero policies encourage utilities to overbuild solar and wind. Curtailment raises the price of electricity.
[*] Modeling 2022 demand levels for 2040 offers a very conservative estimate. We expect electricity demand to be much higher in 2040, due to the addition of electric vehicles, data centers and artificial intelligence, and increased population.
[†] The National Renewable Energy Laboratory describes curtailing as “the reduction of renewable energy delivered due to oversupply or lack of system flexibility.” “The Curtailment Paradox in a High Solar Future,” (National Renewable Energy Laboratory, April 28, 2021), https://perma.cc
Transmission lines are an essential component of the electric grid. With them in good working order, electricity can move from where it is generated to the homes and businesses that use it.
New wind and solar installations require new transmission infrastructure. Turbines and solar panels require large amounts of land, so the most amenable places for locating them tend to be in rural locations.[41] Most electricity is consumed in urban and suburban areas, so new transmission lines are often needed to bridge the distance between where this new electricity is generated and where it is consumed.
The demand for more transmission capacity is expected to grow. A 2021 National Renewable Energy Laboratory report forecasts that as wind and solar increase their market shares beyond 60%, the need for new transmission infrastructure begins to grow exponentially.[42] While this study focused on national data, the results apply to Michigan.
“Demands for new transmission capacity are much greater in the higher renewable generation scenarios,” according to the study. It estimated that the U.S. would need a 58% to 77% increase in transmission infrastructure in under four decades if the state pursue net-zero plans. Researchers estimate the amount of transmission needed to achieve net-zero emissions goals across the U.S. would need “2X to 5X today’s transmission.”[43] As Michigan strives to expand wind and solar to meet net-zero policies, it will also require a great deal of new transmission.

Source: NREL[*]
Michigan’s electric grid will need to rapidly increase its transmission assets to achieve its net-zero goals. Only 9% of electricity demand was supplied by wind and solar in 2022, but our model shows that supplying the state’s electricity needs with wind, solar and battery backup would require increasing that figure to 74% by 2035.
A study conducted by the Midcontinent Independent System Operator suggests that the state will need to build more “extra high voltage” lines. When wind and solar generation contribute more than 35% of the state’s electricity, maintaining system stability will require constructing more transmission lines that can handle 345 kilovolts or more. Once wind and solar reach 50% of the generation mix, the study estimates that 80% of transmission lines will need to be extra high voltage.[44]
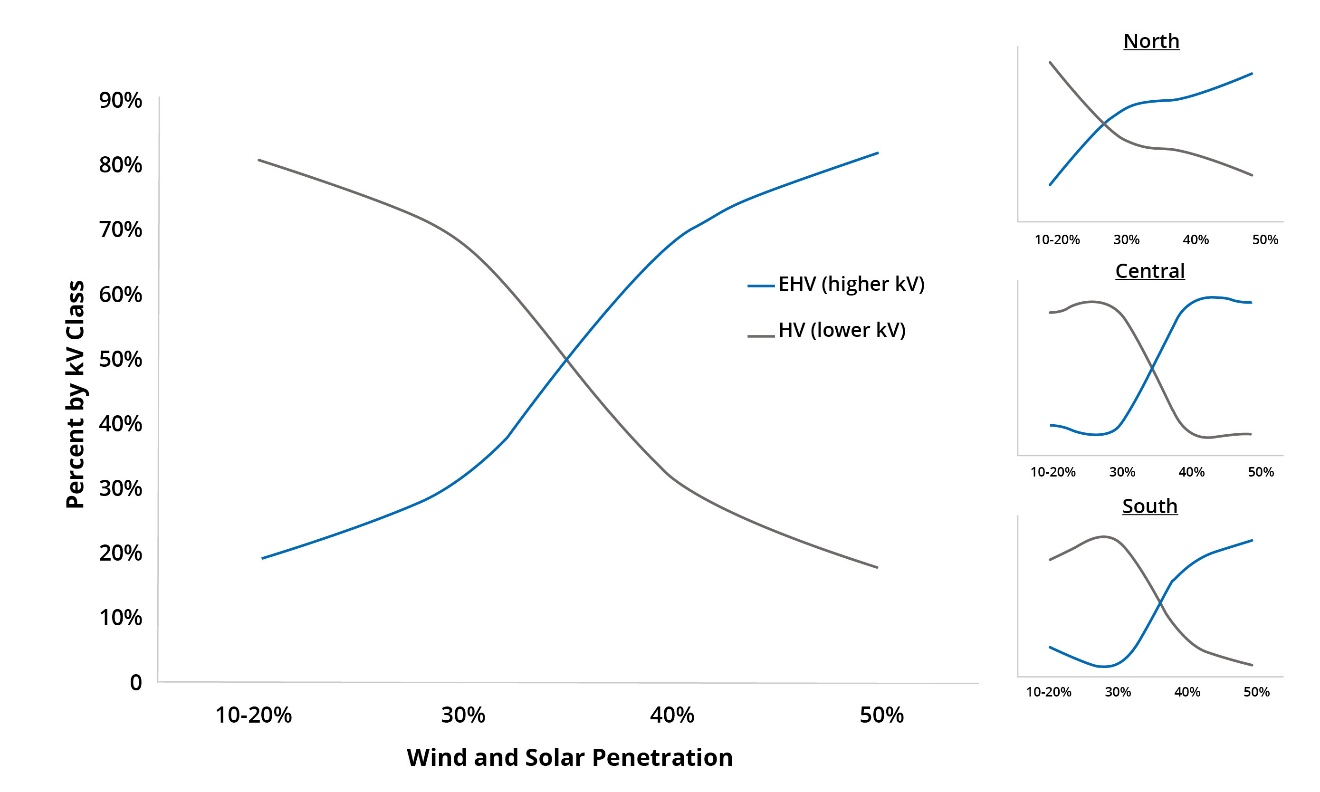
Source: MISO
Michigan currently has approximately 11,000 miles of transmission lines at various voltages.[†] To keep price estimates conservative, our modeling estimated a 51% increase, or 765 miles, to the 1,500 miles of 230 kV lines in Michigan to meet the requirements of the WSB scenario. The model estimates that building this amount of new transmission would cost $6.5 billion.[45]
[*] This graphic shows a growing need for transmission as more wind and solar are built. New interties will be required as more wind and solar are built as those generation resources will need to be tied into the larger grid. An intertie, in the context of electric transmission is a connection between two separate power grids or balancing authorities that allows electricity to flow between them. These are sometimes called tie lines or interconnections.
[†] Xcel reports having 110 miles of transmission line in Michigan (see: https://perma.cc
Investor-owned utilities made up 80% of electricity sales in Michigan in 2021, according to the U.S. Energy Information Administration.[46]
Our modeling predicts that achieving net-zero goals via the WSB scenario would require utilities to spend over $153 billion on new capital investments and infrastructure. Utility profits over the 27-year modeling period will add more than $154 billion to the overall costs of transitioning to a WSB grid.[*] Utility profit makes up the largest single expense in the WSB scenario.
Government-guaranteed profits for constructing new generation infrastructure provide a powerful incentive for monopoly utilities to shutter existing plants ahead of schedule and build new constructions. Every dollar they spend building new wind turbines and solar panels guarantees them about an annual 10% return on all undepreciated assets. Utilities can also receive federal subsidies from the Production Tax Credit and Investment Tax Credit.[†]
This profit scheme, however, effectively pits utility profits against the interests of their ratepayers. Our modeling shows that consumers would benefit far more if utilities simply built clean, efficient, lower cost and reliable natural gas and nuclear plants than erecting wind turbines and solar panels.
These perverse incentives could be curbed if monopoly utilities faced competition from other electricity providers. Michigan legislators could reopen Michigan’s electricity markets to competition by removing the arbitrary 10% cap on the state’s electric choice system. This would expose utilities to competitive pressures, compelling them to operate more efficiently and in the interests of ratepayers.
Policymakers could also mitigate these perverse incentives by limiting how much utilities can profit from building intermittent generation sources like wind and solar. The profits they earn could be based on how much reliable generation capacity the new infrastructure adds to the grid.
For example, the Midcontinent Independent System Operator says wind turbines can be relied on to produce 15.5% of their potential output at any given time.[47] Limiting these profits would mean utilities would only receive profits on 15.5% of the costs of building such turbines, since they provide electricity for ratepayers only 15.5% of the time. Doing this would put the costs of building inefficient and ineffective generation sources on the utility’s shareholders and would likely result in significant shareholder pressure to limit the development of intermittent or nondispatchable generation sources.
[*] Utility profits are so high because they are guaranteed an annual 10% return on equity on all undepreciated assets over the course of the asset’s life. For example, if a utility builds a $1 billion plant that has a lifespan of 20 years, they receive 10% of $1 billion in year 1. Then they receive 10% of 1 billion minus accumulated depreciation, every year for 20 years. (10% of $1 billion in 1 (ignoring staggered rate basing) + 10%*(1 billion – year 1 depreciation) in year 2 + 10%*(1 billion – year 1 and 2 depreciation) … out to year 20.
[†] One study, published by the Brookings Institution, estimates for federal spending on investment and production tax credits for clean electricity generation and storage amount to $131 billion through 2031. See John Bistline, Neil Mehrotra, and Catherine Wolfram, “Economic Implications of the Climate Provisions of the Inflation Reduction Act: Brookings Papers on Economic Activity Conference Drafts” (Brookings Institution, March 31, 2023), 6, Table 1, https://perma.cc
Our model estimated an additional $72 billion in tax expenses under the WSB model and $47 billion with the LCD plan. This additional cost is primarily driven by rising property taxes that utilities must pay as they increase the value of their existing property by upgrading facilities and develop more property for new generation sources. Utilities will pay these taxes by charging ratepayers more for the electricity they use, so the burden of these costs are ultimately borne by Michigan families and businesses.
The Levelized Cost of Energy, or LCOE, is a commonly used pricing metric in studies comparing wind and solar costs with the costs of other generation sources. LCOE is an estimate of the per-unit electricity cost produced over a set period. It is typically represented in dollars per kilowatt-hour or megawatt-hour.
The LCOE metric is, however, a poor tool for describing the costs of various generation technologies.[48] A 2017 Berkeley Labs study explains how “comparing the LCOE of different technologies that provide varying services is misleading.”[49] The report shows how it is difficult to accurately compare the LCOE of a natural gas turbine built to supply peaking loads of electricity to a baseload nuclear facility because the two plants provide different services.
Proper accounting is needed to determine the full cost of replacing reliable coal, natural gas and nuclear generation with intermittent wind and solar. Todd Ramey, senior vice president of markets and digital strategy at the Midcontinent Independent System Operator, explained some of these costs in testimony before a U.S. House Committee. “A lot of focus is put on the ‘free’ fuel that weather-dependent resources enjoy,” explained Ramey. “But that does not translate to free electricity as the cost of construction, backup/reserve generator capacity, and transmission must also be borne by the consumer.”[50]
LCOE values typically do not account for the fact that wind and solar capacity must be massively overbuilt to address their inherent intermittency issues. As our modeling shows, rushed attempts to achieve net-zero with a WSB scenario would require 42,866 megawatts of wind, 41,124 megawatts of solar and 25,267 megawatts of battery backup. That amounts to a total installed capacity of 116,020 megawatts by 2050 to meet Michigan’s projected peak electricity demands.
Our modeling accounts for these additional costs, such as overbuilding and curtailment, and provides a more complete cost estimate for wind and solar than advocates of these energy sources typically use. Our model attributes these additional costs to the wind and solar generators on a per megawatt-hour basis to provide a more apples-to-apples comparison of the cost of providing reliable electricity service.
These costs are then compared to the LCOE of existing natural gas and coal plants operating in Michigan. Data from the Federal Energy Regulatory Commission show Michigan’s natural gas plants generated electricity for $21.93 per megawatt-hour in 2023. Existing coal plants generated electricity for $32.59 per megawatt-hour. Wind is nearly nine times more expensive on average per megawatt-hour than natural gas and more than five times as expensive as coal. Solar is even more expensive when taking into account overbuilding and curtailment costs. It is 12 times costlier than natural gas on average and eight times the cost of coal per megawatt-hour of generation.
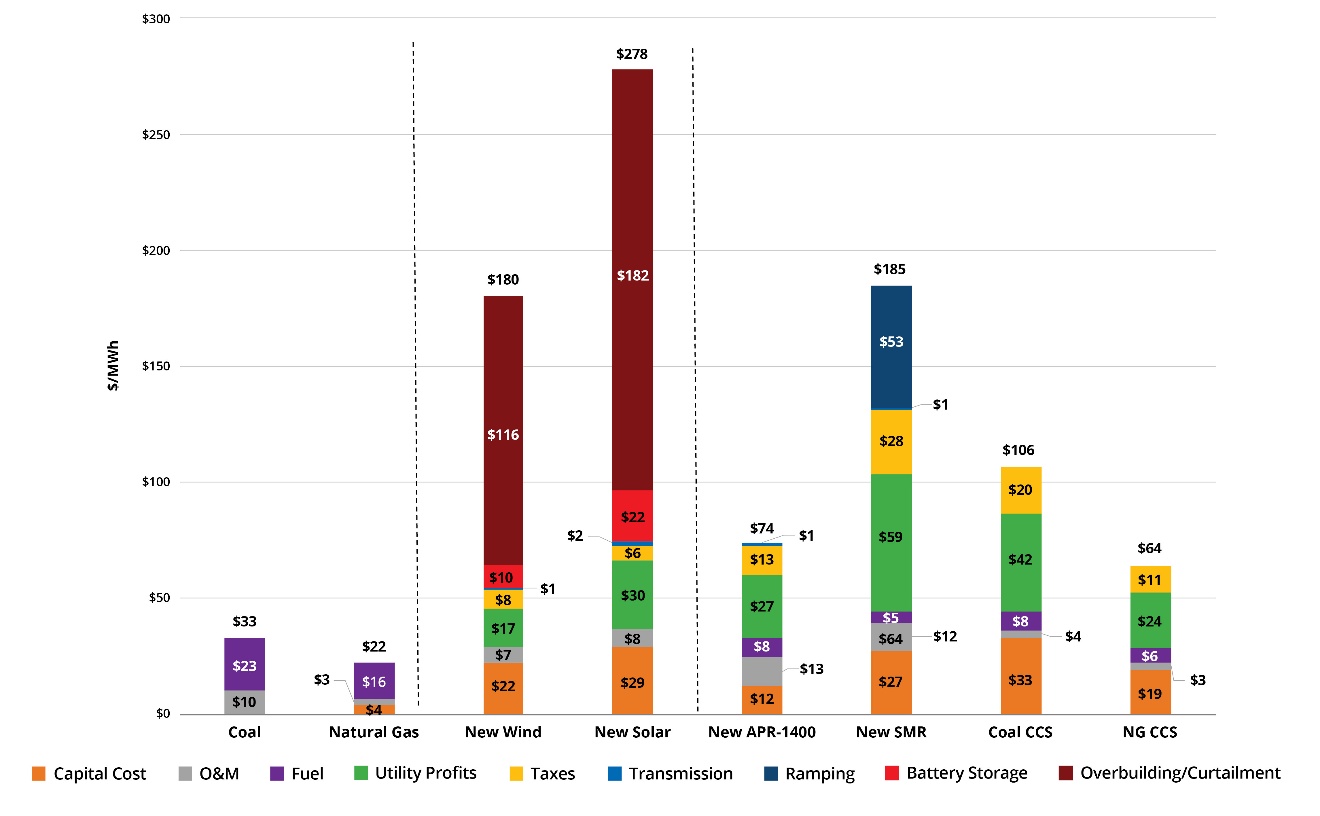
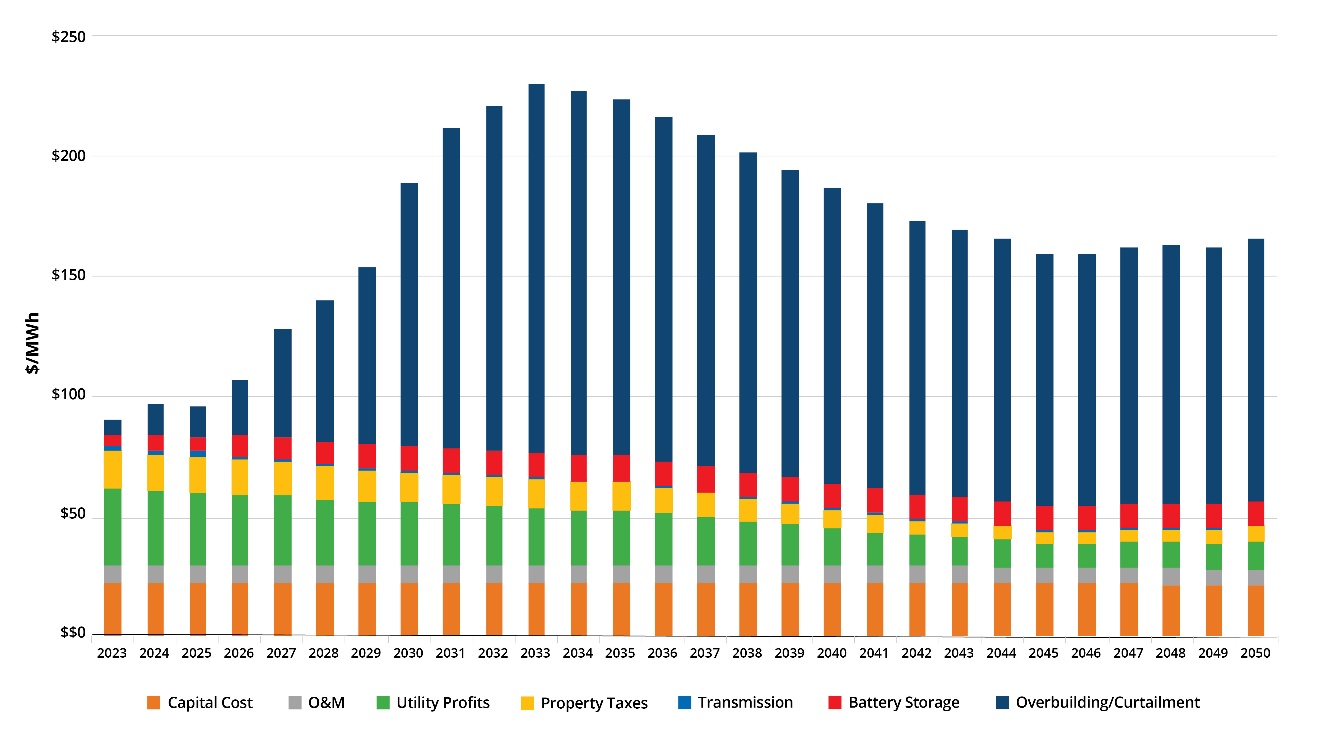
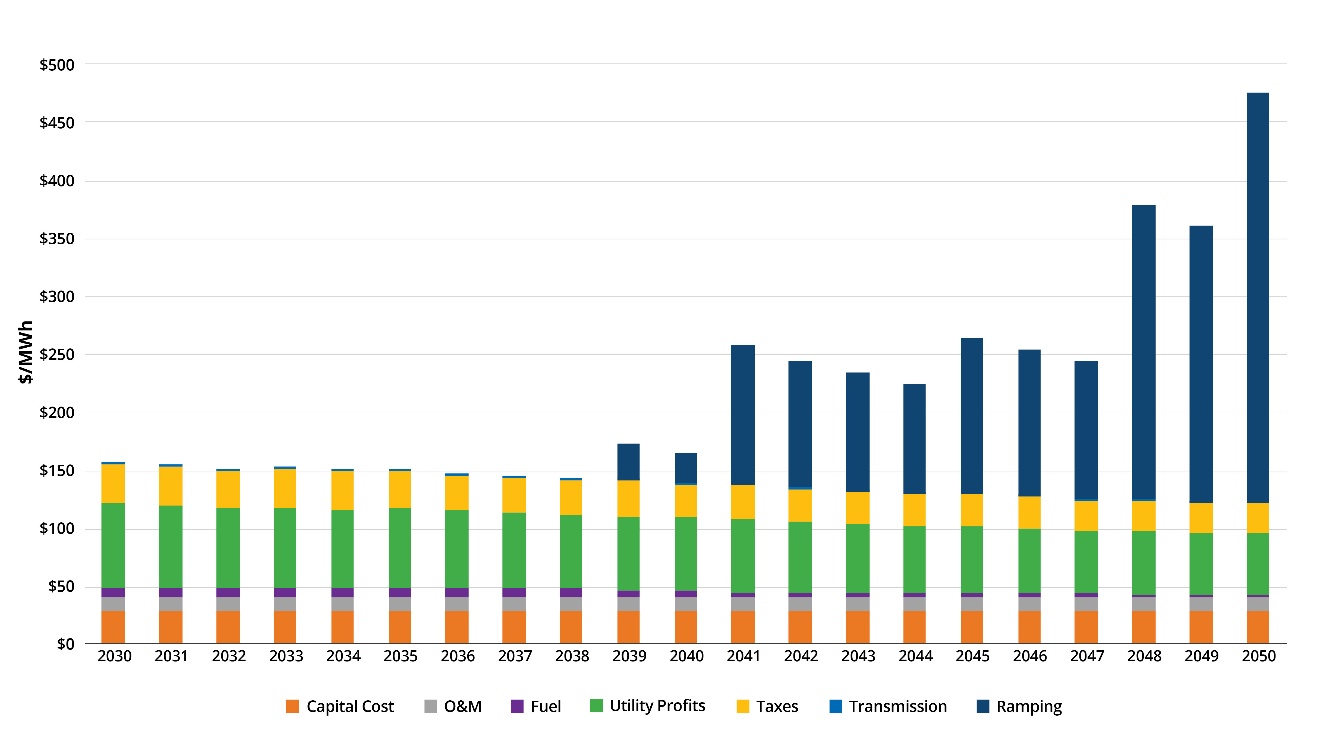
When the full costs of wind are accounted for, initial installation and operation costs were $90 per megawatt-hour in 2023. Costs increase to $231 per megawatt-hour in 2033 as the need for curtailment increases over time. Increased curtailment forces wind and solar to recover costs over fewer megawatt-hours. The expenses associated with overbuilding and curtailment represent the “levelized cost of intermittency, or unreliability.”[51]
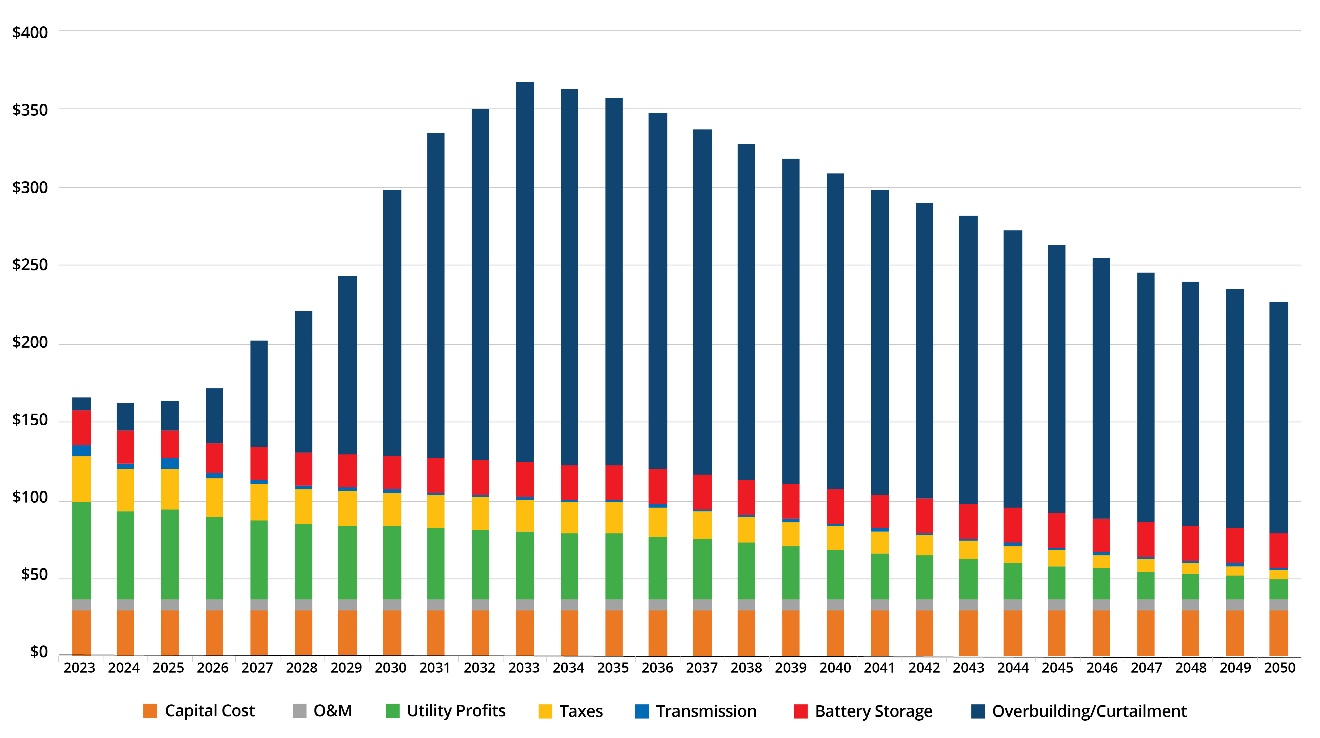
Solar fares even worse than wind when a full accounting of the LCOE is completed. Initial solar costs in 2023 were modeled to be $166 per megawatt-hour. As curtailment impacts increase that price rises to $368 per megawatt-hour in 2033.
The Lower Cost Decarbonization scenario models the costs of meeting Michigan’s electricity needs with reliable electricity from existing coal and natural gas plants plus two types of new nuclear power plants. One is called Advanced Power Reactor, or APR-1400, with the 1400 referring to the megawatts of electricity each unit can generate. APR-1400s have been in use in Korea and the United Arab Emirates for several years, with more planned installations in Poland and the U.K. in the near future. The other type of nuclear plant is known as a small modular reactor, or SMR. These reactors are currently used in China and Russia and are expected to be less expensive and safer to operate than larger reactors. There were 19 countries in 2023 making plans to install SMRs.[52]
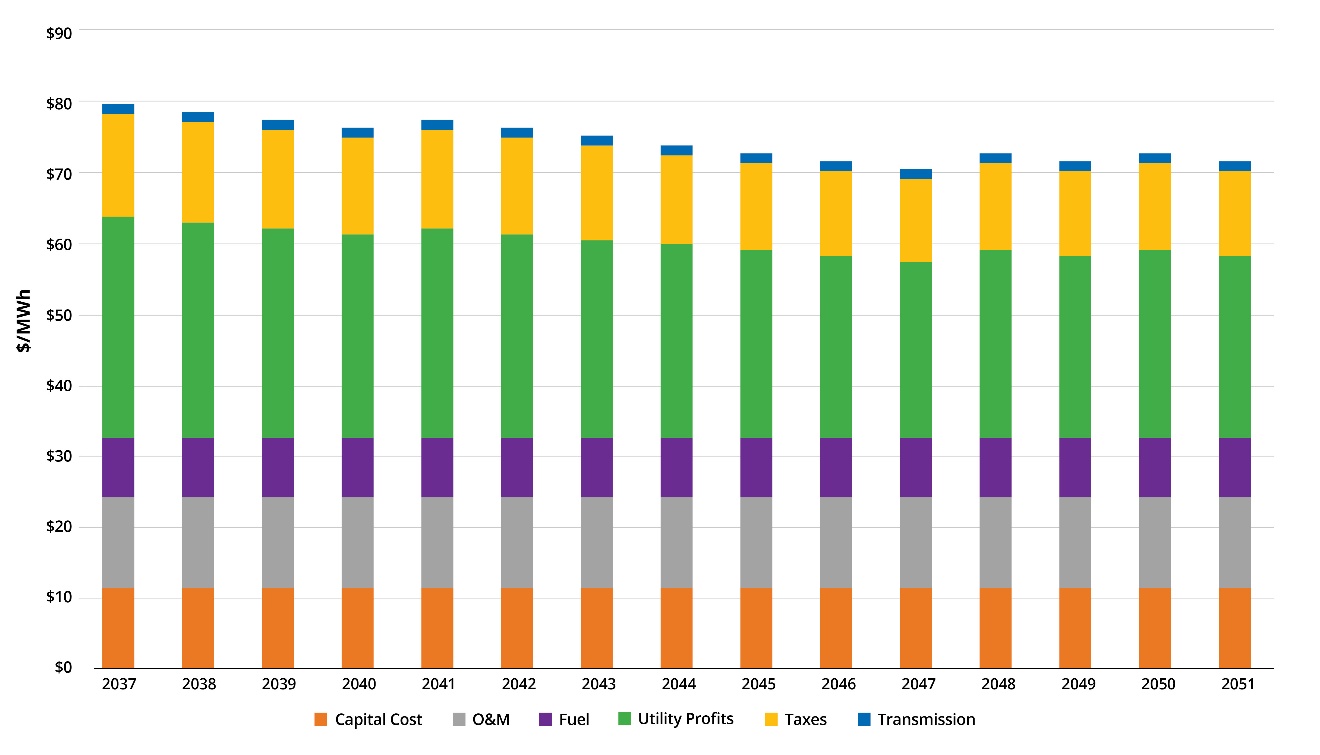
The LCOE for APR-1400 nuclear is $80 per megawatt-hour, as the model forecasts their construction and beginning of operations in 2037. The model also considers the 60- to 80-year life cycle of these plants. By 2050, the LCOE will have decreased to $72 per megawatt-hour.
Nuclear SMRs provide a smaller, more easily ramped up technology. The LCOE for nuclear SMRs is $155 per megawatt-hour, with the model assuming some are brought online in 2030. Increasing costs per megawatt-hour begin in 2039 and peak in 2050, as SMRs take over for natural gas as the primary load-following resource.
Load-following is the practice of adjusting a power plant’s output to address immediate electricity demand fluctuations. For example, electricity demand tends to be lower late at night in the summer when temperatures drop — and air conditioning is needed less often — than in the late afternoon and early evening. Load-following resources like SMRs in these circumstances would be ramped up to produce more electricity in the late afternoon and ramped down at night to produce less to follow this changing demand.
There is no inexpensive way to meet the CO2 emission reduction targets Michigan officials have written into legislation and other state energy plans. They require utilities to operate inefficient and unreliable generation technologies like wind and solar or operate reliable generation technologies like nuclear in an inefficient manner. Ensuring system reliability will entail using SMRs, or another similar power source, as a load-following resource. Operating SMRs in this fashion, however, significantly increases their per megawatt-hour cost. By 2050, these costs will grow to $439 per megawatt-hour, according to our model.
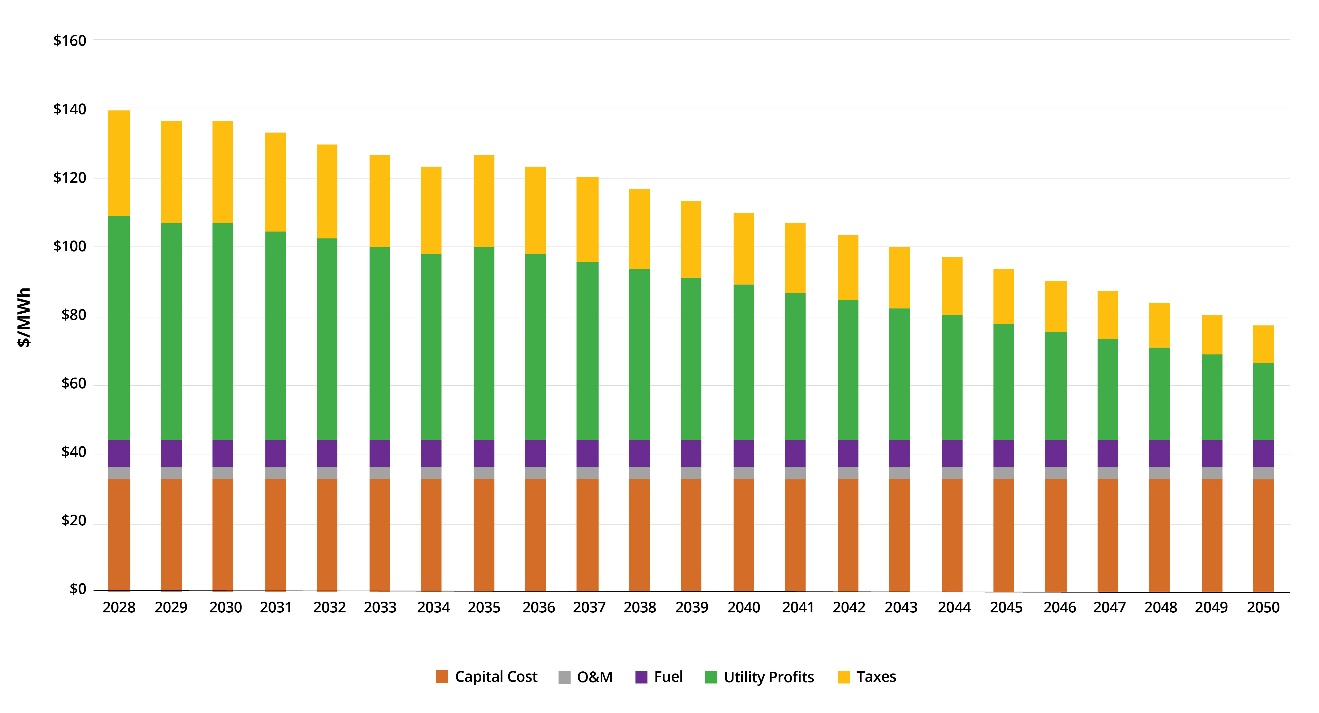
The LCD plan uses existing baseload coal plants for their full intended life to ensure grid stability while APR-1400 generators and nuclear SMRs are being constructed. Capital expenditures, utility profits and taxes all increase as carbon dioxide capture and storage is added to existing coal plants in 2028. Costs to operate these plants will increase to $168 per megawatt-hour in 2028 in response to these expenditures. The LCOE drops to $106 per megawatt-hour for these coal plants in 2050 as the investments are paid down and utility profits and taxes decline.
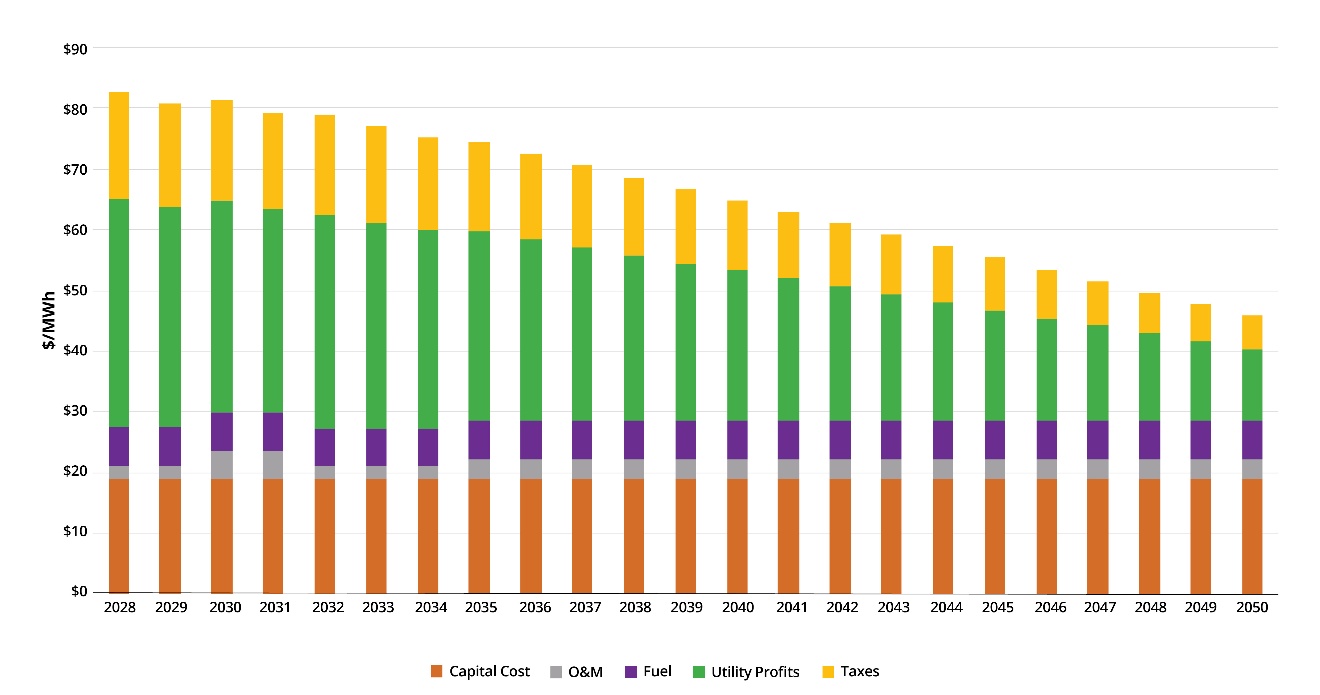
The LCD plan also relies on natural gas plants to maintain grid stability and keep prices low throughout the modeling scenario. Carbon-dioxide capture and storage will be added to two plants in 2028 to reduce carbon-dioxide emissions and meet net-zero targets. As with the coal plants above, capital costs, utility profits and taxes all increase as carbon capture and storage is added to these plants. The initial cost of operation is $96 per megawatt-hour in 2028. As utility profits and taxes decline through the lifecycle of the plants, that cost decreases to $58 per megawatt-hour in 2050.
The WSB scenario’s costs are consistently higher than those in the LCD scenario. The increased costs result from operating a grid that relies heavily on wind and solar generation. This scenario requires building far more capacity and transmission than currently exists in Michigan.
In the Mackinac Center publication “Seven Principles of Sound Energy Policy,” the fourth principle is: “Energy must be reliable to be truly effective.”[53] That principle asks readers to:
Imagine you run a small business and have two full-time employees. One is always available to work and supports the business at any hour. You can predict their arrival at the office by the minute, and they work tirelessly throughout the day. The other employee shows up only one day out of every three or four — even less at certain times of the year — but rarely on a consistent schedule. They might work a few hours one morning and then leave, then come back the next day for an hour in the afternoon. To avoid production stoppages, you’re forced to hire another person — much like the first employee — to fill in when the second employee is unavailable. But this is wasteful when your less reliable employee does show up because now you’re paying three people to do the work that could be accomplished by only two.
In energy terms, fossil fuels and nuclear energy are the first employee. They are there and ready to work whenever energy is needed, and with improving technologies like fracking, we are finding more and more of them to use and making them more efficient and safe at their job. Renewable energy is the second employee. The wind does not blow and the sun does not shine 24/7. So, when renewables can’t meet our energy demand, you still must rely on fossil fuels or nuclear.
An unreliable grid leaves people at the mercy of weather events, which can be deadly during extreme cold or heat. Michiganders are also being pressured to rely more on electricity as other greenhouse gas reduction policies electrify homes, businesses and transportation. This will make generating reliable and affordable electricity in Michigan even more essential.
Meeting the requirements of the MI Healthy Climate Plan using the WSB scenario risks hollowing out Michigan’s electric grid, as the state overbuilds expensive and unreliable generation technologies. Michiganders will be left exposed to routine, but dangerous, extreme weather events, especially during the cold of winter or the heat and humidity of summer.
But none of this is necessary.
Our modeling shows that the wind, solar and battery strategy will lead to expensive electricity and blackouts. In contrast, the LCD scenario achieves most of Gov. Whitmer’s climate goals but avoids blackouts and, while still very expensive, does so at far lower costs. The LCD model shows there is a viable alternative to the wind-, solar-, and battery-based plan advocated by state officials and environmental groups. If policymakers choose this plan, leading to a spike in electricity rates and energy shortages, it should be recognized as a deliberate policy choice.[54]
Our modeling determined the level of wind, solar and battery capacity needed to satisfy projected demand. It predicts the grid would fail to meet demand in 2040 for a combined 71 hours over six capacity shortfall events, or blackouts, in five different months. This is based on the actual demand and weather patterns experienced in 2021. Avoiding these blackouts will be even more difficult if electricity demand increases in Michigan over this period, as can be reasonably expected due to increasing electrification and growing use of artificial intelligence and data centers.
This shortfall is not isolated or cherry-picked. If we use 2020 data to conservatively model projected 2040 demand, a wind, solar and battery grid would fail to meet demand for a combined 142 hours over nine blackout events in three different months. In short, if Michigan policymakers pursue the WSB scenario, more frequent and longer-lasting blackouts are inevitable.
In contrast, no electricity shortfall would occur in the LCD scenario, according to our model. The reliability provided by allowing existing coal and natural gas plants to produce electricity until they are designed to be shut down achieves this.
In the following two sections, we describe two modeled shortfall events in more detail. Both events forecast potential demand in 2040. The first reliability scenario uses electricity demand and weather data from 2021 and forecasts a continuous 36-hour shortfall. The second scenario uses electricity demand and weather data from 2020 and 2022 and forecasts a continuous 61-hour shortfall.
Using the WSB scenario grid, the model projected demand over a three-day period, from Jan. 8-10, 2040, using 2021 demand and weather data. Despite more than 27,000 megawatts of pumped and battery storage, the model predicted a capacity shortfall event for 36 continuous hours. This outage would occur because battery backups were fully discharged, and wind and solar facilities failed to provide enough electricity to meet the demand.
In contrast, the LCD scenario could fully meet demand levels without relying on battery backup, according to the model. There would be no capacity shortfall.
We also modeled projected demand over six days, from Jan. 27 to Feb. 1, 2040, under the WSB scenario. In this reliability scenario, we modeled 2022 wind and solar generation numbers, hourly demand and weather data. Our model determined that the wind and solar with battery backup plan would meet electricity demand in a hypothetical forecast of 2040 needs. In two periods during this reliability scenario — two hours on Jan. 28 and four hours on Jan. 30 — the grid would rely on battery backup to provide electricity to Michigan residents. These batteries would have been charged when wind and solar produced more than the needed electricity demand.
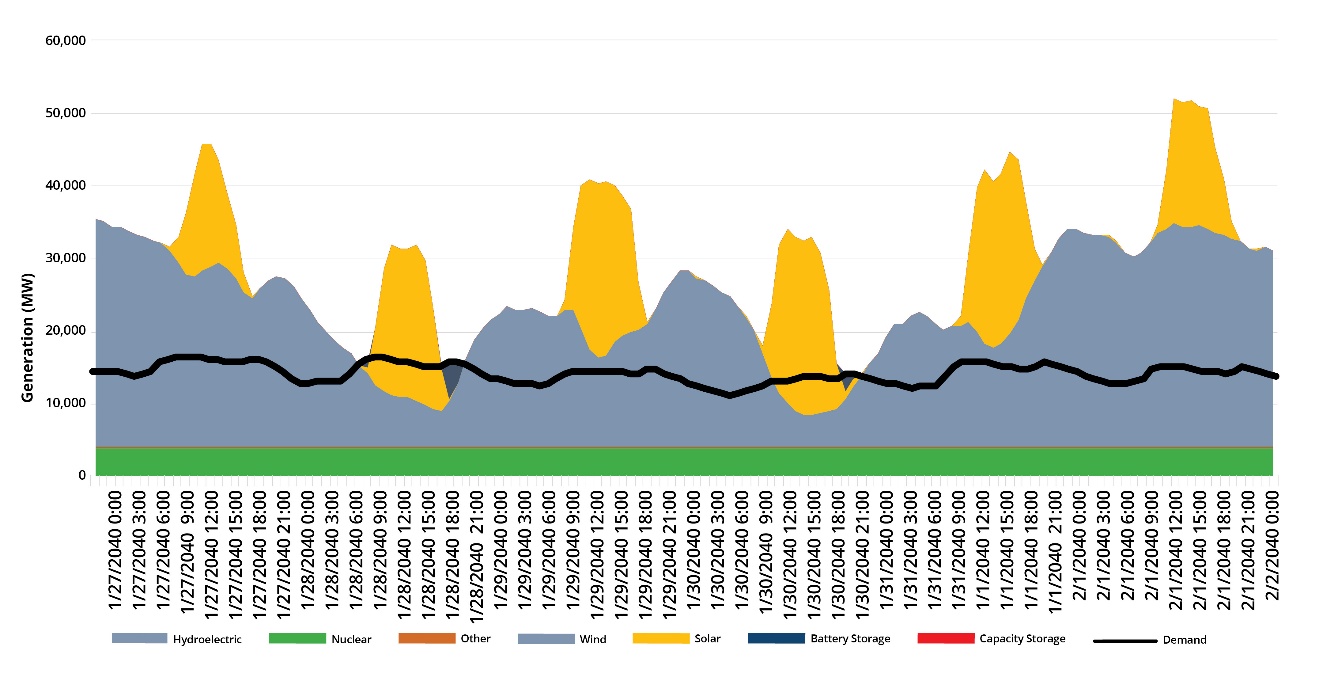
But using 2020 weather data and electricity demand shows a completely different scenario and highlights the severe variability in reliability of wind and solar generation. There would be a combined 61 hours of blackouts over this six-day period according to the model. The cause is simply cloudy and calm weather: Wind and solar generation plummet under these conditions. Solar generation over the period in 2020 is about half of what it was in 2022. Wind fares even worse, producing hardly any power for about a 48-hour stretch. Battery storage would be insufficient to prevent a capacity shortfall for 61 continuous hours, followed soon after by three additional but shorter blackouts.
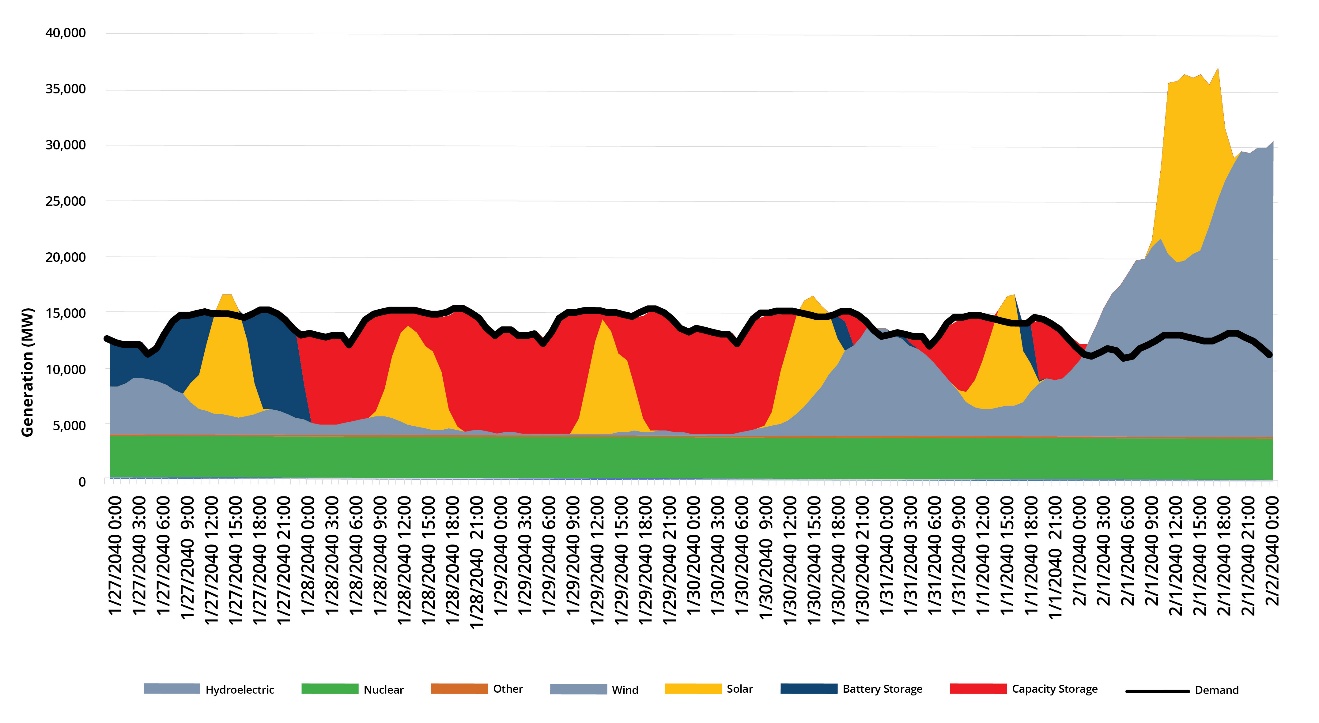
In contrast, no shortfalls would occur under the LCD scenario over the same period and based on the same projections. Shortfall events never occur because the grid can use nuclear APR-1400 plants as a steady baseload energy source while nuclear SMR plants act as a ramping source. The variability of the weather has no impact.
Both reliability scenarios demonstrate that building an electrical grid that relies heavily on variable weather conditions to supply essential electricity could leave the state of Michigan at the mercy of weather conditions.
The LCD scenario provides considerable benefits by avoiding grid instability. The Center of the American Experiment described the costs of blackouts as the “value of lost load” and estimated they cost $14,250 per megawatt-hour of unserved load across the Midcontinent Independent System Operator Region. Extrapolating that cost to the region served by MISO, which includes Michigan, the Center of the American Experiment’s comments submitted to the EPA stated that their “modeling indicates blackouts occurring in the 2019 Historic Comparison Year would cost the MISO region $56.7 billion in the model run years 2028, 2030, 2035, 2040, 2045, 2050, and 2055, or an average of $8.1 billion in each of the modeled years.”[55]
The alleged need for the net-zero plan is to reduce carbon dioxide emissions into the atmosphere to address the impacts of climate change in Michigan and beyond. The MI Healthy Climate Plan lays out seven objectives, repeated verbatim below:[56]
Mitigate the worst impacts of climate change.
Spur economic development and create good-paying jobs.
Protect and improve the health of Michiganders.
Position Michigan as a leader on climate action.
Protect our natural resources and wildlife.
Make Michigan energy independent.
Address environmental injustices.
The Whitmer plan claims to establish “a broad vision for fulfilling the governor’s fall 2020 commitment for Michigan to achieve 100% economy-wide carbon neutrality.”[57] However, there are multiple reasons to question the state’s ability to impact the Earth’s average temperature.
Our modeling indicates that both the WSB and LCD scenarios would reduce carbon dioxide emissions from Michigan’s electricity generation sector. The following graph depicts how much Michigan would reduce CO2 emissions compared to 2022 levels under the WSB and LCD scenarios. Under the WSB scenario, Michigan would reduce its annual emissions of CO2 from approximately 57 million metric tons in 2022 to zero emissions by 2035. Under the LCD scenario, Michigan would initially increase its CO2 emissions slightly as carbon capture technologies were installed on existing plants. Emissions would rise to just over 61 million metric tons in 2027 and then drop to 1.8 million metric tons — a 97% decrease — by 2050.
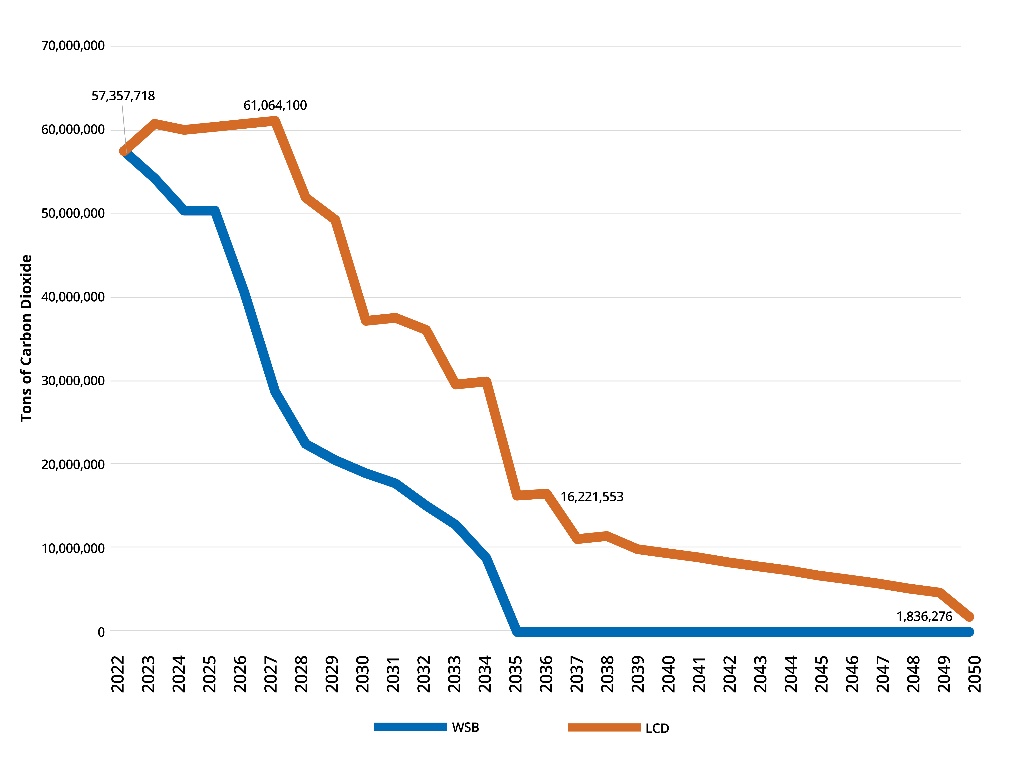
Given the high cost of reducing carbon dioxide emissions from the WSB and LCD scenarios, it makes sense to ask two questions: 1) How much future global warming would these policies prevent? 2) Are these measures worth the cost?
Although the WSB and LCE scenarios use different electricity generation mixes and vary significantly in costs, their potential impact on reducing carbon dioxide emissions is similar. The WSB scenario reduces annual carbon dioxide emissions by 57.4 million metric tons, while the LCD scenario reduces these emissions by 55.5 million metric tons.
To put these cuts in perspective, we compared them to the proposed cuts under the Obama administration’s 2015 Clean Power Plan, which targeted reductions of 730 million metric tons by 2030 across the nation. The Environmental Protection Agency’s indicated that Obama’s plan would reduce global average temperature by 0.019° C by 2100.[58]
The WSB scenario would avert 7.9% of the total emission reductions of the proposed Clean Power Plan, resulting in a potential future temperature reduction of 0.0015° C by 2100. The LCD scenario would avert 7.6% of the emissions of the proposed Clean Power Plan, resulting in a potential future temperature reduction of 0.0014° C. In both cases, the greenhouse gas reductions would have no measurable impact on future global temperatures.
“The social cost of carbon is an estimate of the cost, in dollars, of the damage done by each additional ton of carbon emissions,” according to the Brookings Institution. Brookings describes estimates made by the past three presidential administrations on these costs and notes that “the Obama administration initially estimated the social cost of carbon at $43 a ton globally.” The Trump administration limited their accounting of the potential impacts of CO2 emissions to those occurring within the U.S., arriving at a social cost of “between $3 and $5 per ton.” The Biden administration had initially reworked the calculation to $51 per ton, but Brookings notes, “[I]n November 2022, the EPA proposed a nearly fourfold increase to $190.”[59] Since taking office in January 2025, President Trump has signed an executive order, requiring the Environmental Protection Agency to correct the flawed metric or to cease using it in federal permitting and regulatory decisions.
Our modeling indicated that, under the WSB scenario, the average cost of reducing carbon dioxide emissions would be $305 per metric ton reduced through 2050. This is more than six times the social cost of carbon as estimated by the Obama and Biden administrations. It is 61 times the upper estimate made by the Trump administration. It is even 60% higher than the extreme increase proposed by the EPA in November 2022.
Under the LCD scenario, the average cost of reducing carbon dioxide emissions over the study period would be $227 per metric ton reduced through 2050. Once again, this cost is far higher than the values estimated by the Obama, Trump and Biden administrations, as well as the 2022 EPA estimate.
Neither the WSB or lower-cost LCD scenario pass a cost-benefit analysis of reducing the social costs of carbon emissions. The costs will significantly outweigh the potential benefits.
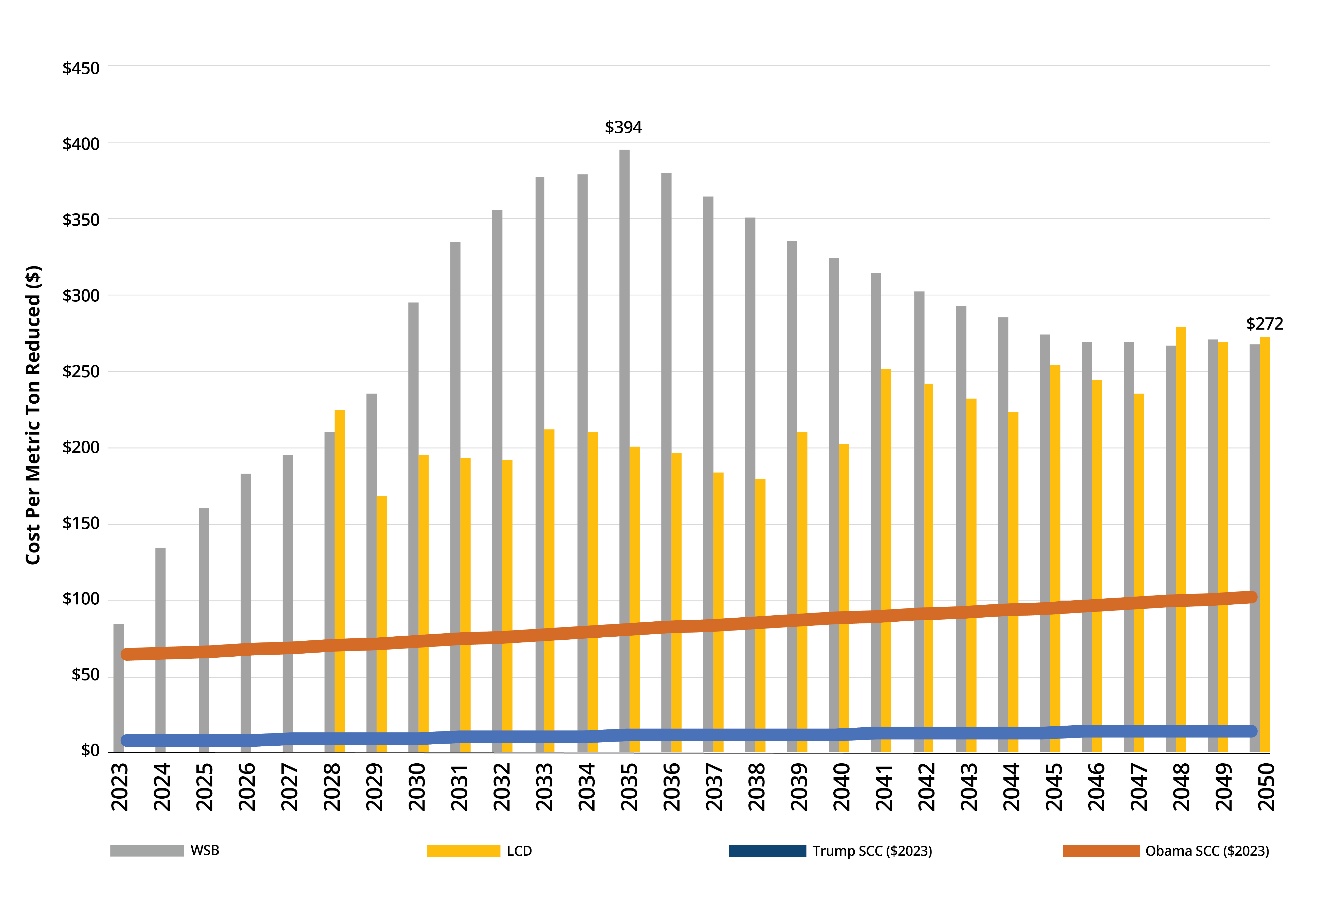
Although fossil fuels release carbon dioxide into the atmosphere, their use has been a boon for human health and well-being. In their report “Bettering Human Lives,” Liberty Energy explains why this is so.
Since the oil and gas industry began in the second half of the 19th century, global life expectancy has doubled, extreme poverty has plummeted, and human liberty has grown tremendously. The timing here is no coincidence. The surge in plentiful, affordable energy from oil, gas, and coal enabled this progress in the human condition.[60]
The MI Healthy Climate Plan outlines a fatally flawed vision of Michigan’s energy future. The state’s net-zero plans ignore the benefits provided by fossil fuels, namely affordable and reliable electricity. While these plans purport to address climate change, its implementation threatens to encumber residents and businesses with skyrocketing electricity costs, jeopardize grid reliability and deliver only negligible environmental benefits. A closer examination of the core issues reveals a serious need for policymakers to repeal and replace this risky venture before it can do any further harm to the state’s grid and economy.
The energy bills passed by the Michigan Legislature in December 2023 commit the state to achieving Gov. Whitmer’s net-zero CO2 emissions goals. These bills mandate that the state rely on unreliable and expensive “renewable energy sources”— primarily wind and solar — to meet 60% of the state’s electricity needs by 2035 and “clean” sources to meet 100% of demand by 2040. While the addition of nuclear to the list of energy sources that can count as “clean” is a good start, the restrictions on the use of natural gas ensure that little to none of this fuel source can be used after 2040. The 60% “renewable sources” requirements represent a naively optimistic 300% increase from the state’s current 15% renewable electricity mandate.
Our modeling reveals serious shortcomings of these net-zero plans that could have far-reaching consequences for Michigan residents and businesses. Gov. Whitmer’s push for net-zero emissions imposes immense financial and operational burdens. Our modeling scenarios demonstrate that achieving net-zero goals will impose between $206 billion and $386 billion in additional energy expenditures on the state by 2050. As the 2023 legislation mandates the state’s electricity demands be met by 60% renewable sources by 2035, the total costs will be closer to the high end of the cost scenarios.
To add insult to injury, these mandates will also expose Michiganders to increasingly unreliable electricity services. Our modeling predicts a strict reliance on wind, solar and batteries to power the state’s economy would lead to multiple energy shortages, or blackouts, with the longest blackout lasting for a continuous 61-hours in Michigan’s winter.
Despite reliability concerns and significant cost increases, net-zero mandates will have no meaningful impact on climate. Our modeling indicates Michigan’s efforts might avert an imperceptible 0.0015° C of global warming by 2100. Rather than ushering in a clean energy revolution, the plan risks making energy unaffordable and unreliable while yielding no meaningful environmental progress.
Michigan’s monopoly utilities have embraced the net-zero energy agenda, evidenced by their plans to prematurely close reliable baseload power plants. DTE and Consumers Energy propose retiring coal and natural gas facilities in favor of intermittent wind and solar sources. Consumers Energy even closed one of the state’s nuclear plants in May 2022, despite the fact that it produced more emissions-free and reliable electricity in its final year of operation than all of the state’s wind and solar facilities combined. Utility plans fail to ensure sufficient generation, exposing the grid to blackouts and Michigan residents to unreliable energy service.
Modeling the state’s electricity future under the MI Healthy Climate Plan shows a dangerous dependence on unreliable generation sources like wind and solar. Achieving a WSB-dominated grid by 2035 would require tens of thousands of megawatts of new wind, solar, and battery capacity. This overbuilding is financially and logistically infeasible and will lead to forced routine curtailment of these new generation sources to avoid further grid instability when they generate too much electricity on days when the weather cooperates. Furthermore, relying on intermittent sources without adequate baseload power leaves the grid vulnerable to prolonged outages, particularly during Michigan’s overcast and cold winters.
The costs of decarbonization under the MI Healthy Climate Plan are staggering. Attempting to achieve net-zero mandates will raise electricity rates for residential customers in 2035 by 53% under the LCD scenario and 146% under the WSB scenario. Our modeling predicts that the average monthly residential electric bill would increase from $118 in 2022 to $290 by 2035 under the WSB scenario or to $180 under the LCD scenario. Rapid increases in utility costs would tend to disproportionately harm Michigan families and businesses on fixed incomes or in low-income communities.
Grid reliability is already a critical concern in Michigan, and the legislation passed to achieve the goals of the MI Healthy Climate Plan exacerbates this issue. The WSB scenario modeled in this report demonstrates that Michigan could face 61-hour blackouts during peak demand periods. This growing instability, and the predicted outages, are unacceptable. They are also completely avoidable, as they are a direct consequence of over-reliance on intermittent energy sources and the rushed closure of reliable and dispatchable power sources.
The MI Healthy Climate Plan aims to reduce CO2 emissions as a climate mitigation measure. But its impact on climate change is negligible. Even a complete transition to carbon-free technologies would result in and global average temperature decrease of just 0.0015° C by 2100. This minuscule benefit does not justify the massive sacrifices required by the plan.
Rather than continuing down the costly and impractical path mandated by Gov. Whitmer’s MI Healthy Climate Plan, Michigan policymakers should adopt a more balanced energy strategy. This report recommends:
Immediately halt the planned early closures of coal, nuclear and natural gas plants. The net-zero plans to rush the closure of reliable baseload power plants will leave Michigan residents at high risk of electric service shortfalls. Michigan legislators should pass an immediate moratorium on the closure of large, reliable generation facilities, at least until equally reliable facilities can replace their entire production.
Create a Reliable Portfolio Standard.
Low-cost estimates for building and operating wind and solar present an overly optimistic picture of the costs of this proposed energy transition. Michigan legislators should require the Michigan Public Service Commission and public utilities to use a “reliable portfolio standard” and factor an “all-in cost” of wind and solar in their energy plans. This would protect the public by requiring utilities to restore the importance of maintaining grid reliability as their primary goal.
Enact an “Only Pay for What You Get” Act.
Michigan legislators should protect residents and ratepayers by allowing utilities to charge customers only for the energy that they can reliably provide. Under the current regulatory system, monopoly utilities that receive state approval can force ratepayers to finance building new generation even if it damages grid reliability, such as with wind and solar projects.
Michigan’s energy future needs pragmatic decision-making. The MI Healthy Climate Plan’s over-reliance on intermittent wind and solar endangers affordability and reliability, while delivering negligible environmental benefits.
Michigan can achieve a more balanced and sustainable energy future by halting premature closures of baseload plants, demanding transparency in energy planning and prioritizing grid reliability. This approach protects residents from undue financial burdens and ensures the state’s energy policies are rooted in practicality and common sense.
The policy recommendations in the MI Healthy Climate Plan rest on questionable assumptions and dubious assertions. Among these are the claim that ongoing changes in the Earth’s climate are unprecedented, dangerously destabilizing and can be blamed solely on the use of fossil fuels. The plan depicts a changing climate as inherently harmful, while an impossibly stable climate is represented as natural, proper and good.[*]
For example, here is the opening paragraph of the executive summary:
The real and costly impacts of the climate crisis are irrefutable and that was especially obvious on the ground in Michigan during 2021. Severe, climate-induced weather events over the summer caused more than one million Michiganders to lose power, some for a week or more. Southeast Michigan was hit by intense rain, causing widespread floods and sewer backups. All this came on the backend of a decade in which our state has experienced massive flooding and dam failures, high water levels and erosion that destroyed public and private property, major crop failures from erratic spring temperatures, and three polar vortexes that challenged Michigan families to keep the heat on.[61]
The MI Healthy Climate Plan repeatedly attempts to link severe weather events to human-caused climate change. However, it fails and amounts to only a questionable defense of the claim that the “impacts of the climate crisis are irrefutable.” These claims are indeed refutable, and the weather events used as examples can be explained as part of a natural cycle.
[*] Recent studies indicate that as much as 40% of the measured warming that is attributed to human consumption of fossil fuels could be caused by the urban heat island effect. That effect is the increased level of warming that occurs in urban areas from cement, asphalt, tree and plant removal, etc. See: Willie Soon et al, “The Detection and Attribution of Northern Hemisphere Land Surface Warming (1850–2018) in Terms of Human and Natural Factors: Challenges of Inadequate Data,” Climate 2023 11(9), 179, August 28, 2023, https://doi.org
The plan blames dam failures on climate change. That claim is both speculative and misguided. Two well-known dam failures in Michigan occurred in May 2020 near Midland, Michigan. Both dams were built in the early 1920s and endured higher precipitation levels many times before they failed.[62]
If these two Midland-area dams failed as a result of “severe, climate-induced weather events,” it is reasonable to question why May 2020, the month in which the dams finally failed, does not even make it into the “Top 20 Wettest Months” list compiled by the National Weather Service for the area in which this dam is located.[63] Why did far more intense rains fall in this area during 1986 when the CO2 concentration was 70 parts per million lower than today?
| Rank | Precipitation (inches) | Month & Year |
|---|---|---|
| 1 | 16.16 | Sept. 1986 |
| 2 | 10.76 | June 2017 |
| 3 | 9.95 | May 1912 |
| 4 | 9.43 | Aug. 2012 |
| 5 | 9.04 | Aug. 1995 |
| 6 | 9.01 | Aug. 1975 |
| 7 | 8.15 | Sept. 1945 |
| 8 | 8.11 | May 2004 |
| 9 | 8.02 | Aug. 2018 |
| 10 | 7.78 | Oct. 1954 |
| 11 | 7.49 | Sept. 1981 |
| 12 | 7.33 | April 2013 |
| 13 | 7.15 | Aug. 1914 |
| 14 | 6.99 | May 1942 |
| 15 | 6.92 | June 1996 |
| 16 | 6.84 | May 1945 |
| 17 | 6.83 | April 1967 |
| 18 | 6.83 | July 1950 |
| 19 | 6.73 | Aug. 2007 |
| 20 | 6.72 | Aug. 1987 |
Source: National Weather Service
Of course, rainfall that spreads over a month may not have been sufficient to cause the failure of these dams. The fatal stress on the dams could also be attributed to a single, intense rain event. However, the 2020 rain event was also not unprecedented. As documented in a previous Mackinac Center report on the 2020 flooding:
The Edenville Dam had survived heavy spring flooding in the past. The National Weather Service reports that 11.89 inches fell on Midland County and 7.69 inches fell in Gladwin County from Sept. 10 to 12, 1986, causing the Great Michigan Flood of 1986. Just three years ago, on June 23, 2017, the NWS reports more than six inches of rain fell across Midland and Bay counties. Preliminary information from the NWS indicates that from May 17 to 19, 2020, Midland County received 4.7 inches of rain, and Gladwin County received as much as eight inches.[64]
Mackinac Center research showed how several errors by numerous parties contributed to the failures, including poor oversight and management by federal and state agencies and a stubborn refusal by the dam’s owner to perform essential maintenance and upkeep.[65] The two Midland-area dam failures were more complicated than a single climate-induced rainstorm, and simplistic attempts to reduce that damage to the combustion of fossil fuels do a public disservice.
The MI Healthy Climate Plan also attempts to connect “high water levels and erosion that destroyed public and private property” along the shores of the Great Lakes with human-caused climate change.[66] However, historical records indicate that a heavy ice pack during the winter combined with a wet spring ensured the Great Lakes were experiencing very high water levels “on the back end” of the most recent decade.
News outlets made similar claims about climate change causing the opposite situation—extremely low water levels — in 2012 and 1988. Back then, media reports warned that supercharged evaporation would be driven by global warming and a high demand for hydroelectric generation.[67]
Following this logic, climate change is responsible for raising and lowering the water levels of the Great Lakes. It’s more likely, however, that media reports overlooked or ignored the fact that water levels in the Great Lakes fluctuate naturally. The media may have missed this reality, but the U.S. Geological Survey data did not. USGS researchers examined sediment cores from the lakes in 2007 and confirmed a “quasi-periodic rise-and-fall pattern of about 160 ± 40 years in duration,” with a shorter 32 ± 6-year fluctuation “superimposed” over it.[68]
Recorded water-level data shows that in June 1886 — about 139 years ago — water levels in Lake Michigan and Lake Huron were at 582.6 feet, about 3 inches higher than 582.35 feet, the ostensibly climate-induced water level in 2019.[*] The same USGS report described water levels of over 583 feet 1,500 years ago and almost 594 feet in 2,500 B.C. While claims that climate change is supercharging flooding and erosion make for good headlines, the records show that changing water levels are a normal part of the natural variability of the Great Lakes system. The current changes in water levels are well within the range of normal fluctuation experienced in the past. Natural changes in Great Lakes water levels should not be misused as fodder to drive massive restrictions and alterations in the state’s energy use.
[*] This section is an extended version of a quote by the author in an October 2019 article. See: Bruce Walker, “Analyst: Great Lakes’ high water levels reflect natural variability” (The Center Square, October 17, 2019), https://perma.cc
The MI Healthy Climate Plan also blames recent electric service outages on a changing climate. However, Michigan’s increasingly unreliable electric service is a more complicated problem. A portion of the blame is due to a mix of poor maintenance of distribution networks. Another portion relates to the rushed transition of the state’s electric grid to unreliable and expensive energy sources, specifically wind and solar. The loss of electric service for more than one million Michiganders in 2021 appears to have been rooted in insufficient ongoing maintenance, especially in distribution services.
National Weather Service data shows that this intense storm was hardly unprecedented. “Numerous reports of downed tree branches, nearly 3,000 downed wires, and over 500,000 power outages put this storm on par with other 21st century Southeast Michigan ice storms, including December 2013 and April 2003,” said an National Weather Service write-up of the storm.[69] The attempts to paint this storm and related damage as caused by climate change are, therefore, unsupportable hype rather than science.
If the outages were due to climate change-induced extreme weather events, then cities in adjacent states and provinces that also experienced the intense winter storm should have seen similar outages. The National Weather Service indicates the same intense weather was experienced in portions of Illinois, Indiana and Ohio. Reporting on the February 2023 ice storm indicated that while over 700,000 Michigan homes were without power in the aftermath, Illinois experienced only 12,000 home outages. Wisconsin, Indiana and Ohio had even fewer, with less than 3,000 homes without power combined between the three states. Minnesota had the least, with only nine outages, despite receiving 21 inches of snow.[70]
The misrepresentations and oversimplification of extreme but not unprecedented weather events as human-caused climate change in the state’s climate plan should not be ignored. Frightening and emotive language is employed — “intense rain,” “destroyed public and private property,” “major crop failures” and “unprecedented cold and ice storms”— to describe these weather scenarios. These supposedly “real and costly impacts” are relied on as the basis for the extensive, unprecedented and expensive changes to the state’s energy policies.
The arguments underlying the MI Healthy Climate Plan are, at best, questionable. Relying on those arguments as a justification for a complete transformation of the state’s electrical system is not justified.
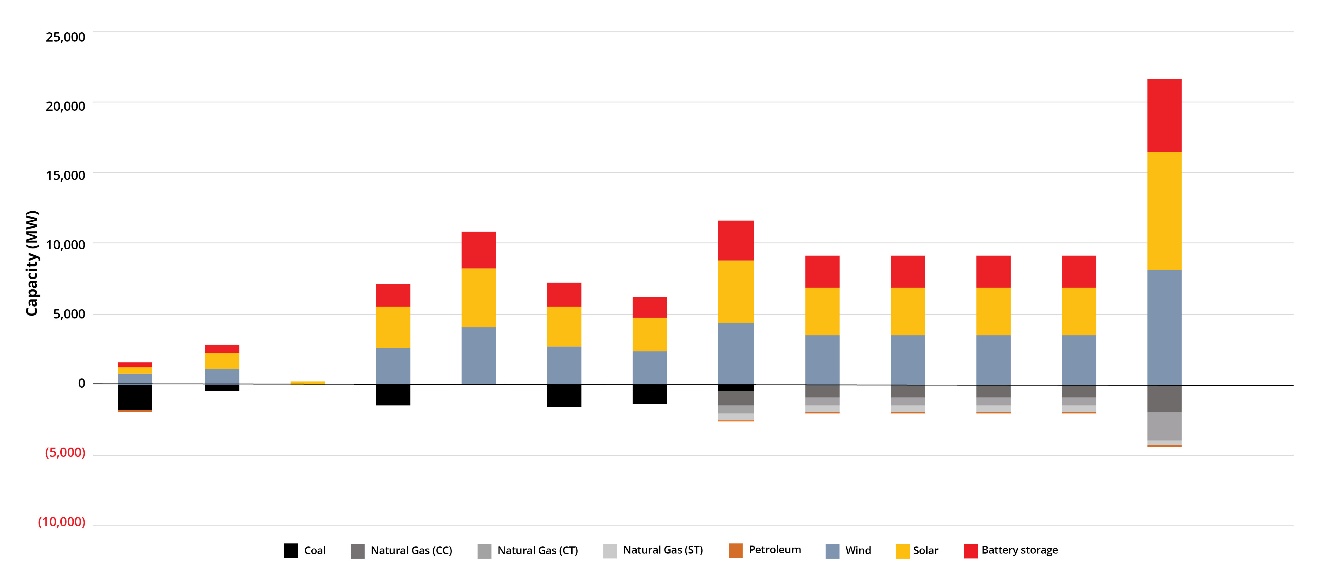
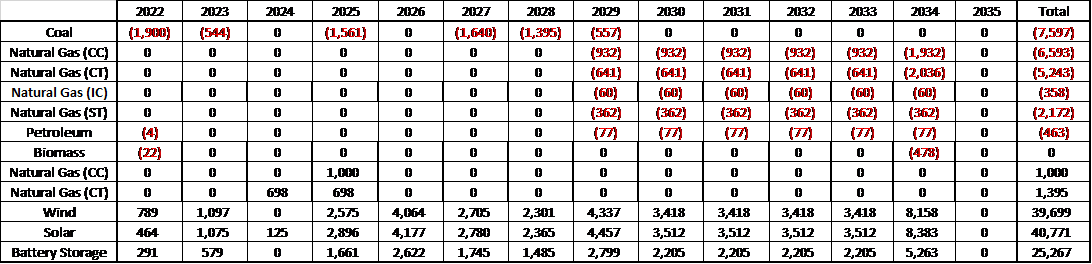
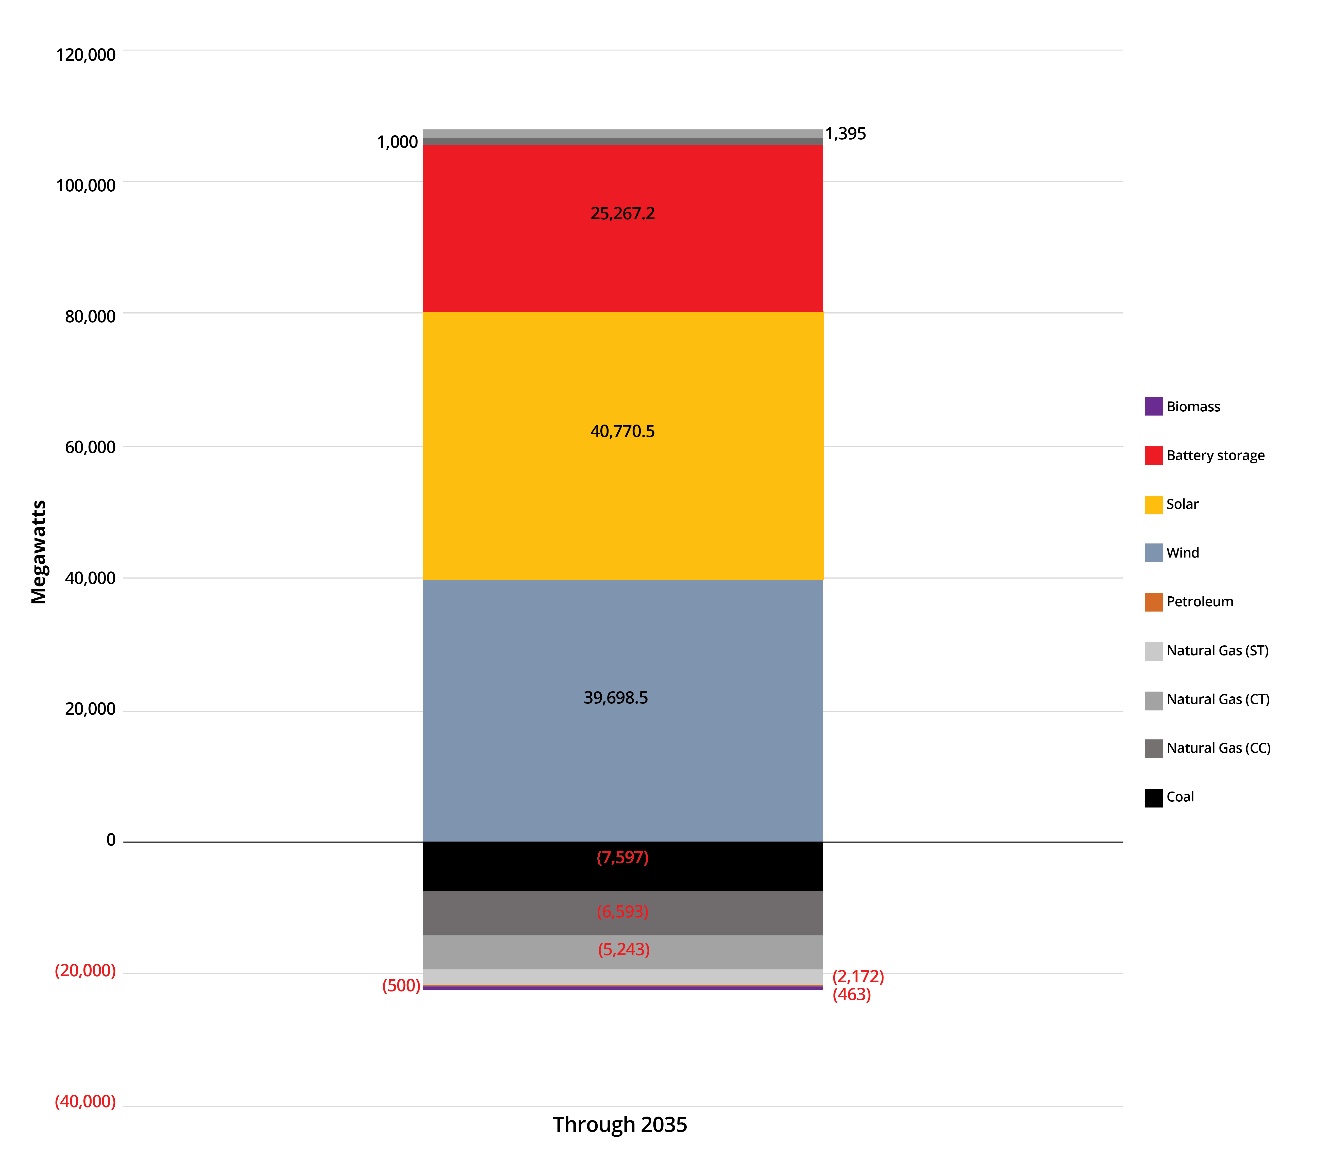
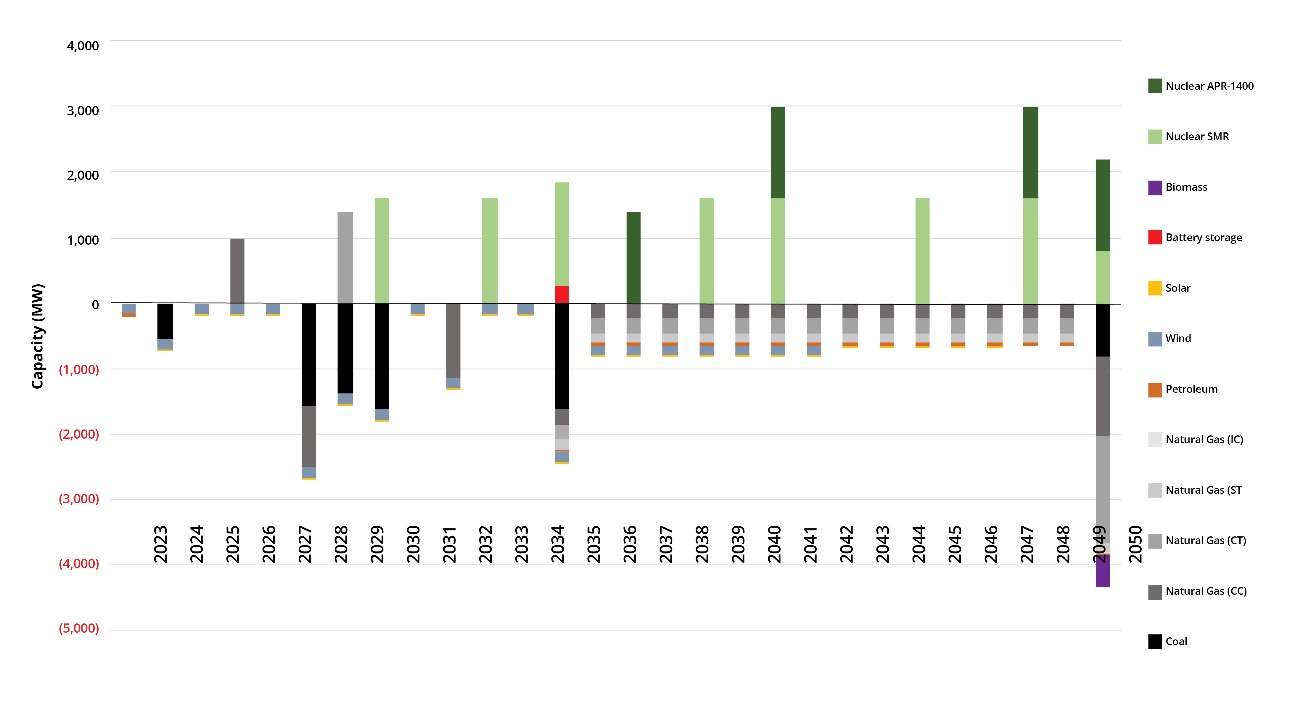
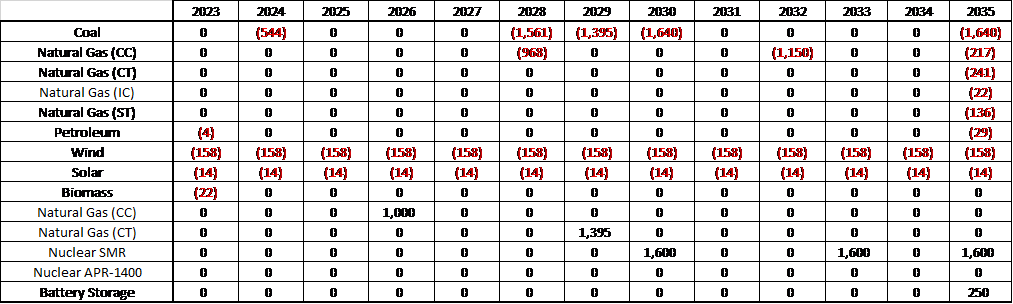
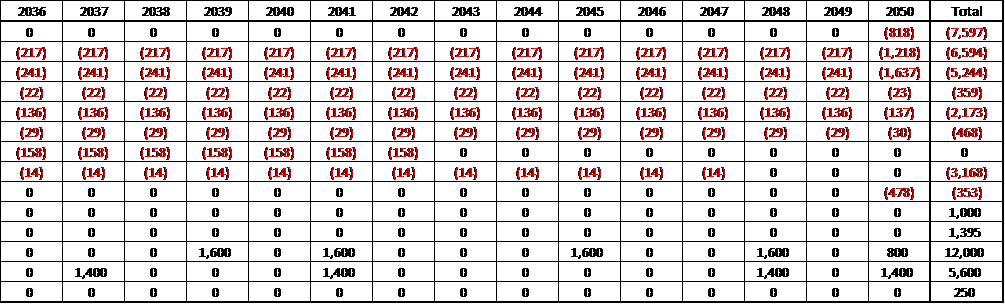
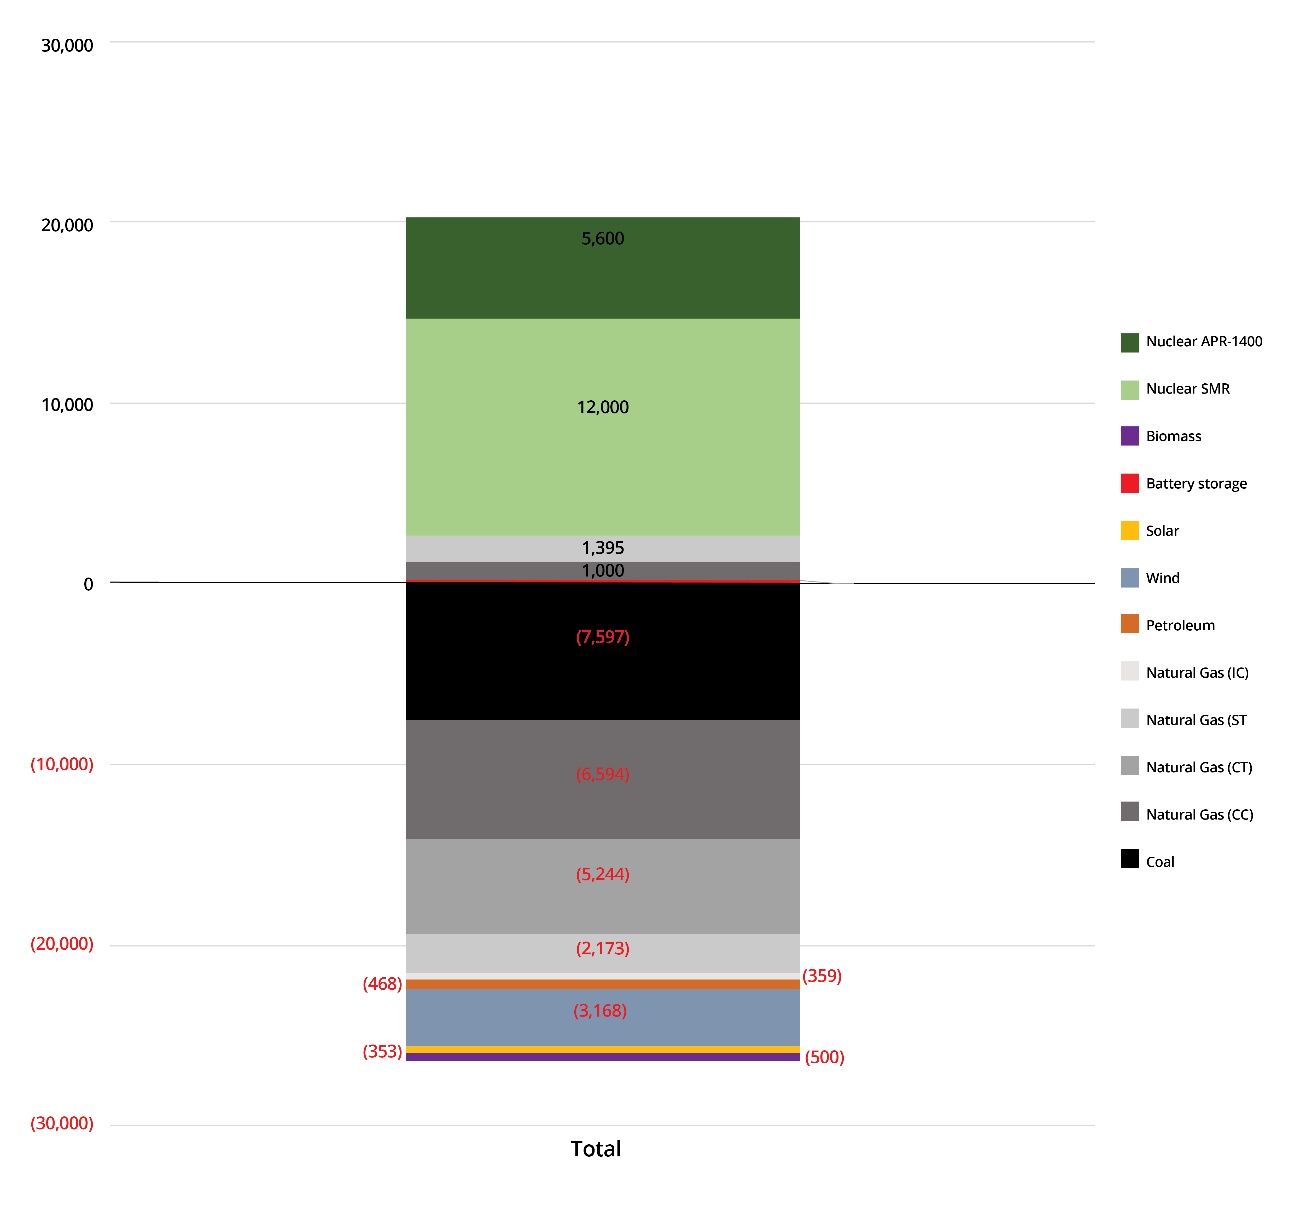
[1] “Planning Year 2022-2023 Wind and Solar Capacity Credit” (Midcontinent Independent Systems Operator, January 2022), https://perma.cc
[2] Jill Lawless, “UK Prime Minister Sunak delays ban on new gas and diesel cars by 5 years in contentious climate shift” (PBS News, Sept. 20, 2023), https://perma.cc
[3] Abby Wallace and Andrew McDonald, “Scottish government abandons flagship climate goal” (Politico, April 18, 2024), https://perma.cc
[4] Kate Yoder, “Why are BP, Shell, and Exxon suddenly backing off their climate promises?” (Grist, February 16, 2023), https://perma.cc
[5] Emma Powell, “BP abandons target to cut oil production” (The Times, October 7,2024), https://perma.cc
[6] Jason Hayes, “Electricity Choice Policy Guide” (Mackinac Center, 2021), https://www.mackinac.org
[7] “Mackinac Center for Public Policy’s Exceptions to the Proposal for Decision – Case No. U-21090,“ (Mackinac Center for Public Policy, March 21, 2022), https://perma.cc
[8] “MI Healthy Climate Plan” (Michigan Department of Environment, Great Lakes, and Energy, April 2022), https://perma.cc
[9] See: "State United for Climate Action" (United States Climate Alliance, 2025), https://perma.cc
[10] “Executive Directive 2019-12” (State of Michigan, Feb. 4, 2019), https://perma.cc
[11] “The Paris Agreement: What is the Paris Agreement?” (United Nations Framework Convention on Climate Change), https://perma.cc
[12] Donald J. Trump, “Putting America First In International Environmental Agreements” (The White House, Jan. 20, 2025), https://perma.cc
[13] “Executive Directive 2020-10" (State of Michigan, Sept. 23, 2020), https://perma.cc
[14] "Executive Order No. 2020-182" (State of Michigan, Sept. 23, 2020), https://perma.cc
[15] “MI Healthy Climate Plan” (Michigan Department of Environment, Great Lakes, and Energy, April 2022), 28, https://perma.cc
[16] House Bill 4759, 4760, 4761: Hearings before the Michigan House of Representatives Energy, Communications, and Technology Committee, 102nd Legislature. June 21, 2023. Testimony of Representative Betsy Coffia, District 103, Traverse City,
https://www.house.mi.gov
[17] "What You Need to Know: MI Senate Democratic Clean Energy Future Plan" (Michigan Chamber of Commerce, April 28, 2023), https://perma.cc
[18] Joey Cappelletti and John Hanna, “States strip local power to block green projects,” (The Iron Mountain Daily News, Jan. 16, 2024), https://perma.cc
[19] "Senate Bill 271 of 2023" (State of Michigan, April 19, 2023), https://perma.cc
[20] "Senate Bill 273 of 2023" (State of Michigan, April 19, 2023), https://perma.cc
[21] “Energy Optimization” (Michigan Public Service Commission, 2025), https://perma.cc
[22] "Senate Bill 277 of 2023" (State of Michigan, April 19, 2023), https://perma.cc
[23] Jason Hayes, “A California Billionaire Sets Michigan’s Energy Policy,” (Wall Street Journal, June 22, 2018), https://perma.cc
[24] “Commission approves settlement agreement on DTE Electric Co.’s integrated resource plan,” (Michigan Public Service Commission, July 26, 2023), https://perma.cc
[25] “About DTE” (DTE Energy, 2025), https://perma.cc
[26] “Belle River gas conversion begins next year,” (1380am WPHM, Sept. 5, 2024),
https://perma.cc
[27] “Michigan’s Clean Energy Future: Net Zero Carbon Emissions by 2050,” (DTE Energy, 2025), https://perma.cc
[28] “Michigan’s Clean Energy Future: Net Zero Carbon Emissions by 2050,” (DTE Energy, 2025), https://perma.cc
[29] “MPSC approves Consumers Energy integrated resource plan settlement agreement, takes additional steps to boost electric capacity,” (Michigan Public Service Commission, June 23, 2022),
https://perma.cc
[30] Isaac Orr and Mitchell Rolling, “The death of a wind farm: Why the United States is No Country for Old Wind” (Thinking Minnesota Magazine, Center of the American Experiment, Aug. 8, 2023),
https://perma.cc
[31] “Commercial and Industrial Demand Response,” (Consumers Energy, 2025), https://perma.cc
[32] “Demand Response: Simple changes add up to energy savings” (DTE Energy, 2025),
https://perma.cc
[33] “California seeks energy conservation for 9th day in heat wave.” (Reuters, Sept. 8, 2022), https://perma.cc
[34] Jason Hayes, “Texas blackouts warning to Biden and all of us: Renewables do play a role in grid problems” (USA Today, Feb. 22, 2021), https://perma.cc
[35] Robert Bryce, “Germany Gets Dunkelf**ked Again, Norway To Dismantle Power Cables To Europe” (Robert Bryce Substack, Dec. 13, 2024), https://perma.cc
[36] “Net-Zero America: Potential Pathways, Infrastructure, and Impacts,” (Princeton University, October 29, 2021), 56, https://perma.cc
[37] James David Dickson, “Scripps: One-half percent of Michigan’s land needed for wind, solar projects,” (Michigan Capitol Confidential, November 8, 2023), https://www.michcapcon.com
[38] Public Act 233 of 2023, (State of Michigan, November 29, 2023), https://perma.cc
[39] “Fall Protection” (Occupational Safety and Health Administration), https://perma.cc
[40] Real-time demand and generation for gathered from “Hourly Electric Grid Monitor” (U.S. Energy Information Administration), https://www.eia.gov
[41] “Wind Power Performance” (Lawrence Berkeley National Labs, September 26, 2022), https://emp.lbl.gov
[42] “Renewable Electricity Futures Study: Executive Summary,” (National Renewable Energy Laboratory, U.S Department of Energy, 2012), 26, Figure ES-8, https://perma.cc
[43] “Net-Zero America: Potential Pathways, Infrastructure, and Impacts” (Princeton University, October 29, 2021), 17, https://perma.cc
[44] “Renewable Integration Impact Analysis Summary Report” (Midcontinent Independent Systems Operator, February 2021), https://perma.cc
[45] “Transmission Cost Estimation Guide for MTEP21” (Midcontinent Independent Systems Operator, April 27, 2021), https://perma.cc
[46] See “Michigan: State Profile and Energy Estimates” (U.S. Energy Information Administration), https://www.eia.gov
[47] “Planning Year 2022-2023: Wind and Solar Capacity Credit,” (Midcontinent Independent Systems Operator, January 2022), https://perma.cc
[48] Jason Hayes, “Renewable Energy is Not Cheaper After All,” (Mackinac Center, January 26, 2018), https://www.mackinac.org
[49] Ryan Wiser, Andrew Mills, Joachim Seel, Todd Levin, and Audun Botterud, “Impacts of Variable Renewable Energy on Bulk Power System Assets, Pricing, and Costs” (Berkeley Labs/Argonne National Laboratory, November 2017), https://perma.cc
[50] Todd Ramey, Senior Vice President Markets and Digital Strategy, Midcontinent Independent System Operator, Inc., “Powering America’s Economy, Security and Our Way of Life: Examining the State of Grid Reliability,” Hearings before the U.S. House Committee on Energy and Commerce Subcommittee on Energy, Climate and Grid Security, September 28, 2023), https://perma.cc
[51] Isaac Orr, Mitch Rolling and Tom Stacy, “The High Cost of 100 Percent Carbon Free Electricity by 2050” (Center for the American Experiment, October 2022), https://perma.cc
[52] Tracey Honney, “IAEA ups support for SMRs” (Nuclear Engineering International, January 18, 2023), https://perma.cc
[53] Jason Hayes, “Seven Principles of Sound Energy Policy,” (Mackinac Center for Public Policy, 2022), https://www.mackinac.org
[54] James David Dickson, “Michigan’s coming energy crisis will be man-made,” (Michigan Capitol Confidential, February 5, 2023), https://www.michcapcon.com
[55] Isaac Orr and Mitchell Rolling, “Comments on New Source Performance Standards for Greenhouse Gas Emissions from New, Modified, and Reconstructed Fossil Fuel-Fired Electric Generating Units; Emission Guidelines for Greenhouse Gas Emissions from Existing Fossil Fuel-Fired Electric Generating Units; and Repeal of the Affordable Clean Energy Rule (Docket ID No. EPA–HQ–OAR–2023–0072; FRL–8536–02– OAR),” (Center of the American Experiment, Spring Issue 2023), https://perma.cc
[56] “MI Healthy Climate Plan” (Michigan Department of Environment, Great Lakes, and Energy, 2025), https://perma.cc
[57] “MI Healthy Climate Plan” (Michigan Department of Environment, Great Lakes, and Energy, April 2022), https://perma.cc
[58] Patrick J. Michaels and Paul C. “Chip” Knappenberger, “Spin Cycle: EPA’s Clean Power Plan” (Cato Institute, August 5, 2015), https://perma.cc
[59] Elijah Asdourian and David Wessel, “What is the social cost of carbon?” (The Brookings Institution, March 14, 2023), https://perma.cc
[60] “Bettering Human Lives” (Liberty Energy, August 1, 2022), https://perma.cc
[61] “MI Healthy Climate Plan” (Michigan Department of Environment, Great Lakes, and Energy, April 2022), https://perma.cc
[62] Jason Hayes, “The 2020 Midland County Dam Failure” (Mackinac Center for Public Policy, August 6, 2020), https://www.mackinac.org/27849.
[63] “Climate: Top 20 Wettest/Driest Months in Southeast Lower Michigan” (National Weather Service – National Oceanic and Atmospheric Administration), https://perma.cc
[64] Jason Hayes, “The 2020 Midland County Dam Failure” (Mackinac Center for Public Policy, August 6, 2020), https://www.mackinac.org
[65] Jason Hayes, “The 2020 Midland County Dam Failure” (Mackinac Center for Public Policy, August 6, 2020), https://www.mackinac.org
[66] “MI Healthy Climate Plan” (Michigan Department of Environment, Great Lakes, and Energy, April 2022), https://perma.cc
[67] Tom Gantert, “Newspapers, Experts Agree: Climate Causes Plummeting, Record High Water Levels,” (Michigan Capitol Confidential, February 22, 2020), https://www.michcapcon.com
[68] Douglas A. Wilcox, Todd A. Thompson, Robert K. Booth, and J.R. Nicholas, “Lake-Level Variability and Water Availability in the Great Lakes—Circular 1311” (U.S. Geological Survey – National Water Availability and Use Program, 2007), https://perma.cc
[69] “Environment: February 22nd 2023 Winter Storm” (National Weather Service), https://perma.cc
[70] Janelle D. James, “Michigan has far more power outages this week than other Midwest states” (Bridge Michigan, February 23, 2023), https://perma.cc