Corporate Average Fuel Economy standards require automakers to meet a minimum average fuel efficiency threshold for the vehicles they manufacture and sell in the United States. This study uses the latest available data to estimate the costs and benefits of CAFE standards and explores whether fuel economy can be improved in a more economically efficient way. It finds that the CAFE program harms American automakers' competitiveness and that the costs of these standards likely outweigh their benefits.
Corporate Average Fuel Economy standards require automakers to meet a minimum average fuel efficiency threshold for the vehicles they manufacture and sell in the United States. Despite these standards being first enacted in 1975 as part of the Energy Policy and Conservation Act, they remained essentially unchanged until the Energy Independence and Security Act of 2007.[1] There is now renewed interest in the standards, and now is a good opportunity to evaluate their effectiveness. This study uses the latest available data to better estimate the costs and benefits of CAFE standards and explores whether fuel economy can be improved in a more economically efficient way.
CAFE standards took effect in 1978. The fuel efficiency of the average passenger car sold in the United States in 1975 was approximately 13.5 miles per gallon.[*] “Passenger cars” includes vehicles such as sedans, station wagons and sports cars. When they were first created, the regulations required an automaker’s new passenger car fleet to average a minimum of 18 mpg by 1978. This requirement was gradually increased to 27.5 mpg by 1985. In 1979, a separate standard was created for light trucks, which include minivans, pickups and SUVs. Two-wheel-drive light trucks had to meet a minimum standard of 17.2 mpg, while four-wheel-drive ones needed to average at least 15.8 mpg. A combined light truck standard for two- and four-wheel-drive trucks was created in 1982 at 17.5 mpg, which was increased to 20.5 mpg in 1987.[2]
The 1975 law called for CAFE standards for passenger cars to increase every year from 1978 until 1986. In 1986, the standard was lowered from 27.5 mpg to 26 mpg but raised to 26.5 mpg in 1989 and then to 27.5 mpg in 1990, where it remained until 2011. A similar pattern followed for light trucks: The standards increased annually after the original law was passed, but they remained about the same from the late 1980s until 2004.[†]
Not every vehicle an automaker makes needs to meet the CAFE standards on its own. Instead, it is the manufacturer’s fleet that must meet the standard.[‡] Average fleet mileage is calculated separately for an automaker’s domestic and imported fleet and for its passenger cars and light trucks. “Domestic fleet” is defined as vehicles containing over 75% domestic content, defined as parts originating in the United States.[3]
Automakers that fail to meet CAFE standards are subject to a penalty of $55 for every one mpg under the standard for each car they sell.[4] A 2016 rule increased this penalty to $14 for every 1/10th of a mile under the standards, or $140 per mile. But under the Trump administration, the National Highway Transportation Safety Administration first delayed then sought to roll back the increase. A coalition of states and environmental groups, led by the state of New York, objected to the rollback, filed suit. New York prevailed at the U.S. Circuit Court for the 2nd Circuit, effectively reversing the rollback.[5]
Automakers can bank the miles by which they exceed one year’s standard and apply them to deficiencies in the previous three years, or up to five years in the future.[6] The Energy Independence and Security Act of 2007 also establishes a provision by which automakers that exceed the requirement in a given year are credited with miles they can bank for future years or sell to automakers who fall short.[7] This gives automakers such as Toyota and Honda an incentive to continue to improve their fleet’s fuel economy, even though they historically exceed CAFE standards, as they can sell their surplus credits to automakers that fall short.[8] A credit-trading program also reduces the cost of complying with the standards, as automakers that can improve their vehicle mileage at a low cost can bank credits and trade them to automakers that can only improve vehicle mileage at a higher cost.[9]
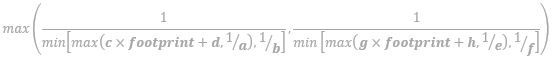
After 2010, the National Highway Traffic Safety Administration changed the standard for passenger cars and light trucks from a single one to variable standards based on a vehicle’s “footprint.” A footprint is defined as the area of the rectangle made by a vehicle’s four tires, when they are touching the ground, measured in square feet.[10] As the vehicle’s footprint increases, the mileage standard the vehicle must meet decreases, and vice versa, with the mileage standard for all footprints increasing over time. The CAFE standard for a vehicle is determined with a mathematical formula based on vehicle footprints.[§] The goal behind the footprint-based CAFE standards is to prevent automakers from meeting the mileage requirement by reducing vehicle size and weight, and thereby, reducing vehicle safety.
Carnegie Mellon University engineering professor Kate S. Whitefoot and University of Michigan engineering professor Steven J. Skerlos find that the footprint-based CAFE standard gives automakers an incentive to increase vehicle size and weight. They estimate that this increases vehicle size between 2% and 32% and decreases fuel efficiency by 1% to 4%. This incentive is larger for light trucks than for passenger cars, which increases the safety risk for the latter because they are more vulnerable in accidents involving light trucks. University of California-San Diego and National Bureau of Economic Research economist Mark R. Jacobsen points out that the footprint-based standard increases the cost of the CAFE standards program. The reason is that automakers can no longer meet the mileage standard by reducing vehicle size and weight, which may be the low-cost way to meet the standard. Instead, automakers must meet the standard by investing in new mileage-improving technology at higher cost.[11]
Another potential goal of shifting to a footprint-based standard is to offset the competitive advantage that CAFE standards give foreign automakers, such as Toyota and Honda. These automakers were already producing smaller, more fuel-efficient vehicles than the Big Three, which allowed them to meet CAFE standards at a lower cost. The footprint-based standard provides the Big Three an opportunity to meet the standards even with their larger, less fuel-efficient vehicles.[12]
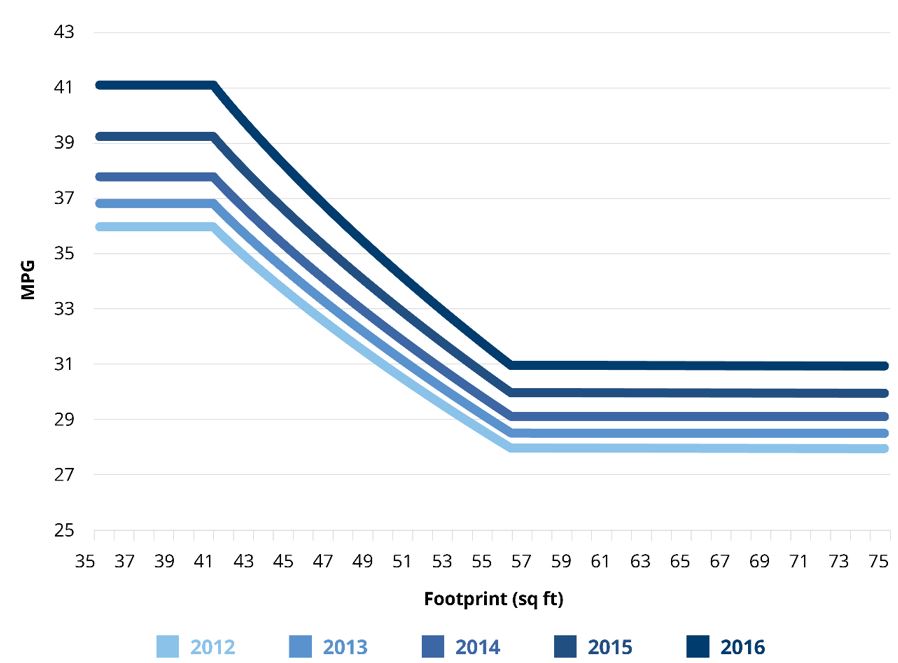
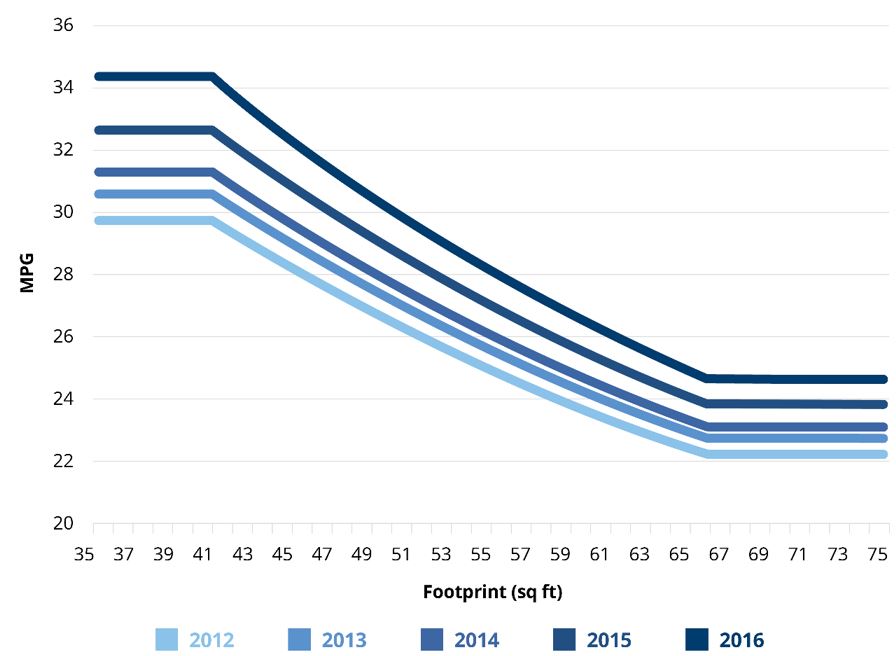
The mileage standard in the new vehicle market for any given year depends on how many vehicles are manufactured at a given footprint. The goal of the Energy Independence and Security Act of 2007 was to increase the average projected new vehicle mileage across passenger cars and light trucks to 35 mpg by 2020, meaning the mileage standards for each footprint increases over time, as Graphics 1 and 2 illustrate.[13]
Graphic 1: Footprint-Based CAFE Targets, Passenger Cars, Model Years 2012-16
Graphic 2: Footprint-Based CAFE Targets, Light Trucks, Model Years 2012-16
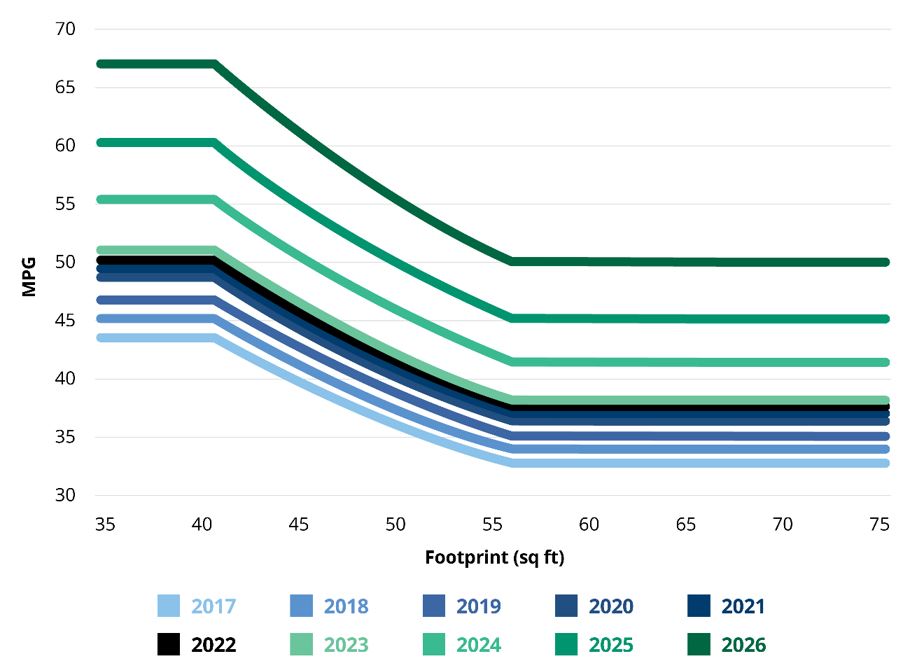
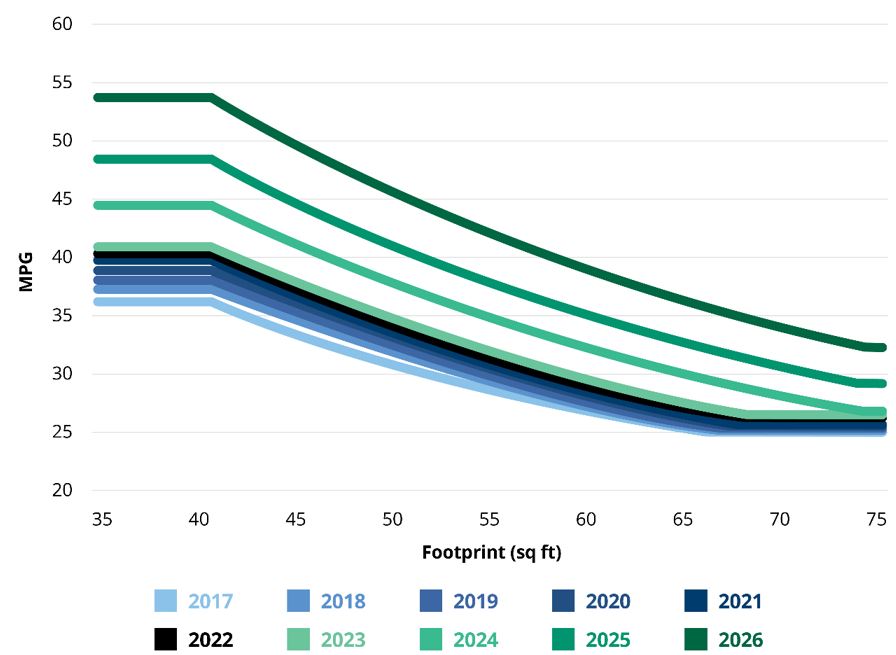
President Barack Obama announced in 2011 that CAFE standards would be increased to a projected average of 54.5 mpg across passenger cars and light trucks by 2025, following the same footprint-based system.[14] The Trump Administration rolled this back to 43 mpg, but this rollback was undone by the Biden administration.[15] Rules enacted in late 2021 will raise the standard to 55 mpg by the 2026 model year.[16] Graphics 3 and 4 illustrate.[**]
Graphic 3: Footprint-Based CAFE Targets, Passenger Cars, Model Years 2017-26
Graphic 4: Footprint-Based CAFE Targets, Light Trucks, Model Years 2017-26
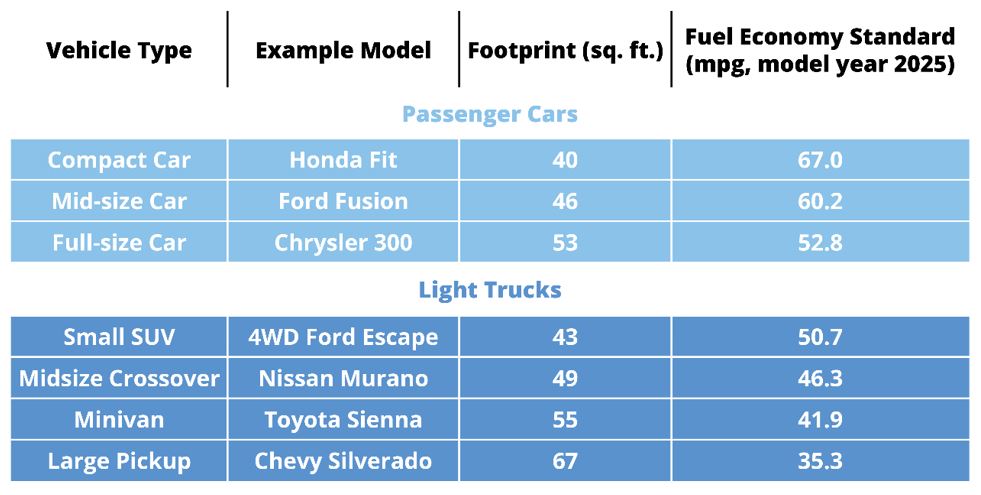
The final CAFE standards rule provides some examples of vehicles at various footprints, which Graphic 5 illustrates.[††]
Graphic 5: Vehicle Types, Footprints and Model Year 2025 Fuel Standards
[*] A “passenger automobile,” according to the definition in federal regulations, is a vehicle “manufactured primarily for use in the transportation of not more than 10 individuals.” “Non-passenger automobiles” are vehicles designed to carry more than 10 people, provide more space for carrying cargo than passengers, or have four-wheel drive. U.S. 49 CFR §§ 23.4-5.
[†] The reason for the momentary drop in standards is that General Motors and Ford were falling short of CAFE standards and thus would be subject to a substantial fine. For GM, the fine was estimated to be $400 million, or 10% of its 1985 profit. For information on the fine, see Robert W. Crandall “Why Should We Regulate Fuel Economy at All?” The Brookings Review, 3, no. 3 (1985): 3-7, https://perma.cc
[‡] The fleet average is the production-weighted harmonic mean. The formula for CAFE standards is: Σwi / (Σwi/fi) where wi is the number of vehicles i, produced, while fi is the measured fuel economy of that vehicle. Σ is the summation symbol, which is a call to add up production and fuel economies for all vehicles in the manufacturer’s fleet. For example, suppose a manufacturer has two vehicles, a and b, with vehicle a getting 25 mpg and vehicle b getting 30 mpg. Suppose the manufacturer produces 2 units of a and 3 units of b. The harmonic mean would be (2+3)/(2/25+3/30)=27.8, which would then be compared to the CAFE standard. For more information on a harmonic mean, see “What is a Harmonic Mean?” (Investopedia.com), https://perma.cc
[§] The formula for the mileage standard is: 1⁄min[max((c*footprint)+d,1⁄a),1⁄b] where a is the upper limit in mpg, b is the lower limit in mpg, c is the slope of the linear function relating mileage to footprint (in other words, how the mileage standard increases as footprint decreases), while d is the intercept of the linear function. Both c and d are in gallons per mile. Parameters a, b, c and d are set by the Department of Transportation and the Environmental Protection Agency, in consultation with automakers, for each year. The formula and parameters for years 2012-16 for cars and light trucks are available in the Federal Register (see pages 1049, 1053, and 1061). It is available in draft form here on page 107: https://perma.cc
[**] Parameters a, b, c and d for the formula given in the previous footnote for model years 2017-26 can be found on pp. 63190-63191 of the Federal Register: https://perma.cc
[††] Table I-6, page 62648 of Volume 77, Number 199 of the Federal Register (October 12, 2012) gives the specific vehicles and their footprints, with mileage presented in Graphics 3 and 4, https://perma.cc
There are two purported benefits of CAFE standards: improved vehicle mileage and reduced carbon dioxide emissions. The latter assumes that, on net, CAFE standards reduce gasoline consumption. If, on the other hand, consumers drive more miles because of owning more fuel-efficient cars, the impact on emissions would be reduced or even canceled out.
The Pew Environmental Group credits the CAFE standards program with vehicle fuel-efficiency improvements, and it blames a lack of additional progress on the federal government’s failure to increase the mileage standard.[17] But this ignores the role that gasoline prices play in shaping consumer preferences for fuel efficiency. When gasoline prices rise, consumers increase their preference for lighter, more fuel-efficient vehicles. Automakers respond to this new demand by producing more fuel-efficient vehicles. When gasoline prices fall, consumers tend to shift their preferences toward larger, heavier, less fuel-efficient vehicles, to which automakers also respond.
The National Research Council’s Committee on the Effectiveness and Impact of Corporate Average Fuel Economy Standards found that before 1985, when crude oil and gasoline prices were rising, technological improvements for both passenger cars and light trucks were concentrated on improving fuel efficiency. After 1985, as crude oil and gasoline prices were falling, technological improvements were concentrated on other performance characteristics, such as acceleration. The committee notes that after 1985, vehicles became 20% heavier and the average 0-60 mph time dropped by 25%.[18] This suggests that the effect of CAFE standards on overall average fuel efficiency is influenced by the relative price of gasoline: The standards will be less effective when gasoline prices are low or falling.
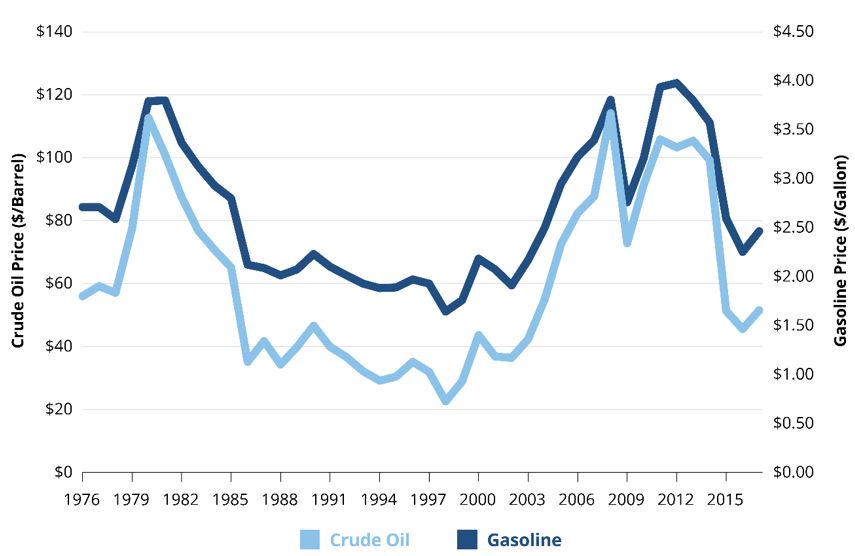
Graphic 6 plots the price of crude oil and the price of gasoline from 1976 to 2017.[*] Since crude oil is the main input for manufacturing gasoline, it is not surprising that the two prices move closely together. There were two price spikes in the crude oil and gasoline markets in this timespan. The first occurred in the mid-1970s, following the Middle Eastern oil embargo, and then again in 1979, following the Iranian Revolution and overthrow of the Shah. Crude oil and gasoline prices remained at a high level throughout the early 1980s due to collusion by the Organization of Petroleum Exporting Countries. Prices then declined in 1986 as Saudi Arabia increased its crude oil production and OPEC collusion broke down. Except for a price spike in 1991 due to the Persian Gulf war, crude oil and gasoline prices remained low until the early 2000s, when global demand, particularly from China and India, pushed prices up. Crude oil and gasoline prices then decreased until around 2014, when the fracking revolution increased the supply of crude oil from nontraditional sources. Crude oil and gasoline prices were low until 2021.[19]
Graphic 6: History of Crude Oil and Gasoline Prices, in 2018 Dollars
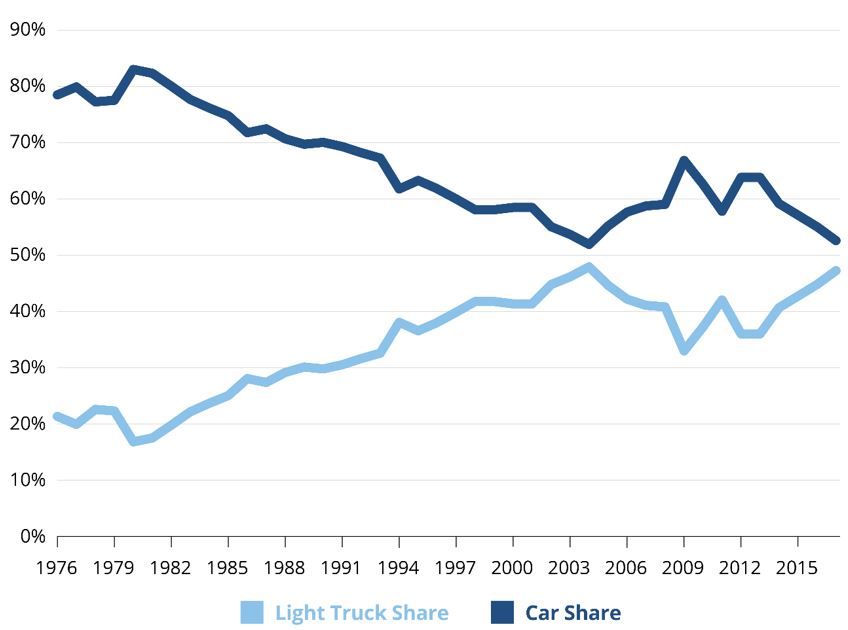
Given that purchasing fuel is a significant cost of operating a car, the price of gasoline influences the type of new car consumers choose to buy. This is illustrated by the mix of light trucks and passenger cars produced, which is shown on Graphic 7.[20]
Passenger cars rose from 78% of total vehicle production in 1976 to 84% in 1980, following an increase in the price of gasoline. A similar trend emerged during a more recent period of relatively high gasoline prices: Cars rose from 55% of total vehicle production in 2002 to 67% in 2009. Light truck production moved in just the opposite direction, increasing in the 1980s and 1990s as the price of gasoline was either flat or falling. It again increased after 2014, when gasoline prices began falling following the fracking revolution. Thus, the price of gasoline drives consumer preferences and, in turn, vehicle production. This conclusion is supported by several academic studies, which show that consumers account for expected increases in gasoline prices when purchasing a new vehicle.[21]
Graphic 7: Light Truck and Passenger Car Production as a Share of Total Vehicle Production
Disentangling the effects of CAFE standards on improved vehicle mileage from the price of gasoline is complicated because CAFE standards have only been increased when the price of gasoline was rising. The stated motivation for increasing CAFE standards is to reduce the country’s dependence on foreign oil and reduce greenhouse gas emissions.[22] However, an unstated motivation might be for politicians to “do something” in response to the increasing price of gasoline. As the National Research Council points out in the introduction to a 2002 report, “Fuel economy is attracting public and official attention in a way not seen for almost two decades. Gasoline prices have risen sharply over the past two years and fluctuated unpredictably.”[23]
Requiring producers to make cars with higher fuel efficiency can give voters the impression that higher gasoline prices can be fully offset by improved mileage, because consumers may need to buy gas less frequently. But the cost of improved fuel efficiency is buried in the purchase price of the vehicle. President Obama, for instance, claimed that increasing the CAFE standard to 54.5 mpg is equivalent to lowering the price of gasoline by $1 per gallon, which ignores this hidden cost.[24] This could explain why elected officials use CAFE standards to force mileage improvements when the consensus in the academic literature is that the same improvements could be obtained at a fraction of the cost by using a gasoline tax.[†]
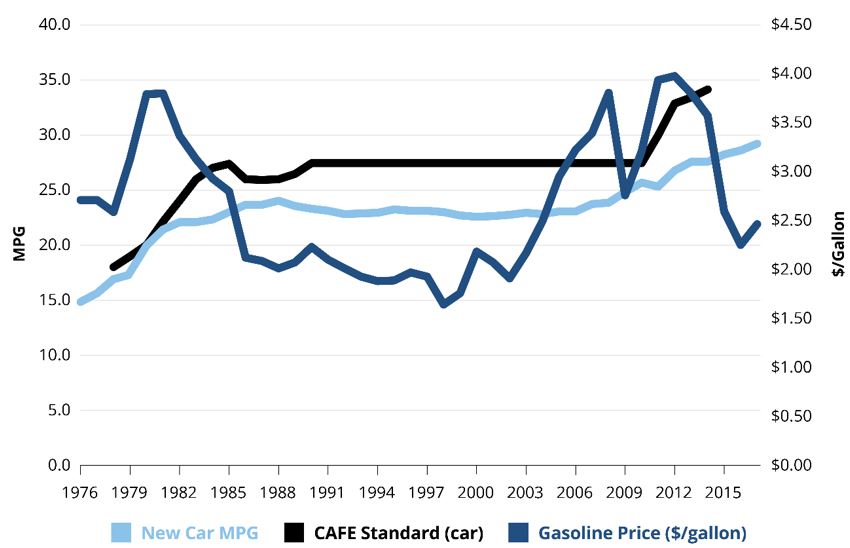
Graphics 8 and 9 plot the history of miles per gallon for new cars and new light trucks, along with the price of gasoline and CAFE standards.[‡] The graphic plots “real world mpg” over time, which is different than the “2-cycle 55/45” test the EPA uses to calculate mpg for purposes of CAFE compliance. The EPA acknowledges that the 2-cycle test does not accurately reflect real world driving and thus conducts a second test that calculates miles per gallon using more realistic driving conditions. [25] The 2-cycle test inflates miles per gallon by an average of 21% for passenger cars and 22% for light trucks over the time in the graphic. Therefore, both car and truck mpg are consistently lower than the CAFE standard in the graphic. The amount that the 2-cycle test inflates miles per gallon is increasing over time. In 2017, it inflated miles per gallon by 26% for both passenger cars and light trucks.[§] Thus, passenger cars and light trucks do not actually get the mileage advertised in CAFE standards.
Graphic 8: Passenger Car Mileage, CAFE Standards, and the Price of Gasoline
Graphic 9: Light Truck Mileage, CAFE Standards, and Gasoline Prices
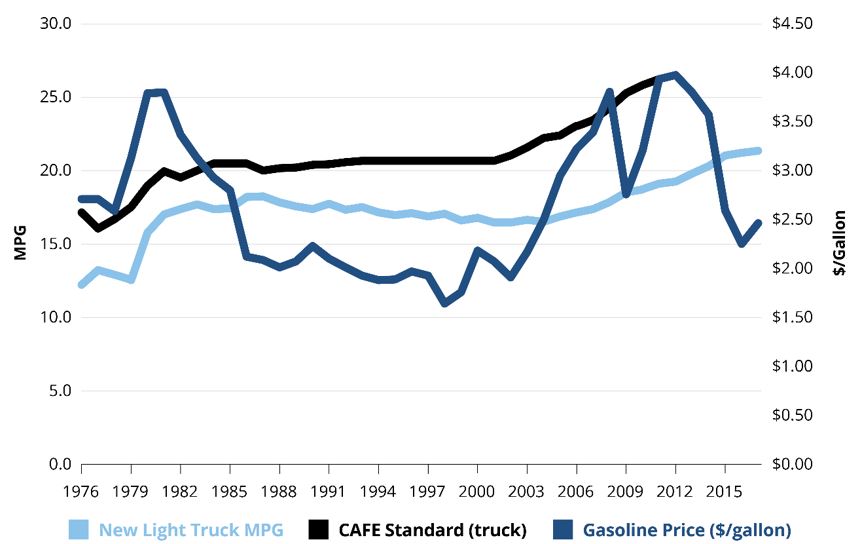
Passenger car and light truck mileage closely tracks both the price of gasoline and the CAFE standard. This is consistent with the idea that automakers respond to consumer preferences for improved mileage when the price of gasoline is rising, and politicians respond to voters’ concern about rising gasoline prices by increasing CAFE standards.
Passenger car and light truck mileage and CAFE standards are flat when the price of gasoline is flat. Voters are less concerned about the price of gasoline when it is not rising.[26] Increasing the requirements of CAFE standards, and thus mandating smaller, more fuel-efficient vehicles when gasoline is cheap, would be politically unpopular, which could help explain why CAFE standards were unchanged during the 1980s and 1990s.
Brookings Institution economist Robert Crandall argues that the vehicle mileage improvements seen in the early days of the CAFE standards program would have occurred even without it.[27] He points out that the average fuel efficiency improved by more than 20% from 1973-76, even though the CAFE standard program did not take effect until the 1978 model year. The rate of fuel efficiency improvements was greater during 1973-77, which coincided with the oil shock from the Middle Eastern oil embargo, than between 1978-84, which coincided with falling gasoline prices and CAFE standards taking effect. He also argues that the rate of fuel efficiency improvements experienced during the 1970-84 period is what would have been expected without CAFE standards, given the cost of engineering and manufacturing fuel-efficient cars and the rise of the price of gasoline during that time.
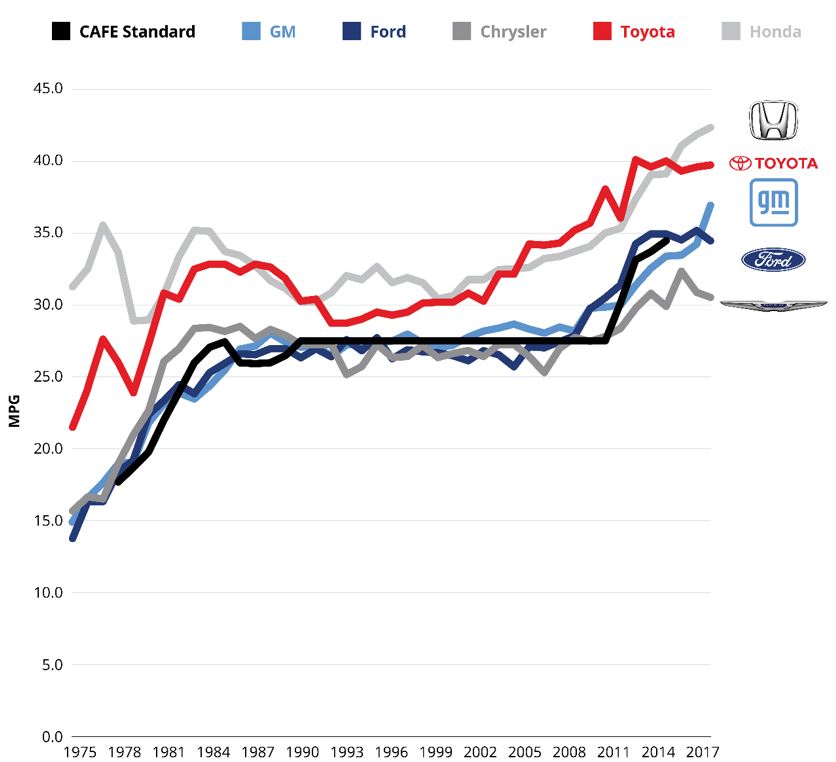
Graphics 10 and 11 plot vehicle mileage, along with the CAFE standard for passenger cars and light trucks for General Motors, Ford, Chrysler, Toyota and Honda for the 1975-2017 period.[**]
Graphic 10: Mileage and CAFE Standard for GM, Ford, Chrysler, Toyota and Honda Passenger Cars
Graphic 11: Mileage and the CAFE Standard for GM, Ford, Chrysler, Toyota and Honda Light Trucks
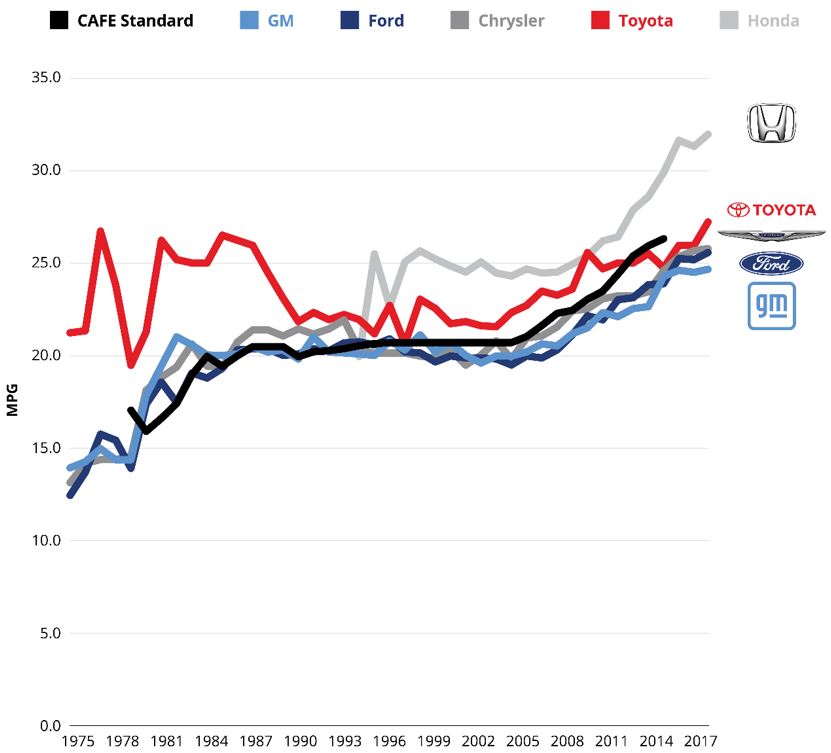
These charts illustrate Crandall’s point. Both passenger car and light truck mileage were rising before CAFE standards took effect. Toyota and Honda have never been constrained by the CAFE standards, a point which numerous authors in the research literature have raised.[28] Even GM, Ford and Chrysler exceeded the CAFE standard for light trucks until 1983, a point also noted by Clemson University economist Bruce Yandle in 1980.[29] Thus, it is likely that the mileage improvements seen during the late 1970s and early 1980s would have occurred even without the CAFE standards program.
[*] All prices are adjusted for inflation, using the average value of the 2018 consumer price index available from the St. Louis FRED database: https://perma.cc
[†] See Section 5 of this report for more on the advantages of a fuel tax over CAFE standards.
[‡] The original real world mpg data for cars versus light trucks no longer appears to be available from the EPA. The data is available in Table 3.2 in the EPA’s Automotive Trends Report, but it is more disaggregated than what is presented in Graphic 9. The data in Graphic 9 is a weighted average of this data for cars and light trucks. “Automotive Trends Report: Download Data for the Automotive Trends Report” (Environmental Protection Agency), https://tinyurl.com
[§] This comes from a comparison of the real world miles per gallon data in the Automotive Trends Report and the EPA’s 2-cycle 55/45 test available in Supplemental Table K of the Automotive Trends Report, https://perma.cc
[**] The mileage reported comes from the EPA’s 2-cycle 55/45 test and is available in Supplemental Table K of the Automotive Trends Report, https://perma.cc
One of the National Research Council’s findings is that the CAFE standards program has “clearly contributed to increased fuel economy.” It points out that had fuel economy not improved since the 1970s, gasoline consumption would have been 14% higher in 2003.[30] But the council admits that it is difficult to disentangle the mileage improvements due to CAFE standards from those driven by a market response to higher gasoline price.[31]
It is likely that CAFE standards resulted in reduced gasoline consumption during the 1980s and 1990s, when the price of gasoline was low. GM, Ford and Chrysler struggled to meet the standards, which suggests consumers would have preferred less fuel-efficient vehicles. Since Toyota and Honda already exceeded CAFE standards during that time, any improvement in vehicle mileage that can be attributed to the CAFE standards came from the Big Three automakers. Taking this into consideration, it is likely that mileage improvements due to CAFE standards were modest over the period.
Yale economist Pinelopi Goldberg estimated that abolishing the CAFE standards program in 1989 would have led to a 19-million-gallon annual increase in fuel consumption in the short-run and an increase of 400 million gallons per year in the long run. But this represented only 0.01% and 0.3%, respectively, of the 130 billion gallons consumed yearly in the U.S. at that time.[32] Robert Crandall surveyed the literature and found a midrange estimate of 6.8 billion gallons of fuel saved during the 1984-89 period due to CAFE standards, savings of less than 1% of total consumption.[33] He found that it cost about $0.63 to save one gallon of gasoline through CAFE standards, which was 60% of the average price of a gallon of gasoline at the time. So, while CAFE standards can help reduce gasoline consumption, the impact is relatively small and relatively expensive.
Federal Trade Commission economist Andrew Kleit found that modest increases in CAFE standards can result in increased fuel consumption.[34] As discussed in the next section, CAFE standards tend to reduce the price of smaller, more fuel-efficient vehicles and increase the price of larger, less fuel-efficient ones. This helps automakers sell more of the former and less of the latter and thus meet the standards. But these price signals may not affect consumers equally.
For instance, suppose consumers of larger vehicles tend to be high-income and less price sensitive than consumers of smaller vehicles, who tend to have less income. Sales of large vehicles might not substantially decrease even if their price increases. But since buyers of small vehicles are more price sensitive, sales of smaller vehicles could increase substantially when their price decreases. The net effect under this scenario would be more vehicles on the road and thus more gasoline consumed.
Kleit found evidence for this phenomenon and estimated that raising CAFE standards from 26 mpg to 28 mpg in the late 1980s would increase gasoline consumption, but only up until a point. After that, further increases in CAFE standards would help reduce gasoline consumption. But the cost of this reduction is substantial: Kleit estimated the cost of each gallon of gasoline saved to be over $10 per gallon. His work suggests that CAFE standards may not automatically result in reduced gasoline consumption and that finding the right balance for a CAFE standard is important. But even then, the costs might outweigh the benefits.
Gasoline savings under the CAFE standards program differ substantially in the short and long run. One reason for this is that the standards only apply to new vehicles, not used vehicles, and it takes time for these new vehicles to influence the overall vehicle market. Thus, CAFE standards only affect the used vehicle market after an extended period, or an estimated 14 years, according to the Congressional Budget Office.[35] This may help explain findings like those from Mark Jacobsen, who estimated that a one-mpg increase in the CAFE standard only reduces household gasoline consumption by 0.84% in the first year, but eventually by 3.37% in the 10th year following the increase.[36]
Another factor that offsets the vehicle mileage improvement brought about by CAFE standards is how flex fuel was treated under the program.[37] Flex fuel is a blend consisting of up to 83% ethanol and at least 17% gasoline, sometimes called “E85.”[*] For purposes of CAFE compliance, the EPA assumes that flex fuel capable vehicles burn E85 half the time and conventional gasoline the other half. The EPA also assumes that the carbon content of E85 is zero, even though E85 contains only marginally less carbon than conventional gasoline, given the fossil fuels involved in growing corn and producing ethanol.[38] Likewise, the EPA currently assumes that fully electric vehicles produce no carbon emissions, despite estimates that total carbon emissions resulting from electric vehicles (due to things such as generating the electricity to power them) might exceed those for conventional gasoline vehicles.[39]
Michigan State University economist Soren Anderson and University of Chicago economist James Sallee find that given how E85 was treated for CAFE standard compliance, automakers could boost reported their vehicle mileage by an average of 1.2 miles per gallon by adding flex fuel capacity to a vehicle at little cost — $100 to $200 per vehicle.[40] This is regardless of how often motorists use E85.
Installing flex fuel capacity was a cheap way for automakers to get some extra miles-per-gallon for CAFE compliance, but it represented waste to consumers. Consumers expressed no willingness to pay for flex fuel capacity, as vehicles with it sold for the same price as vehicles without it.[41] Survey evidence reported by Anderson and Sallee indicated that 75% of consumers did not know their vehicles had a flex fuel capability, and a large proportion of flex fuel vehicles were sold in states where little E85 was available for purchase. Most flex fuel vehicles — 87% — were sold in states where, at most, 1% of gasoline stations carried E85.[42] So in practice, flex fuel had no impact on fuel economy trends.
Instead, flex fuel served as a method by which automakers could more easily comply with CAFE standards. Automakers added this feature to vehicles at a low cost, though hardly anyone used it, because doing so made it easier for them to meet the standards. This was important for domestic automakers, as each of the Big Three would have fallen short of CAFE standards from 1993-2006 without it.[43]
The contention that they used flex fuel capability primarily to meet CAFE standards is further illustrated by the fact that neither Toyota nor Honda has ever produced flex fuel capable vehicles.[44] They did not need to. Recall from Graphics 10 and 11 that Toyota and Honda routinely exceed CAFE standards, while the Big Three automakers just barely met them. Thus, the Big Three needed flex fuel to meet CAFE standards, while flex fuel had no similar value for Toyota and Honda. The favorable treatment of flex fuel for CAFE standards compliance ended in 2015. But since automakers can bank credits to use against CAFE standards for up to five years, they continued to use flex fuel for CAFE standards compliance through 2019.
[*] The U.S. Department of Energy defines E85 this way: “E85 (or flex fuel) is a term that refers to high-level ethanol-gasoline blends containing 51% to 83% ethanol, depending on geography and season.” “Alternative Fuels Data Center” (Office of Energy Efficiency and Renewable Energy), https://perma.cc
Burning large amounts of fossil fuels emits large quantities of carbon dioxide into the atmosphere, which can lead to undesirable effects on the world’s current environmental condition. Thus, reducing carbon dioxide emissions by reducing gasoline consumption is a potential benefit of the CAFE standards program. The standards, however, are a costly way to reduce emissions. Mark Jacobsen estimates that it costs $222 per ton of reduced carbon dioxide using CAFE standards.[45] Kate Whitefoot, University of California-Berkley economist Meredith Fowlie, and Steven Skerlos estimates a cost of $197 per ton of carbon dioxide.[46]
These costs far exceed the benefits of reducing carbon dioxide emissions. Economist Richard Tol of the University of Sussex estimates the cost, or damage that additional carbon dioxide does to the environment, to be, at most, $50 per ton.[47] Yale Economists William Nordhaus and Joseph Boyer estimate a cost of $27 per ton.[48] The National Research Council also estimates the cost of carbon to be $50 per ton.[49] Mark Jacobsen estimates it at $37 per ton.[50] Thus, eliminating a ton of carbon dioxide from the atmosphere might confer $27-$50 of benefit. Consequently, the cost of reducing carbon dioxide through CAFE standards far exceeds the benefit of doing so.
The reason is plain to see. CAFE standards force carbon dioxide reduction efforts through a high-cost channel — new technology to improve mileage on new vehicles — while failing to give people an incentive to reduce carbon dioxide emissions. As mentioned before, the impact CAFE standards can have on carbon dioxide emissions is limited and could be entirely offset if drivers increase how many miles they drive.[51]
CAFE standards create unintended consequences in new and used car markets. These impose costs to automakers and to consumers, which must be considered before assessing their effectiveness.
As Graphic 12 illustrates, CAFE standards only directly affect the Big Three domestic automakers. Toyota and Honda routinely exceed the standards, while the Big Three barely meet them. This suggests that the cost of complying with CAFE is very low (or nonexistent) for these foreign automakers while the Big Three bear most, if not all, of the compliance cost. Andrew Kleit estimates that increasing CAFE standards from 26 mpg to 28.5 mpg for model year 1989 would have cost GM $1.8 billion and Ford $3.6 billion, but it would have helped Asian firms’ combined profits to grow by $2.5 billion.[*] Not surprisingly, there’s evidence that the CAFE standards hurt the Big Three’s collective market share: Kate Whitefoot, Meredith Fowlie and Steven Skelos find the standards caused a 5-13% decline in market share for the Big Three.[52] Graphic 13 illustrates automakers’ U.S. market share from 1961–2018:
Graphic 12: Auto Market Share by Company in the United States, 1961-2018
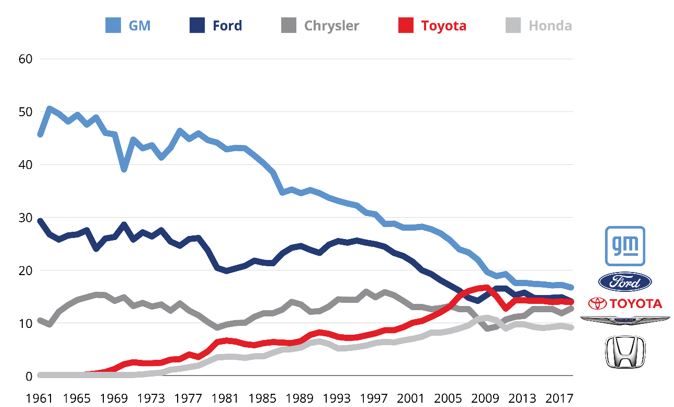
The Big Three’s share collectively eroded from about 85% of the U.S. auto market in 1961 to 43% in 2018. There are numerous reasons for this decline, but research suggests that the competitive disadvantage from CAFE standards likely played a role.
Since U.S. automakers are constrained by CAFE standards, they had to reduce their production of midsize and large passenger cars, such as luxury sedans, and increase their production of lighter, more fuel-efficient cars.[53] This made it easier for Toyota and Honda to enter the large luxury sedan market. Toyota, for example, entered this market in 1989 by creating its Lexus luxury car line. Since these automakers already exceeded the CAFE standards, they could begin producing heavier, less fuel-efficient luxury sedans to compete with the Big Three’s offering.
The result is that overall average fuel efficiency for the entire market rose by less than what was predicted by the CAFE standards program. In addition to losing market share, the Big Three saw fewer profits, as they were restricted from producing the cars consumers demanded. This was especially true when gasoline prices were relatively low. Mark Jacobsen estimates that in the first year of a one-mpg increase in CAFE standards, GM, Ford and Chrysler would see a 21.3%, 4.3% and 14.7% loss of profit, respectively. In the 10th year following an increase in the standard, he estimated these loses to be 15.4% for GM, 0.5 % for Ford and 10.2% for Chrysler. In contrast, Toyota and Honda saw a 2.8% and 1.6% increase in profit in the first year of a one-mpg CAFE standard increase and a 4.9% and 3.0% increase in profit in the 10th year after an increase.[54]
European automakers also benefit from the CAFE standards program. European automakers of luxury sedans, such as BMW and Mercedes-Benz, elect to simply pay the noncompliance fine rather than comply with CAFE standards.[55] With their relatively low volume of sales in the U.S. market, their fines are significantly less than those the Big Three would face if they attempted to deploy the same strategy.[†] European automakers took advantage of increased demand for these heavier, less fuel-efficient vehicles, given that the Big Three were less able to serve this market due to CAFE standards. Jacobsen estimates that European automakers saw a 2.0% increase in profits in the first year of a one-mpg increase in the CAFE standard and a 3.9% increase in the 10th year following this increase.
A shift away from passenger cars and toward light trucks has been occurring in the new vehicle market since CAFE standards were implemented. The standard for light trucks is lower, giving automakers a chance to better meet consumer demand while reducing their compliance costs. As Graphic 7 in the previous section illustrates, the share of passenger cars in total new vehicle production peaked at 78% in 1979, the year after CAFE standards took effect.[56] By 2017, only 53% of new vehicles produced were passenger cars, while 47% were light trucks. Light trucks averaged 27% lower fuel efficiency than passenger cars in 2018, which offsets some of the benefit of CAFE standards.
This shift towards light trucks serves to increase profits for foreign automakers. Jacobsen finds that a one-mpg increase in the CAFE standard for light trucks increases Toyota’s and Honda’s sales of light trucks in the U.S. by 2.6% and 1.5%, respectively, while European automaker see their sales of light trucks increase by 2.7%. Meanwhile, GM, Ford and Chrysler see their sales of light trucks fall by 13.8%, 10.2% and 7.8%, respectively.[57]
Given Asian automakers’ superior ability to increase fuel efficiency and the European automakers’ willingness to simply pay the noncompliance fine, CAFE standards serve to increase the sales, market share, and profit of foreign automakers at the expense of the domestic Big Three automakers.
[*] During this period, the CAFE standards benefited Chrysler, with Kleit estimating they help grow the company’s profits by $1 billion. At this time, Chrysler was producing smaller cars than GM or Ford, which allowed it to meet the CAFE standard for its overall fleet and allowed the company to expand its production of larger cars that, by themselves, would not meet the standard. GM and Ford, on the other hand, had to scale back their production of large cars to meet a higher CAFE standard, which helped Chrysler’s competitive advantage, and ultimately, its profit. See Andrew Kleit, “The Effect of Annual Changes in Automobile Fuel Economy Standards,” Journal of Regulatory Economics 2 (1990): 162, https://tinyurl.com
[†] There are a couple of potential explanations for why the Big Three does not elect to pay the fine as well. One is that they want to avoid damage to their reputation and the potential legal liability, in the form of shareholder lawsuits, associated with paying the fine. Another is that the fine would substantially cut into domestic automakers’ profits. The Big Three collectively sold 7.6 million vehicles in 2018 in the U.S. Falling one mpg short of the CAFE standards would cost them, collectively, $420 million in fines annually, which is much larger than the fines paid by BMW or Mercedes. The maximum fine these automakers paid was $27 million by BMW in 2001, though in many years they pay much less. See “Summary of CAFE Civil Penalties Collected” in the CAFE Public Information Center, https://tinyurl.com
CAFE standards tax heavier, less fuel-efficient vehicles and subsidize lighter, more fuel-efficient ones. In the short run, automakers respond to an increase in CAFE standards by changing the mix of vehicles they sell.[58] In the case of the Big Three, this means increasing their sales of lighter, higher-mileage vehicles and reducing their sales of heavier, less fuel-efficient ones. This can be accomplished by lowering the price of small cars and light trucks relative to the price of large cars and trucks. Kleit estimates that for GM, every dollar by which CAFE standards increase the company’s production costs, the price of small cars falls by $0.84, the price of small trucks falls by $1.17, and the price of a small SUV falls by $0.30. In contrast, the price of a large passenger car rises by $0.23, the price of a large truck rises by $0.25, and the price of a large SUV rises by $1.17.[59]
In the medium to long run, automakers can comply with CAFE standards by reducing a vehicle’s weight and acceleration and making technological improvements that increase fuel efficiency. But these increase the cost of manufacturing the vehicle, which is passed on to consumers in the form of a higher price, particularly in the long run.[60] Federal Reserve Bank of Chicago economists Thomas Klier and Joshua Linn in 2012 estimated that the cost of complying with an increase in CAFE standards is split between consumers and automakers in the short run, or a year or two after the increase, but fall disproportionately on consumers in the long run, or after five years from the increase. In the short run, consumers are estimated to lose $6.5 billion in value from purchasing a new vehicle, even when accounting for improvements to gasoline mileage, while automakers’ profits fall by $9.1 billion. In the medium run, automakers can cut their losses by half while consumers’ losses increase to $7.8 billion. These additional costs represent almost a 10% increase in spending by consumers on new vehicles, according to the U.S. Bureau of Economic Analysis.[61] Altogether, CAFE standards impose about a 6-7% annual loss of value to consumers.
Other research finds similar results. The Congressional Budget Office estimates that consumers pay a disproportionate share of the cost associated with a 10% reduction of gasoline consumption through CAFE standards. It estimates that consumers lose between $2.2 and $2.4 billion in value, while automakers lose between $800 million and $1.2 billion in profits.[62] Jacobsen estimates that the costs of a one-mpg increase in CAFE standards are largely split between automakers and consumers in the first year of the increase, costing consumers $11.2 billion in value and automakers $8.8 billion in profits.[63] After 10 years following the increase, the majority of the cost is passed on to consumers, who lose $24.1 billion; automakers lose $5.5 billion, according to Jacobsen.
The Big Three automakers pay almost all the costs borne by automakers from CAFE standards. Klier and Linn find essentially no change in the profit of the foreign automakers whose fleet easily exceeds the CAFE standards, and they find an increase in profits for other foreign automakers that opt to pay the noncompliance fine. Profits for the Big Three firms, which as a group struggle to meet the standard, fall by $12.5 billion.[64]
Since CAFE standards increase the price of larger, heavier vehicles, consumers are incentivized to drive them for longer than they otherwise would and to postpone purchasing a new vehicle. This decreases the supply of used cars and drives up their prices, which disproportionately harms lower-income households, who rely more on the used car market. The incentive to drive heavier, less fuel-efficient vehicles for longer also offsets some of the mileage gain from CAFE standards.
Mark Jacobsen and Arthur van Bentham find that a 1% increase in used car prices results in a 0.7% decrease in the number of used cars that are scrapped, meaning these cars are driven for longer than they would have been.[65] They estimate that a one-mpg increase in CAFE standards results in a $164 increase in the average price of a large used car and a $92 increase in the average price of a large used truck. When consumers drive older vehicles longer than they would otherwise would, it works against the purposes of CAFE standards. In fact, Jacobsen and van Bentham estimate that this price effect on used cars leads to a 16% reduction in the gasoline savings expected under the new footprint-based CAFE standards.[66]
Jacobsen also estimates that a one-mpg increase in CAFE standards costs consumers of all income levels approximately 0.5% of their income in the first year of the increase. By the 10th year following the increase, however, this cost becomes regressive, as the increase drives up the price of used cars. A one-mpg increase in CAFE standards costs consumers earning less than $25,000 per year 1.12% of their income, but only costs consumers earning more than $75,000 per year 0.41% of their income.[67] University of California-Berkley economist Lucas Davis and MIT economist Christopher Knittel also find that CAFE standards are effectively a regressive tax. They estimate that CAFE standards create a tax on new vehicles equal to about 0.7% of income for those in the bottom 10th of the income distribution. In contrast, the tax is only 0.25% of income for those in the upper 10th of the income distribution.[68] Thus, CAFE standards cost lower-income consumers a larger proportion of their income than higher-income consumers, even if higher-income consumers spend a larger dollar amount on purchasing a vehicle.
Improved fuel efficiency due to CAFE standards reduces the amount of fuel needed to travel a given distance, which, all else equal, would reduce the amount of gasoline consumed. But improved fuel efficiency also reduces the cost of driving, which creates an incentive for people to drive more. This is commonly called “the rebound effect,” and a consensus in the research literature is that this offsets 10-20% of the fuel savings from the CAFE standards program.
Analyzing data from 1997-2001, University of California-Irvine economists Kenneth Small and Kurt Van Dender estimate the rebound effect to be 10.7%, reducing by that amount the projected fuel savings.[69] Resources for the Future economists Paul Portney, Ian Parry, Howard Gruenspecht and Winston Harrington survey the literature and find estimates for the rebound effect of between 10%-20%.[70] Thomas Klier and Joshua Linn also use a range of 10-20% for the rebound effect in their analysis of the effects of CAFE standards.[71] Both the EPA and National Highway Traffic Safety Administration believe the rebound effect to be 10% as well.[72]
Coupling the rebound effect with the previously mentioned impact CAFE standards have on the used vehicle market, the actual fuel savings realized from the CAFE standards program is 26-36% less than what is expected. In other words, all the fuel-saving projections from the program are, due to these other unintended consequences, between one-quarter and one-third less effective than they appear.
Driving a vehicle produces several negative externalities, or costs that drivers impose on others. They include things such as traffic congestion, air pollution, traffic accidents and even geopolitical risks from foreign oil dependence. Figuring out the precise costs of these externalities is difficult, but researchers have generated estimates. These should be taken into consideration when assessing the overall effectiveness of CAFE standards.
The National Research Council estimates that environmental and oil dependence externalities — costs associated with carbon dioxide emissions, oil refinery pollution and geopolitical risks from oil dependence — amount to 26 cents per gallon of gasoline.[73] Adjusted for inflation, Mark Jacobsen has a similar estimate: 33 cents per gallon in 2014 dollars.[74] Resources for the Future economists Ian Parry, Margaret Walls and Winston Harrington estimate the externality associated with traffic accidents to be 3 cents per mile, or 63 cents per gallon of gasoline. This is not due to accidents resulting from CAFE standards influencing vehicle size — that is discussed in the next subsection.[75] This is instead the cost of accidents that result from each additional mile of driving. The authors estimate congestion externalities to be 5 cents per mile, or $1.05 per gallon of gasoline. Of course, the size of this latter externality depends on where the driving takes place. Congestion externalities might be higher in major cities and close to zero in rural areas. In sum, Parry, Walls and Harrington estimate all the externalities collectively to be 10 cents per mile, or $2.10 per gallon of gasoline.[76]
As the discussion of the rebound effect explained, by forcing new vehicles to be more fuel-efficient and reducing the cost to drive a mile, CAFE standards create incentives for Americans to drive more. This means that the standards increase the impact of these negative externalities through the rebound effect. This reduces the net benefit of the program. Andrew Kliet estimates that the CAFE standards program causes a $2.24 billion increase in the negative externalities associated with driving.[77] Paul Portney, Howard Gruenspecht and Winston Harrington estimate that the increased accidents and congestion stemming from the rebound effect offset 95% of the benefits of the CAFE standards program.[78] These estimates call into question whether the net impact of the program is positive or negative.
CAFE standards have other effects that need to be taken into consideration as well. Generally, the standards give automakers an incentive to make cars smaller and lighter. Smaller and lighter vehicles tend to be less safe for occupants in traffic accidents. If more drivers are using these vehicles, traffic fatalities should rise. A majority of members on the National Research Council’s Committee on the Effectiveness and Impact of Corporate Average Fuel Economy Standards agreed with the estimate that reducing vehicle size and weight resulted in more motor vehicle deaths in 1993 — between 1,300 and 2,600 — that would not have happened had average size and weight remained at their 1976 levels.[79] Mark Jacobsen estimates that there are an additional 150 fatalities annually as a result of reductions in vehicle size and weight for every 0.1 mile per gallon increase in the CAFE standard.[80]
The safety risk stems from CAFE standards compelling U.S. automakers to sell more light trucks than passenger cars and to make their passenger cars smaller. The risk of a fatal accident increases when a smaller, lighter passenger car collides with a light truck, such as a pickup or SUV. The size and weight protect the driver of the light truck, but they inflict disproportionate damage on the smaller car.
In addition, Jacobsen finds that light trucks and large sedans are associated with riskier driving and thus an increased risk of a fatal accident.[81] The additional fatalities from making vehicles smaller and lighter impose a $1.55-per gallon cost for every gallon of gasoline saved through CAFE standards, according to Jacobsen.[82] Thomas Klier and Joshua Linn find that because of the reduction in the size and weight of passenger cars, light trucks impose a cost of approximately $2,000 per vehicle when the disproportionate damage they inflict in an accident is considered.[83]
There are two issues with CAFE standards that policymakers should pay attention to. One is that the standards appear to have contributed to making it more difficult for American automakers to compete in the U.S. new car market. Foreign companies serving American consumers have significantly lower compliance costs compared to their American rivals. This affords them a competitive advantage. U.S. policy should not play favorites in this way; instead, it should remain neutral as much as possible.
The second problem with CAFE standards is that they are simply not very effective, but are, instead, very costly for no good reason. Due to their design — dictating an average fuel efficiency standard for new cars — nearly all the benefits from the standards are offset by additional costs created through unintended negative externalities, such as the rebound effect. The academic literature on this question is clear: CAFE standards are expensive and likely not worth the cost.
Instead, the economic research points to fuel taxes as the optimal way to achieve some of the goals of the CAFE standards. They could improve overall fuel efficiency and reduce gasoline consumption at a significantly lower cost to both consumers and automakers. The only real debate still alive in the research is how much less costly a fuel tax would be.
Mark Jacobsen estimates that in the first year of the program, CAFE standards are 28 times more costly than a gasoline tax, because fuel economy improvements have not yet dispersed through the used car fleet. But even after 10 years of a standards-based regime, the costs of fuel efficiency improvements are still three to six times higher than would be the case with a fuel tax.[84]
Other studies find similar results. Robert Crandall estimates that CAFE standards cost seven to 10 times more than a fuel tax would to reduce gasoline consumption and cost 8.5 times more than a carbon tax to reduce carbon emissions.[85] Crandall also cites a study from Charles Rivers Associates that finds that taxing crude oil instead of gasoline “would result in reducing gasoline consumption at two-thirds of the cost of doing the same thing through CAFE standards,” while only costing consumers 3-11% of the price of CAFE standards.[86] Andrew Kleit estimates that CAFE standards are 14 times more costly than a gasoline tax.[87] The Congressional Budget Office estimates that CAFE standards are equivalent to a 46 cent increase in the gasoline tax, but a tax increase of this magnitude would cost consumers between 3-19% less than CAFE standards.
Thus, there is a rather wide range of estimates that compare CAFE standards to a fuel tax. For our purposes, we’ll use the lowest estimate from Crandall, who suggests that fuel taxes have one-seventh the cost of the standards. As mentioned earlier, a one-mpg increase in CAFE standards is estimated to cost consumers between $6.5 billion and $11.2 billion in the first year after the increase and between $7.8 billion and $24 billion five to 10 years after.[88] Based on these estimates, consumers could — by responding to a tax increase — improve the average fuel efficiency by one mpg and still save between $5.6 billion and $10.8 billion if CAFE standards are repealed and replaced by a fuel tax. In later years, these annual savings would amount to something between $6.7 billion and $23 billion.
The reasons why a fuel tax is less costly than CAFE standards are straightforward. A fuel tax immediately affects nearly all drivers and vehicles, while CAFE standards only immediately affect new-vehicle buyers. Another reason is that there is no negative rebound effect from fuel taxes. Recall that CAFE standards, by reducing the cost of driving a mile, result in more driving. This increases the costs of other negative externalities associated with driving, such as accidents, traffic congestion and pollution, which work to offset the benefits of the CAFE program. In contrast, a fuel tax increases the cost of driving, reducing the incentive to drive. Given this, it is not associated with any of the costs related to an increase in driving. Finally, a fuel tax allows the market to find the lowest-cost way to reduce gasoline consumption, and there are a number of ways to increase national fuel efficiency and reduce fuel consumption. Options might include carpooling, using public transportation, moving closer to work, or buying a more fuel-efficient vehicle. CAFE standards constrain these possibilities to a small subset of choices that only involve producing new fuel-efficient vehicles.[89]
A fuel tax has another benefit as well: the extra costs that consumers must pay can be used for road infrastructure improvements. With CAFE standards, consumers’ added costs are not used for any public purpose; they are instead captured by automakers who use them to recoup their compliance costs. Revenue from a fuel tax, on the other hand, could go into the Federal Highway Trust Fund and be used to repair roads and bridges. Revenue collected by Federal Highway Trust Fund from fuel taxes totaled $35.6 billion in 2018.[90] With the cost of CAFE standards estimated to be as high as $20 billion per year, replacing CAFE standards with a gasoline tax would represent a large increase in revenue to the trust fund.[91]
If Congress insists on keeping CAFE standards, it should reform the program. First, CAFE standards and compliance should be based on realistic mileage data, instead of the EPA’s 2-cycle 55/45 test that inflates mpg by about 26%. The current goal of increasing CAFE standards to 54 mpg by 2025 might make for a good headline, but the actual fuel efficiency of that standard would only be 41 mpg. To improve fuel efficiency, you first need to measure it properly.
Second, the distinction between an automaker’s domestic and foreign production should be abolished when it comes to the standards. The National Research Council found no evidence that requiring two separate calculations had any effect on domestic employment in the auto industry.[92] This requirement serves instead to increase compliance costs and distort production decisions, and it should be eliminated.[*]
Third, Congress or the EPA should abolish footprint-based CAFE standards and replace them with a single standard that applies to both passenger cars and light trucks. By having both passenger cars and light trucks meet the same standard, automakers would have an incentive to reduce the size and weight of both types of vehicles. This reduces the incentive for consumers to purchase a light truck over a car, which results in fewer light trucks on the road and thus fewer truck-car accidents.[93] Mark Jacobsen estimates that shifting to a unified CAFE standard would reduce the number of fatalities associated with a one mpg increase in the CAFE standard from 150 each year to nearly zero.[94]
[*] For instance, Ford produced the Crown Victoria with enough Canadian and foreign content to get it counted as an “import,” thus dispersing its cost of CAFE standards against a more fuel-efficient foreign fleet. See “6 Clever Ways the Car Industry Has Gamed the CAFE Fuel Economy Standards,” Popular Mechanics, June 30, 2011, https://perma.cc
CAFE standards have a straightforward goal: improve vehicle mileage and thus reduce gasoline consumption. But there are numerous unintended consequences from this program that increase its costs while offsetting its goals. A fuel tax can achieve the goals of the CAFE standard program at a much lower cost without the unintended consequences. The disadvantage of a fuel tax is that it is a visible cost to the driver, while the cost of CAFE standards is buried in the sticker price of a new vehicle. This makes fuel taxes more difficult to implement since politicians, rather than automakers, will bear the wrath of consumers. If improved fuel economy and reduced gasoline consumption is the goal, then policymakers should meet this goal with a fuel tax, despite the political costs.
1 “History of Fuel Economy” (The Pew Environmental Group, 2011), https://perma.cc
2 “Summary of Fuel Economy Performance” (National Highway Traffic Safety Administration, 2014), https://perma.cc
3 Thomas H. Klier and James M. Rubenstein, “Whose Part Is it? Measuring domestic content of vehicles,” Chicago Fed Letter, no. 243 (October 2007), https://perma.cc
4 “Corporate Average Fuel Economy” (National Highway Traffic Safety Administration), https://perma.cc
5 New York v. National Highway Traffic Safety Administration, no. 19-2395 (2d Cir. 2020),https://perma.cc
6 Federal Register, Vol. 77, no. 199, Oct. 15, 2012, p. 62648, https://perma.cc
7 Energy Independence and Security Act of 2007, p. 12: https://perma.cc
8 Lucas W. Davis and Christopher R. Knittel, “Are Fuel Economy Standards Regressive?” (MIT Center for Energy and Environmental Policy Research, 2016), Working Paper 2016-016, 8, https://perma.cc
9 “The Economic Cost of Fuel Economy Standards Versus a Gasoline Tax” (Congressional Budget Office, December 2003), https://perma.cc
10 “Fact #693: September 19, 2011, Average Vehicle Footprint for Cars and Light Trucks” (U.S. Department of Energy Office of Energy Efficiency and Renewable Energy), https://perma.cc
11 Mark R. Jacobsen, “U.S. Fuel Economy Standards: Economics and Efficiency” (Stanford University Energy Seminar, Nov. 17, 2014), https://perma.cc
12 Kate S. Whitefoot and Steven J. Skerlos Skerlos (2012), “Design Incentives to Increase Vehicle Size Created From the U.S. Footprint-Based Fuel Economy Standards,” Energy Policy 41 (2012): 402-411, https://tinyurl.com
13 Energy Independence and Security Act of 2007, 9, https://perma.cc
14 “President Obama Announces Historic 54.5 mpg Fuel Efficiency Standard” (National Highway Traffic Safety Administration, July 29, 2011), https://tinyurl.com
15 Timothy Puko and Katy Stech Ferek, “U.S. Sets 55-Mile-a-Gallon Fuel-Efficiency Standard for 2026 Models” (The Wall Street Journal, Dec. 20, 2021), https://perma.cc
16 Timothy Puko and Katy Stech Ferek, “U.S. Sets 55-Mile-a-Gallon Fuel-Efficiency Standard for 2026 Models” (The Wall Street Journal, Dec. 20, 2021), https://perma.cc
17 “History of Fuel Economy” (The Pew Environmental Group, 2011), https://perma.cc
18 “Effectiveness and Impact of Corporate Average Fuel Economy (CAFE) Standards” (National Research Council, 2002), https://tinyurl.com
19 “Timeline: The Tumultuous 155-Year History of Oil Prices” (Business Insider, Dec. 20, 2016), https://perma.cc
20 “2018 Automotive Trends Report: Section 2: Tables” (Environmental Protection Agency), Table 3.1, https://tinyurl.com
21 Julian Morris, “The Effect of Corporate Average Fuel Economy Standards on Consumers” (Reason Foundation, April 1, 2018), https://perma.cc
22 “Obama Administration Finalizes Historic 54.5 MPG Fuel Efficiency Standards” (The White House, Aug. 28, 2012, https://perma.cc
23 “Effectiveness and Impact of Corporate Average Fuel Economy (CAFE) Standards” (National Research Council, 2002), 7, https://tinyurl.com
24 “Obama Administration Finalizes Historic 54.5 MPG Fuel Efficiency Standards” (The White House, Aug. 28, 2012, https://perma.cc
25 “The 2018 EPA Automotive Trends Report: Greenhouse Gas Emissions, Fuel Economy, and Technology Since 1976” (Environmental Protection Agency, 2018), Appendix C, https://perma.cc
26 “Most Important Problem” (Gallup, December 2019), https://perma.cc
27 Robert W. Crandall “Why Should We Regulate Fuel Economy at All?” The Brookings Review, 3, no. 3 (1985): 3-7, https://perma.cc
28 Mark R. Jacobsen, “Evaluating U.S. Fuel Economy Standards in a Model with Producer and Household Heterogeneity,” American Economic Journal: Economic Policy 5, no. 2 (2013):178, https://perma.cc
29 Bruce Yandle, “Fuel Efficiency by Government Mandate: A Cost-Benefit Analysis,” Policy Analysis 6, no. 3 (1980): 291-304, https://perma.cc
30 “Effectiveness and Impact of Corporate Average Fuel Economy (CAFE) Standards” (National Research Council, 2002), 111, https://perma.cc
31 “Effectiveness and Impact of Corporate Average Fuel Economy (CAFE) Standards” (National Research Council, 2002), 13, https://perma.cc
32 Pinelopi Koujianou Goldberg, “The Effects of Corporate Average Fuel Efficiency Standards in the U.S.,” The Journal of Industrial Economics 46, no. 1 (1998): 1-33, https://perma.cc
33 Robert W. Crandall, “Policy Watch: Corporate Average Fuel Economy Standards,” The Journal of Economic Perspectives 6, no. 2 (1992): 171-180, https://perma.cc
34 Andrew Kleit (1990), “The Effect of Annual Changes in Automobile Fuel Economy Standards,” Journal of Regulatory Economics 2 (1990): 151-172, https://tinyurl.com
35 “The Economic Cost of Fuel Economy Standards Versus a Gasoline Tax” (Congressional Budget Office, December 2003), https://perma.cc
36 Mark R. Jacobsen, “Evaluating U.S. Fuel Economy Standards in a Model with Producer and Household Heterogeneity,” American Economic Journal: Economic Policy 5, no. 2 (2013): 148-187, https://perma.cc
37 Lucas Davis, “Automakers Complain, But CAFE Loopholes Make Standards Easier to Meet” (Energy Institute at Haas, April 11, 2016), https://perma.cc
38 Lucas Davis, “Automakers Complain, But CAFE Loopholes Make Standards Easier to Meet” (Energy Institute at Haas, April 11, 2016), https://perma.cc
39 Lucas W. Davis and Christopher R. Knittel, “Are Fuel Economy Standards Regressive?” (MIT Center for Energy and Environmental Policy Research, 2016), Working Paper 2016-016, http://tinyurl.com
40 Soren T. Anderson and James M. “Using Loopholes to Reveal the Marginal Cost of Regulation: The Case of Fuel-Economy Standards,” American Economic Review 101, no. 4 (2011): 1375-1409, https://perma.cc
41 Soren T. Anderson and James M. “Using Loopholes to Reveal the Marginal Cost of Regulation: The Case of Fuel-Economy Standards,” American Economic Review 101, no. 4 (2011): 1399, https://perma.cc
42 Soren T. Anderson and James M. “Using Loopholes to Reveal the Marginal Cost of Regulation: The Case of Fuel-Economy Standards,” American Economic Review 101, no. 4 (2011): 1398, https://perma.cc
43 Soren T. Anderson and James M. “Using Loopholes to Reveal the Marginal Cost of Regulation: The Case of Fuel-Economy Standards,” American Economic Review 101, no. 4 (2011): 1388, https://perma.cc
44 Soren T. Anderson and James M. “Using Loopholes to Reveal the Marginal Cost of Regulation: The Case of Fuel-Economy Standards,” American Economic Review 101, no. 4 (2011): 1388, https://perma.cc
45 Mark R. Jacobsen, “Evaluating U.S. Fuel Economy Standards in a Model with Producer and Household Heterogeneity,” American Economic Journal: Economic Policy 5, no. 2 (2013):178, https://perma.cc
46 Kate Whitefoot, Meredith Fowlie, and Steven Skerlos, “Product Design Responses to Industrial Policy: Evaluating Fuel Economy Standards Using an Engineering Model of Endogenous Product Design,” Semantic Scholar (2011), https://tinyurl.com
47 Richard S.J. Tol, “The Marginal damage costs of carbon dioxide emissions: an assessment of the uncertainties,” Energy Policy 33, no. 16 (2005): 2064-2074, https://tinyurl.com
48 William D. Nordhaus and Joseph Boyer. “Warming the World: Economic Models of Global Warming” (Cambridge and London: MIT Press, 2000). Nordhaus and Boyer estimated $20 per ton in 2005, which is adjusted to 2019 dollars using the Consumer Price Index.
49 “Effectiveness and Impact of Corporate Average Fuel Economy (CAFE) Standards” (National Research Council, 2002), 4, https://tinyurl.com
50 Mark R. Jacobsen, “U.S. Fuel Economy Standards: Economics and Efficiency” (Stanford University Energy Seminar, Nov. 17, 2014), https://perma.cc
51 Mark R. Jacobsen, “U.S. Fuel Economy Standards: Economics and Efficiency” (Stanford University Energy Seminar, Nov. 17, 2014), https://perma.cc
52 Kate Whitefoot, Meredith Fowlie, and Steven Skerlos, “Product Design Responses to Industrial Policy: Evaluating Fuel Economy Standards Using an Engineering Model of Endogenous Product Design,” Semantic Scholar (2011), https://tinyurl.com
53 Mark R. Jacobsen, “Evaluating U.S. Fuel Economy Standards in a Model with Producer and Household Heterogeneity,” American Economic Journal: Economic Policy 5, no. 2 (2013): 148-187, https://perma.cc
54 Mark R. Jacobsen, “Evaluating U.S. Fuel Economy Standards in a Model with Producer and Household Heterogeneity,” American Economic Journal: Economic Policy 5, no. 2 (2013): 148-187, https://perma.cc
55 Mark R. Jacobsen, “Evaluating U.S. Fuel Economy Standards in a Model with Producer and Household Heterogeneity,” American Economic Journal: Economic Policy 5, no. 2 (2013): 148-187, https://perma.cc
56 “Automotive Trends Report: Download Data for the Automotive Trends Report” (Environmental Protection Agency), Table 3.1, https://tinyurl.com
57 Mark R. Jacobsen, “Evaluating U.S. Fuel Economy Standards in a Model with Producer and Household Heterogeneity,” American Economic Journal: Economic Policy 5, no. 2 (2013): 175, Table 7,https://perma.cc
58 obert W. Crandall, “Policy Watch: Corporate Average Fuel Economy Standards,” The Journal of Economic Perspectives 6, no. 2 (1992): 171-180, Table 2, https://perma.cc
59 Andrew N. Kleit, “Impacts of Long-Range Increases in the Fuel Economy (CAFE) Standard,” Economic Inquiry 42, no. 2 (2004): 290, https://tinyurl.com
60 Thomas Klier and Joshua Linn (2012), “New-Vehicle Characteristics and the Cost of the Corporate Average Fuel Economy standard,” RAND Journal of Economics 43, no. 1 (2012): 186-213, https://perma.cc
61 “Personal consumption expenditures: New autos, 1947-01-01 to 2022-01-01” (Federal Reserve Bank of St. Louis), https://perma.cc
62 “The Economic Cost of Fuel Economy Standards Versus a Gasoline Tax” (Congressional Budget Office, December 2003), 18, Table 3.1, https://perma.cc
63 Mark R. Jacobsen, “Evaluating U.S. Fuel Economy Standards in a Model with Producer and Household Heterogeneity,” American Economic Journal: Economic Policy 5, no. 2 (2013): 174, Table 6,https://perma.cc
64 Thomas Klier and Joshua Linn, “New-Vehicle Characteristics and the Cost of the Corporate Average Fuel Economy standard,” RAND Journal of Economics 43, no. 1 (2012): Table 6, 207, https://perma.cc
65 Mark R. Jacobsen and Arthur A. van Benthem, “Vehicle Scrappage and Gasoline Policy,” American Economic Review 105, no. 3 (2015): 1312-1338, https://perma.cc
66 Mark R. Jacobsen and Arthur A. van Benthem, “Vehicle Scrappage and Gasoline Policy,” American Economic Review 105, no. 3 (2015): 1333, Table 6, https://perma.cc
67 Mark R. Jacobsen, “Evaluating U.S. Fuel Economy Standards in a Model with Producer and Household Heterogeneity,” American Economic Journal: Economic Policy 5, no. 2 (2013): 176, Table 8,https://perma.cc
68 Lucas W. Davis and Christopher R. Knittel, “Are Fuel Economy Standards Regressive?” (MIT Center for Energy and Environmental Policy Research, 2016), 20, Figure 7, http://tinyurl.com
69 Kenneth A. Small and Kurt Van Dender, “Fuel Efficiency and Motor Vehicle Travel: The Declining Rebound Effect,” Energy Journal 28, no. 1 (2007): 25-51, https://perma.cc
70 Paul R. Portney, Ian W.H. Parry, Howard K. Gruenspecht, and Winston Harrington, “Policy Watch: The Economics of Fuel Economy Standards,” The Journal of Economic Perspectives 17, no. 4 (2003): 211, https://perma.cc
71 Thomas Klier and Joshua Linn, “Corporate Average Fuel Economy Standards and the Market for New Vehicles,” Annual Review of Resource Economics 3 (2011): 445-462, https://perma.cc
72 Mark R. Jacobsen and Arthur A. van Benthem, “Vehicle Scrappage and Gasoline Policy,” American Economic Review 105, no. 3 (2015): 1334, https://perma.cc
73 “Effectiveness and Impact of Corporate Average Fuel Economy (CAFE) Standards” (National Research Council, 2002), 86, https://tinyurl.com
74 Mark R. Jacobsen, “U.S. Fuel Economy Standards: Economics and Efficiency” (Stanford University Energy Seminar, Nov. 17, 2014), https://perma.cc
75 Ian W.H. Parry, Margaret Walls, and Winston Harrington, “Automobile Externalities and Policies,” Journal of Economic Literature 45, no. 2 (2007): 384, Table 2, https://perma.cc
76 Ian W.H. Parry, Margaret Walls, and Winston Harrington, “Automobile Externalities and Policies,” Journal of Economic Literature 45, no. 2 (2007): 384, Table 2, https://perma.cc
77 Andrew N. Kleit, “Impacts of Long-Range Increases in the Fuel Economy (CAFE) Standard,” Economic Inquiry 42, no. 2 (2004): Table 6, https://tinyurl.com
78 Paul R. Portney, Ian W.H. Parry, Howard K. Gruenspecht, and Winston Harrington, “Policy Watch: The Economics of Fuel Economy Standards,” The Journal of Economic Perspectives 17, no. 4 (2003): 211, https://perma.cc
79 “Effectiveness and Impact of Corporate Average Fuel Economy (CAFE) Standards” (National Research Council, 2002), 28, https://tinyurl.com
80 Mark R. Jacobsen, “Fuel Economy, Car Class Mix, and Safety,” American Economic Review 101, no. 3 (2011): 105-109, https://perma.cc
81 Mark R. Jacobsen, “Fuel Economy, Car Class Mix, and Safety,” American Economic Review, 101, no. 3 (2011): Table 1, https://perma.cc
82 Mark R. Jacobsen, “Fuel Economy, Car Class Mix, and Safety,” American Economic Review, 101, no. 3 (2011): 105, https://perma.cc
83 Thomas Klier and Joshua Linn, “Corporate Average Fuel Economy Standards and the Market for New Vehicles,” Annual Review of Resource Economics 3 (2011): 451, https://perma.cc
84 Mark R. Jacobsen, “Evaluating U.S. Fuel Economy Standards in a Model with Producer and Household Heterogeneity,” American Economic Journal: Economic Policy 5, no. 2 (2013): 177, https://perma.cc
85 Robert W. Crandall, “Policy Watch: Corporate Average Fuel Economy Standards,” The Journal of Economic Perspectives 6, no. 2 (1992): 171-180, https://perma.cc
86 Robert W. Crandall, “Policy Watch: Corporate Average Fuel Economy Standards,” The Journal of Economic Perspectives 6, no. 2 (1992): 178, https://perma.cc
87 Andrew N. Kleit, “Impacts of Long-Range Increases in the Fuel Economy (CAFE) Standard,” Economic Inquiry 42, no. 2 (2004): 279-294, https://tinyurl.com
88 Thomas Klier and Joshua Linn, “New-Vehicle Characteristics and the Cost of the Corporate Average Fuel Economy standard,” RAND Journal of Economics 43, no. 1 (2012): 207, Table 6, https://perma.cc
89 Mark R. Jacobsen, “U.S. Fuel Economy Standards: Economics and Efficiency” (Stanford University Energy Seminar, Nov. 17, 2014), https://perma.cc
90 “What is the Highway Trust Fund, and how is it financed?” (Tax Policy Center), https://perma.cc
91 Thomas Klier and Joshua Linn, “Corporate Average Fuel Economy Standards and the Market for New Vehicles,” Annual Review of Resource Economics 3 (2011): 445-462, https://perma.cc
92 “Effectiveness and Impact of Corporate Average Fuel Economy (CAFE) Standards” (National Research Council, 2002), 111, https://tinyurl.com
93 6 Clever Ways the Car Industry Has Gamed the CAFE Fuel Economy Standards,” Popular Mechanics, June 30, 2011, https://perma.cc
94 Mark R. Jacobsen, “Fuel Economy, Car Class Mix, and Safety,” American Economic Review, 101, no. 3 (2011): 108, https://perma.cc
