Summary
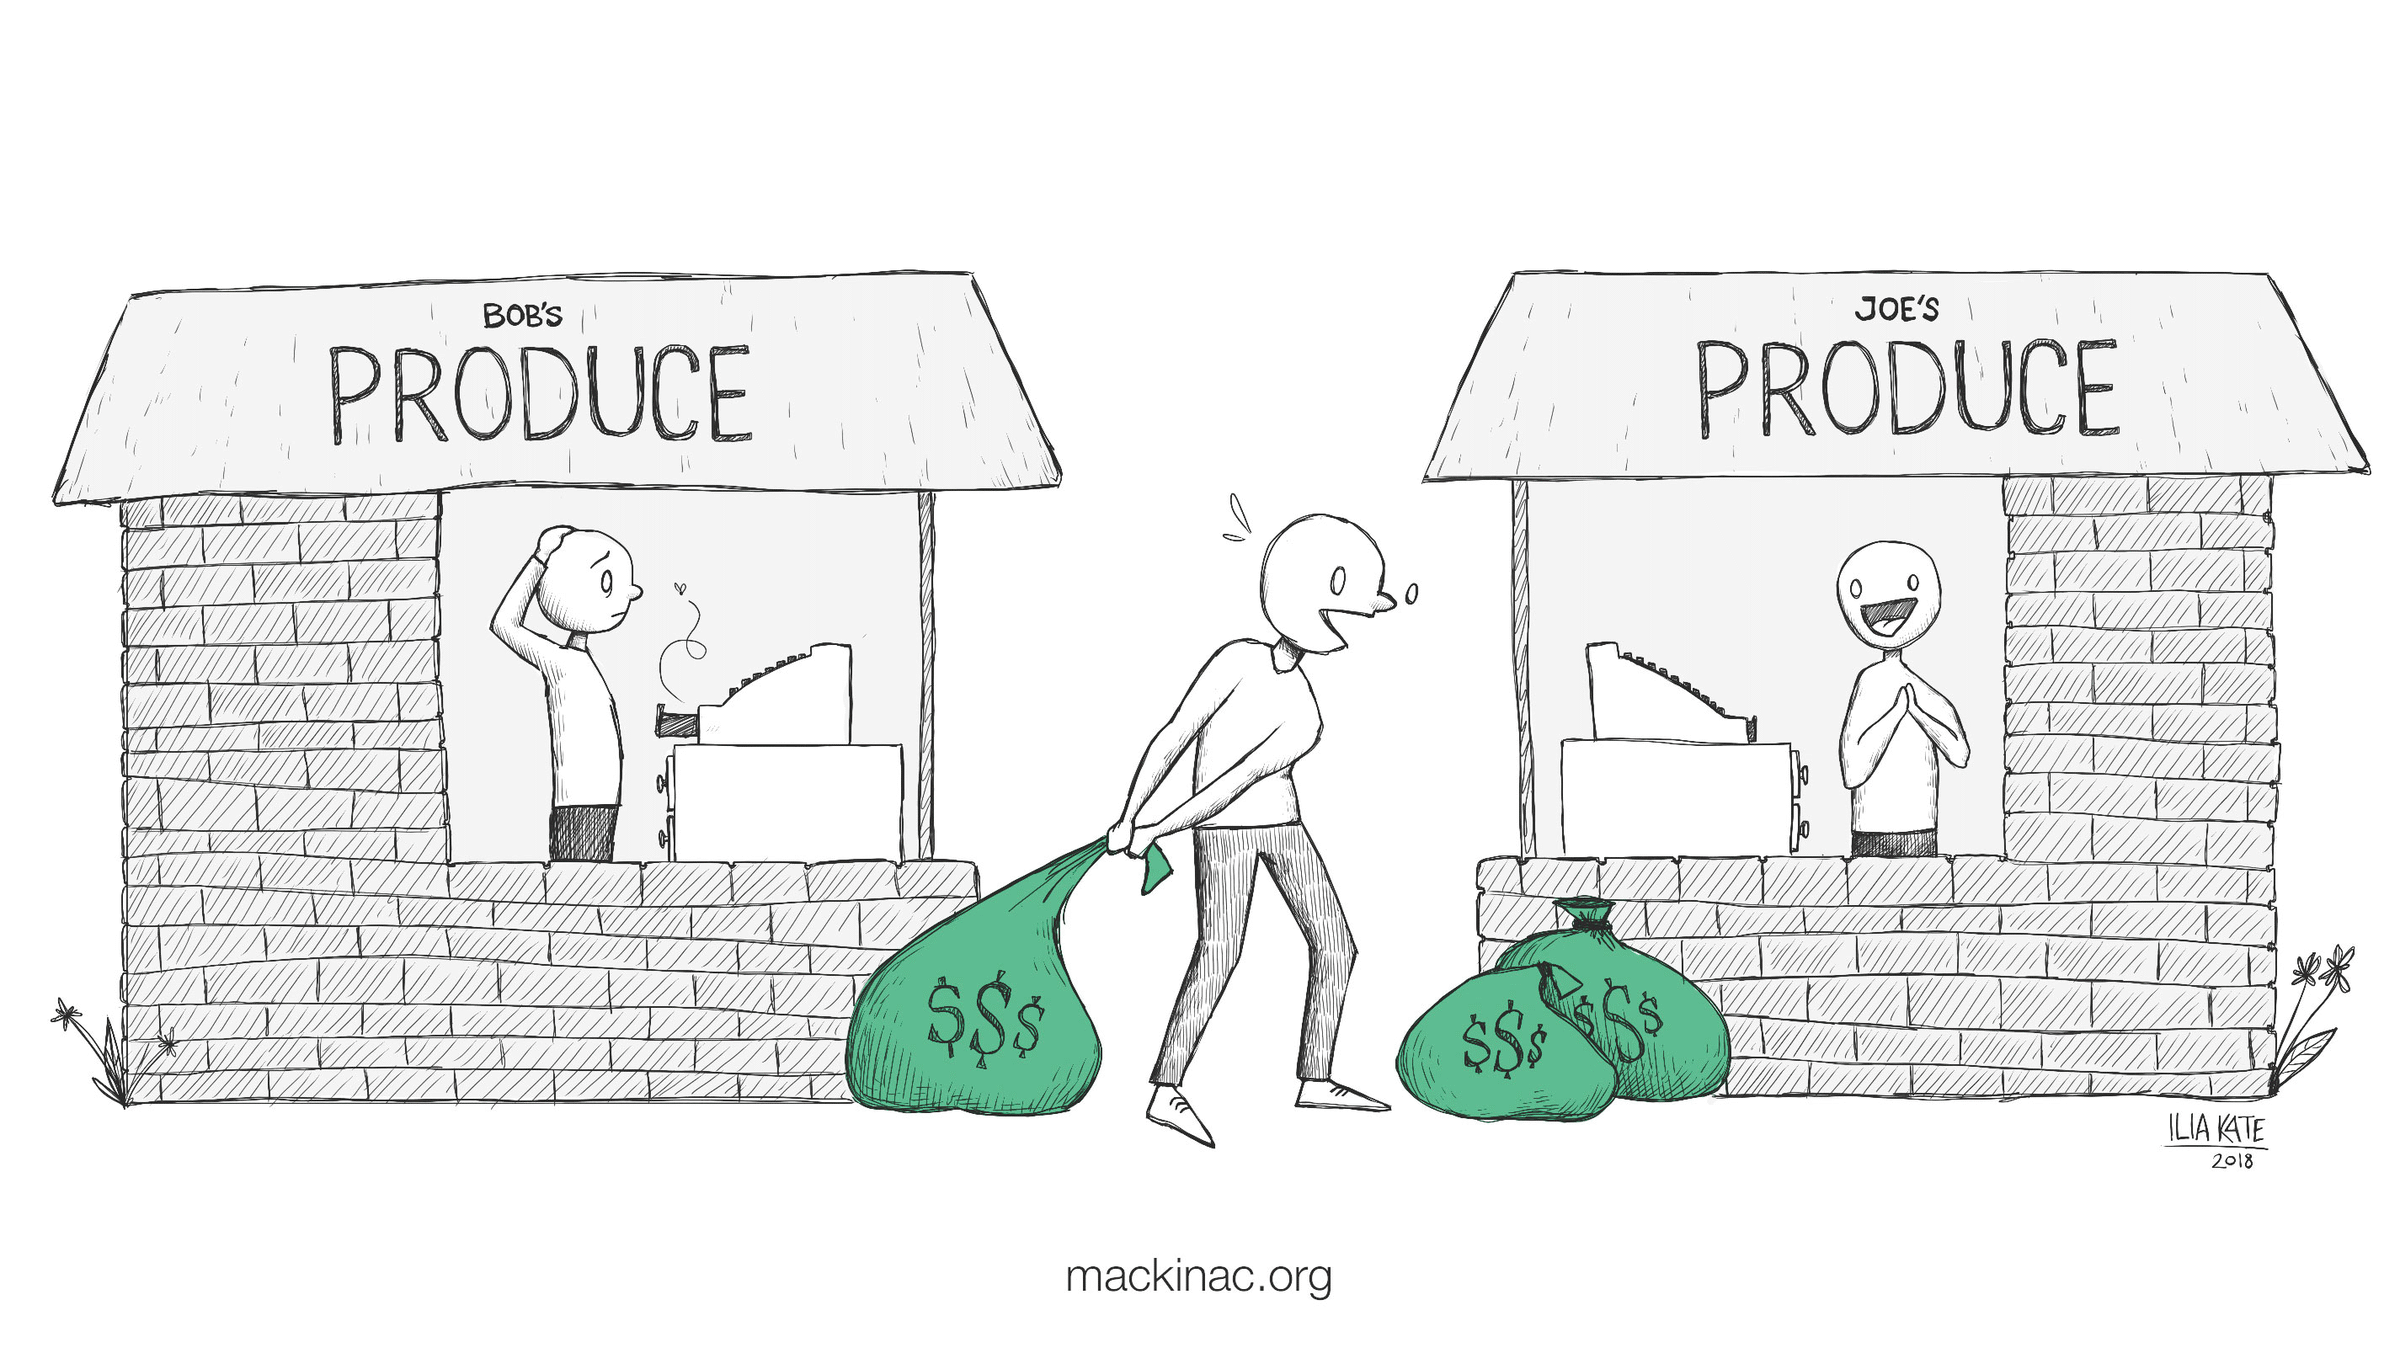
In Michigan, the state government operates a variety of select business subsidy programs that intend to create jobs and economic growth. Research shows, however, that most corporate welfare programs are ineffective. And they come at a cost: The next best alternatives for that money — cutting personal income taxes, reforming occupational licensure and fixing roads, for instance — are far more likely to create jobs and a positive return on investment for taxpayers. In addition, it’s just unfair to take money from everyone and hand it out to a favored few through the force of government.
Michigan’s corporate handouts have repeatedly failed. A 2020 study by the Mackinac Center for Public Policy examined up to 2,300 incentive deals the state has struck, going back to 1983. The study compared the number of jobs created at establishments that were incentivized through nine program or program areas and compared them to the record of like establishments in Michigan that were not. In five cases, we found no employment impact from incentive programs. In a sixth, the impact was negative. That is, incentivized firms underperformed similar establishments that had not received incentives.
In three programs, the Mackinac Center found a positive association between subsidies and added employment, but at a huge cost of incentives offered per job.
The MBDP is a grant and loan program that the Rick Snyder administration advanced to replace the state’s shuttered Michigan Economic Growth Authority program.
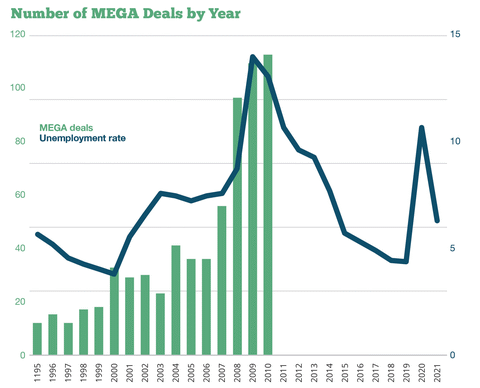
The MEGA was advanced by the administration of Gov. John Engler, but it expanded in size and scope during the 2000s, a time when Michigan suffered significant losses in employment, income and tax collections.
The state offered more than $14 billion to select companies through MEGA between 1995 and 2011. Five of six scholarly studies of the program found it had no effect or even a negative effect on the economy. Though the program is now shuttered, the state will still pay out $600 million in the 2022 fiscal year for tax credits promised through it. A seventh study of MEGA, published in 2019 in the peer-reviewed journal Growth and Change and titled: “Did Incentives Help Municipalities Recover from the Great Recession: Evidence from Midwestern Cities?” called the program a debacle.
From 2008 to 2015, the state also dished out $500 million for a separate film incentives program but could show little in the way of job creation as a result. A consultant hired by the state found the program was a net negative for the state treasury, though the research was not widely reported. The state also continues to appropriate large sums of money for tourism marketing efforts known as Pure Michigan, despite evidence they are ineffective.
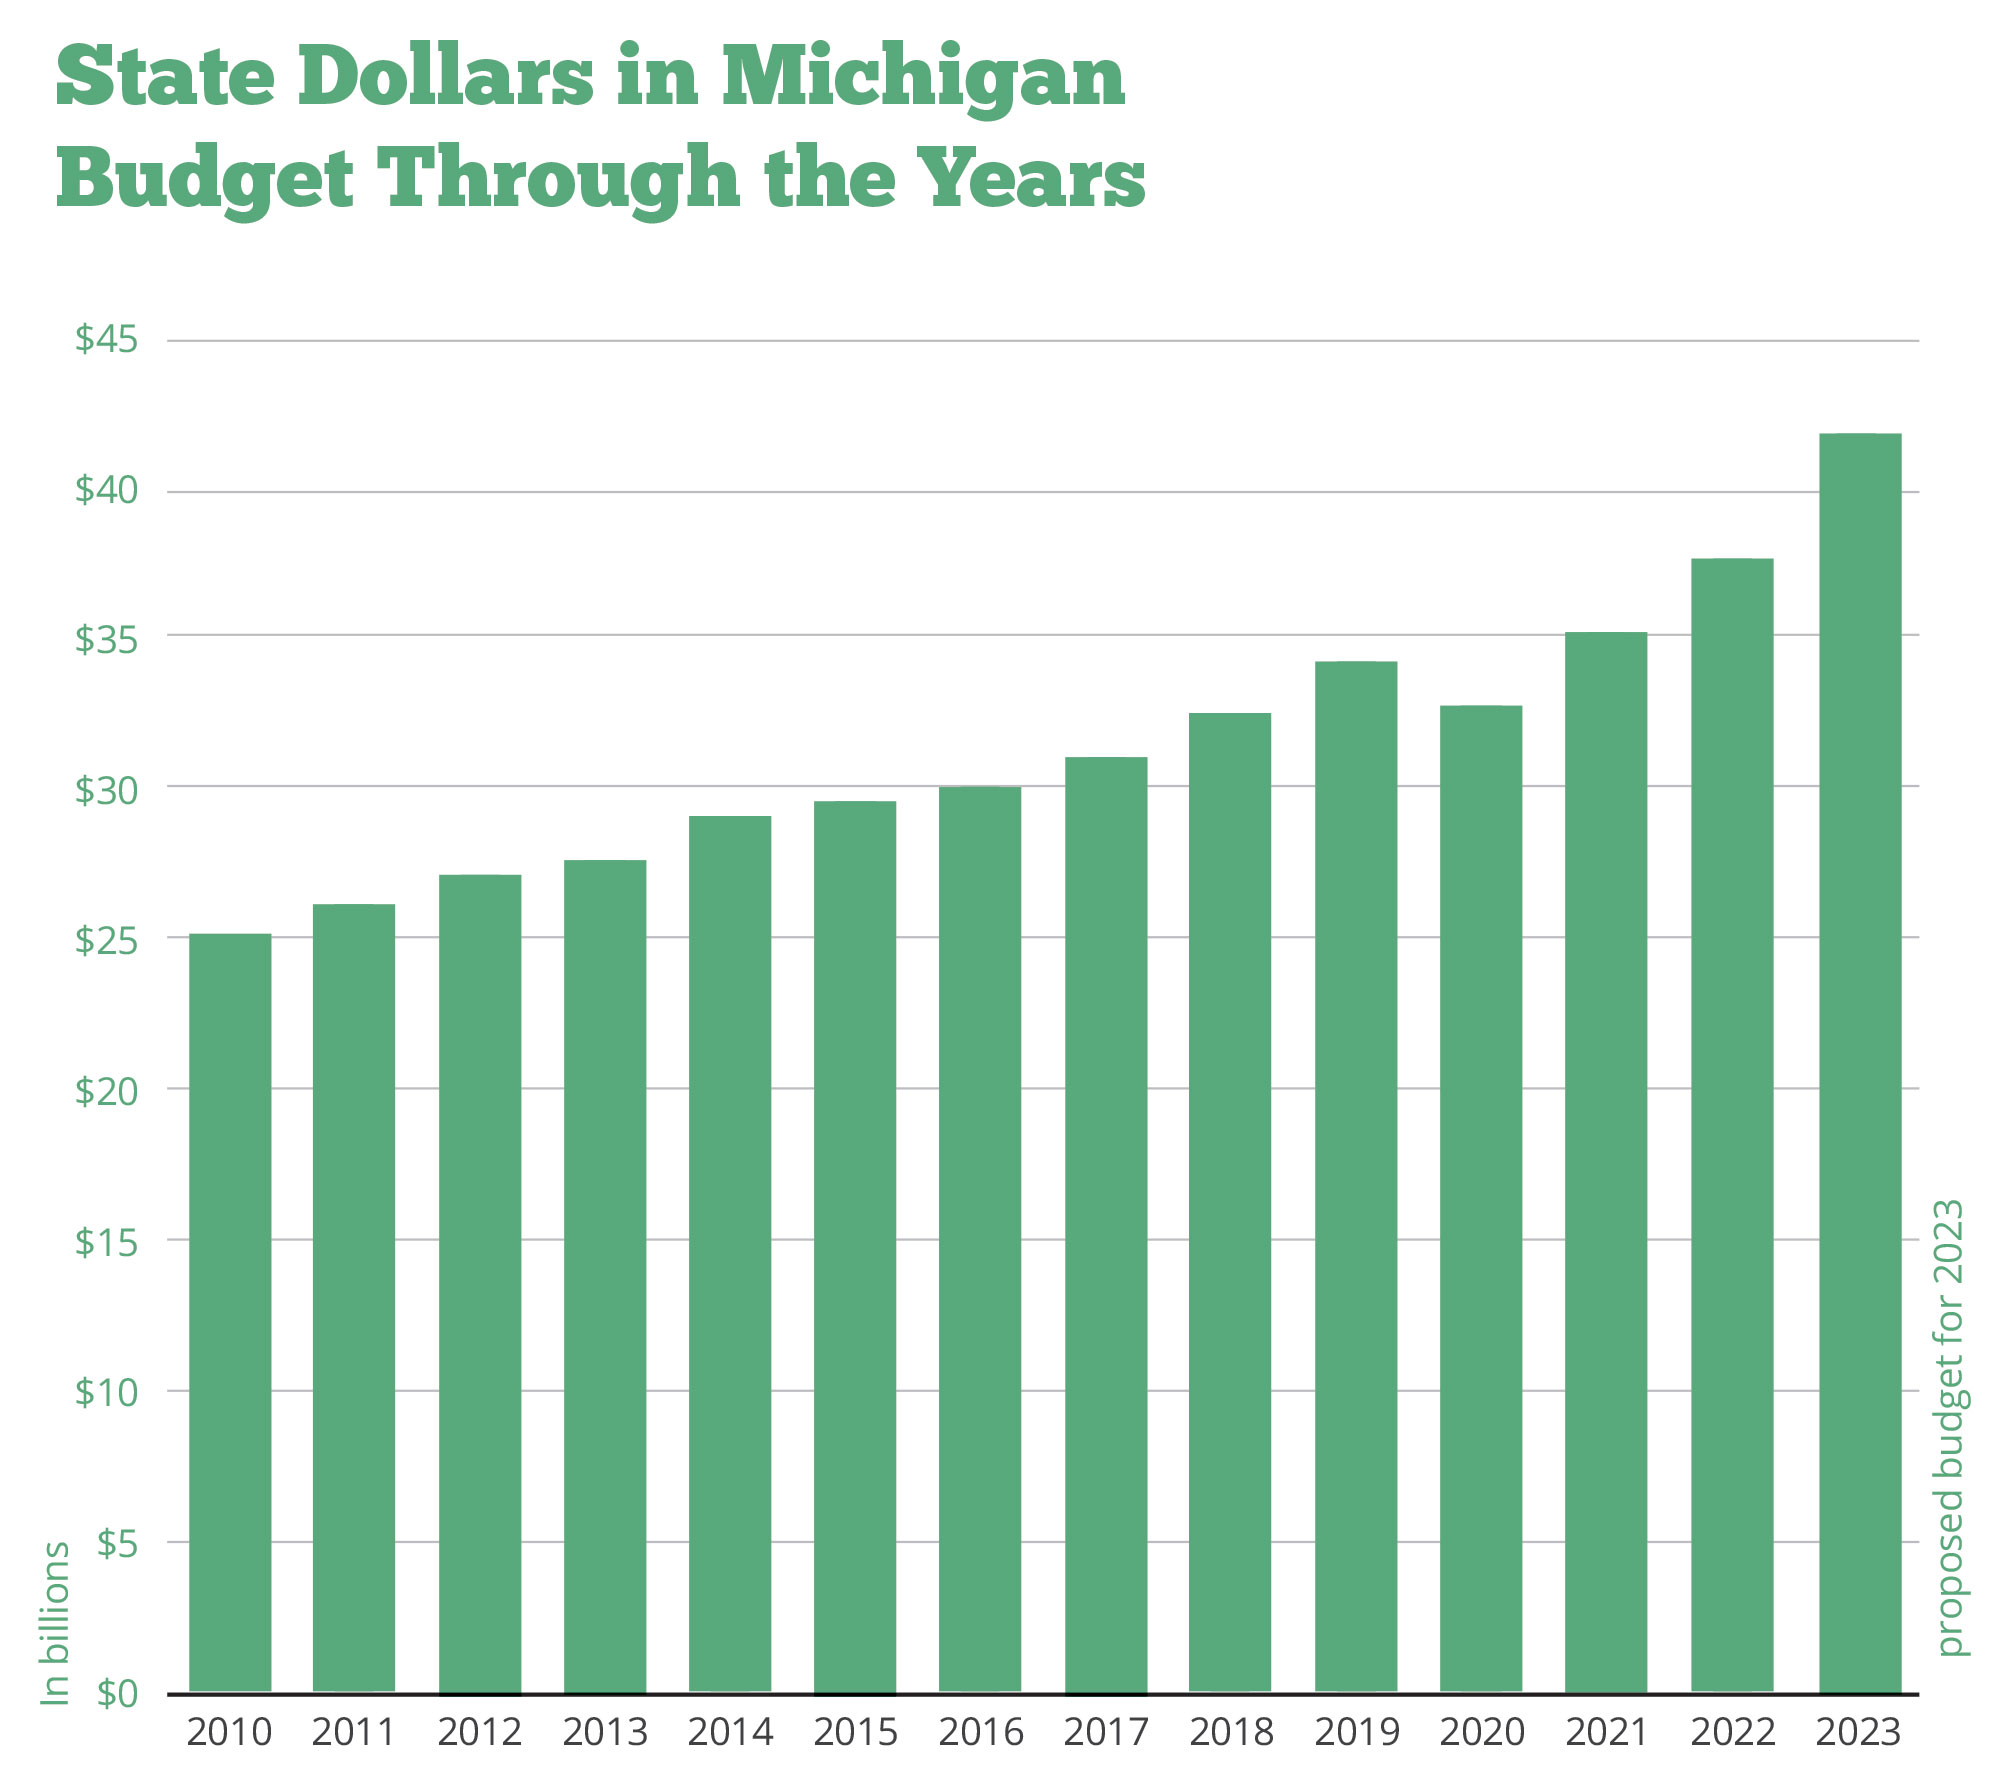
For the 2022 fiscal year, the state appropriated $184 million to the Michigan Strategic Fund for staff and program support. The fund is in charge of most of the state’s economic development programs, with an assist from the Michigan Economic Development Corporation. In addition to receiving money from legislative appropriations, the Michigan Strategic Fund receives Indian gaming revenues, which bypass legislative review. In 2020 that figure totaled $28.9 million.
Even if all the spending done by the state in the name of economic development were as effective as officials claim, it would barely make a dent in the state’s vast economy. Data from the U.S. Bureau of Labor Statistics showed, for example, that in the first quarter of 2021, Michigan’s economy created 297,237 jobs. During that same time, another 172,427 jobs were lost. The number of jobs the state hopes will be created during that same quarter thanks to subsidies is, by comparison, minuscule.
The best economic development reform that Michigan can adopt is one that does not discriminate. In the Mackinac Center’s 2002 “Manifesto on Economic Development,” Lawrence W. Reed and Michael D. LaFaive wrote: “Economic development is not what happens when governments take charge of the marketplace, bestow special privileges and handouts, or build vast bureaucracies with a know-it-all attitude. It’s what happens when government performs its own limited, core functions extremely well and otherwise leaves the rest of us alone.”
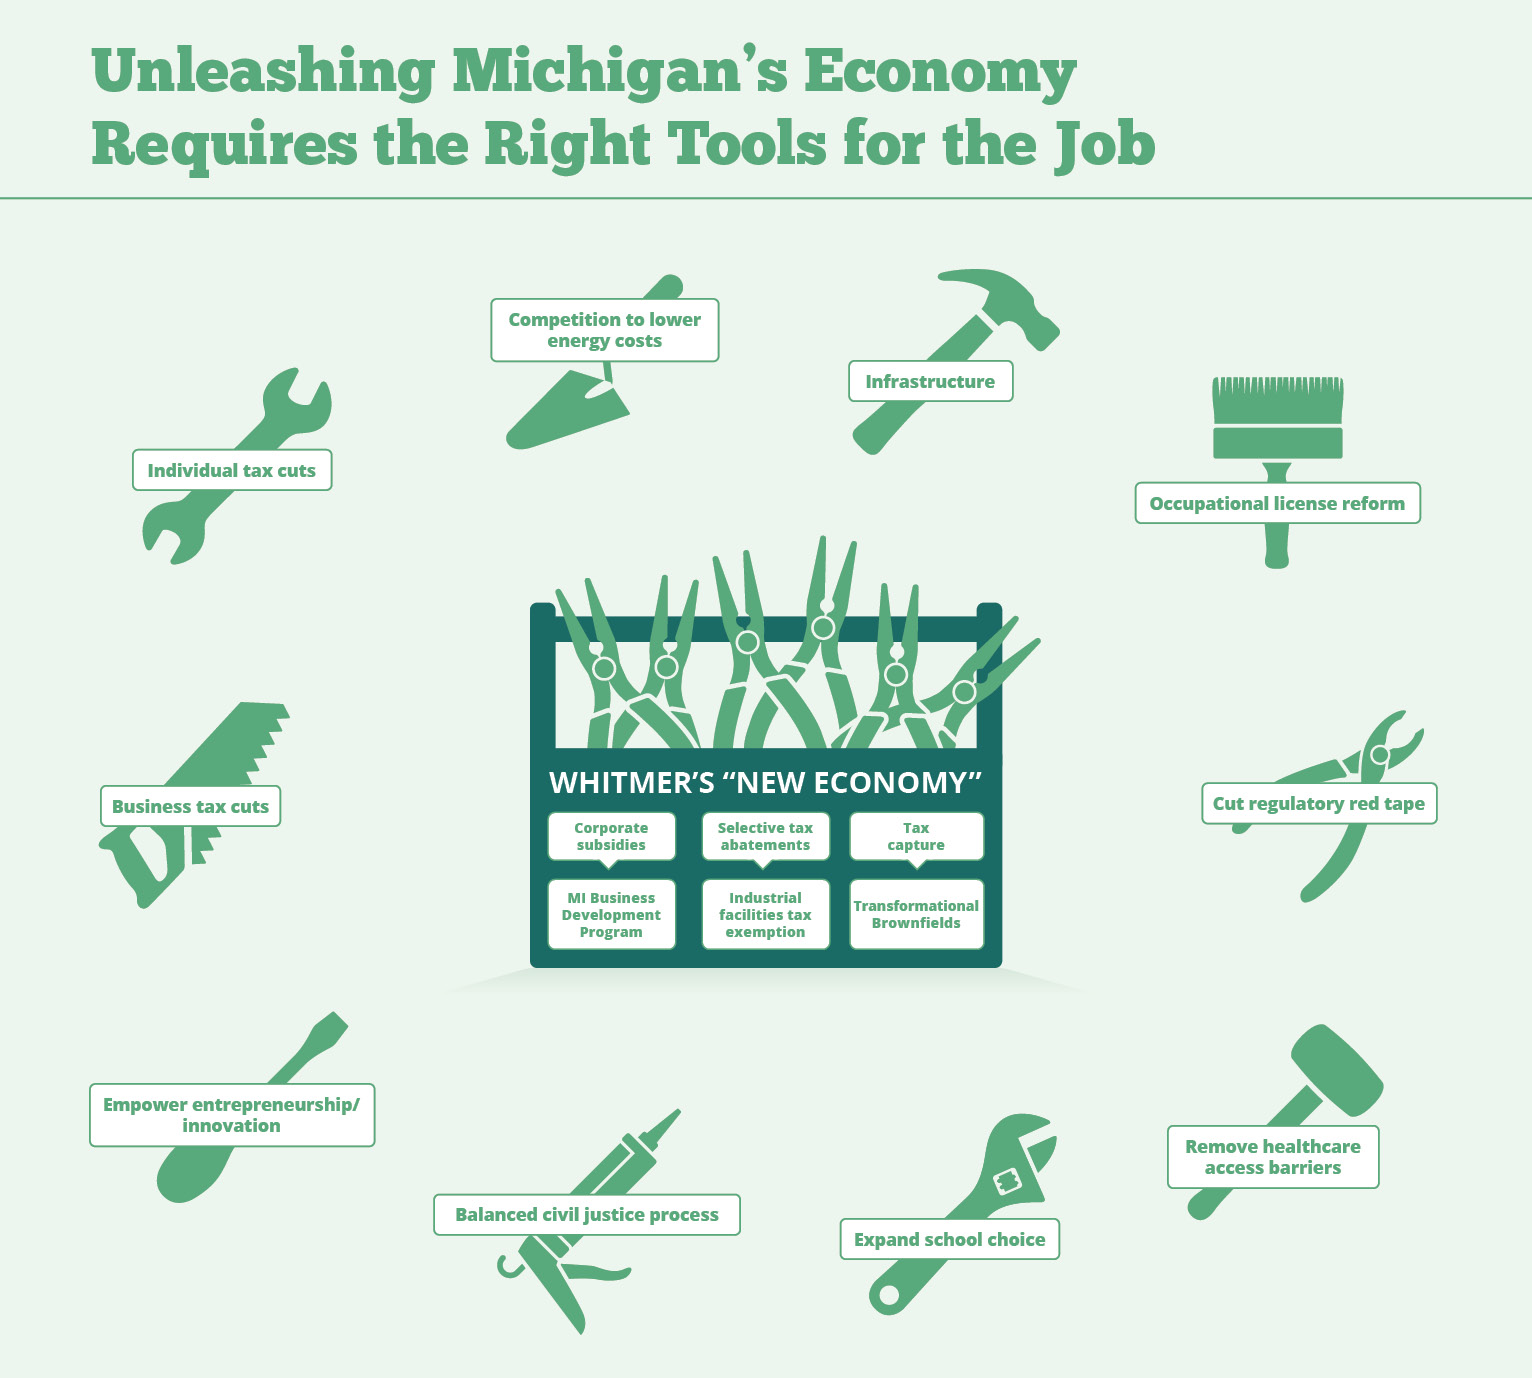
Here are a few specific recommendations for broad-based policy changes.
Cut Taxes
A 2014 review of studies published by the John Locke Foundation, titled “Lower Taxes, Higher Growth,” examined 681 academic papers, 115 of which involved local and state taxes. Of those, 63% show that “tax burdens were negatively associated with economic performance.” In other words, higher taxes harmed state and local economic growth. Only three of the 115 studies demonstrated that taxes were “positively associated with economic performance, all other things being held equal.”
One peer-reviewed study worth mentioning was the 2008 Cato Journal article, “State Income Taxes and Economic Growth,” which looked at both taxes and growth, with data spanning 1964 to 2004. It found “a significant negative impact of higher marginal tax rates on economic growth.”
It’s worth noting here, too, that Michigan residents are still owed a tax cut. In 2007 lawmakers promised that the 11.5% personal income tax hike they were imposing, which took the income tax rate to 4.35%, would be temporary. Under the enacting statute, the tax hike was to be rolled back in 2011. It was, however, only cut to 4.25%, and further rollbacks were scrapped.
In 2017 the Mackinac Center for Public Policy estimated that rolling back the personal income tax rate from 4.25% to 3.9% could add 15,000 jobs to the state’s economy in about one year.
Reduce occupational licensure burdens.
Some costs that government imposes on working may not meet the definition of a tax, but they can still kill jobs and thwart work. The 2018 Institute for Justice study, “At What Cost,” made the case that occupational licensing requirements do just that. In Michigan, nearly 80,000 jobs each year may be lost to licensing mandates. Reducing licensing burdens, it follows, could lift job creation dramatically.
In a 2020 working paper titled, “Occupational Licensing Effects on Firm Location and Employment,” economist Alicia Plemmons examined how licensing shapes firms’ decisions to locate and hire near state borders. She sought to measure changes in states that border each other, with one state imposing a high-licensing regime and the other having a low-licensing one.
She found, among other things, “When a state becomes more expensive relative to its adjacent state, firms are less likely to locate on the more expensive side of the border. These effects differ by industry and have larger magnitudes for firms in labor-intensive industries.” She also found that there were 2.3 fewer employees per firm in a high-licensing state if the firm was located within 5 kilometers of a neighboring state.
Other Ideas for Boosting the Economy
Of course, these are not the only across-the-board changes that would help create jobs. We could make the case for a robust initiative for parental choice in education, or reintroducing greater electricity choice to help drive down utility costs for businesses and residents. Indeed, the cost of electricity in Michigan is one of the top reasons cited by the Ford Motor Co. in its decision to locate new production facilities in Kentucky and Tennessee, and not its home state.
We would also argue for key health care reforms to allow for patient choice and entrepreneurship among medical professionals. The list of broad-based policy reforms that could serve as alternatives to targeted corporate handout programs is long.
If we eliminate corporate handouts, won’t we unilaterally disarm in the war for jobs?
No. A large body of research demonstrates that incentive programs are ineffective. Those who advocate for them are fighting for job announcements more than actual jobs.
In one of the most sweeping academic reviews of scholarly literature on the subject, economists Peter Fisher and Alan Peters concluded, “The most fundamental problem is that many public officials appear to believe that they can influence the course of their state or local economies through incentives and subsidies to a degree far beyond anything supported by even the most optimistic evidence.”
Has anyone ever called for multilateral disarmament?
Yes. Legislators in several states have introduced bills to do just that. The idea is to create a state compact to eliminate a war of economic incentives between states. Michigan lawmakers have introduced and could pass such a compact, and it wouldn’t take effect until other states agreed to join it and put their programs on ice. To date, that legislation has languished while lawmakers work to create more corporate incentive programs.
Aren’t many of these incentive deals sold to the public as costless?
Yes. For years, proponents of corporate handout programs have said they were performance- based and repeated the mantra that if the corporations don’t create the jobs, they don’t get the incentives. But a performance-based standard is an illusion: If jobs show up, the government can’t know whether the company wasn’t going to create jobs here anyway.
There is also research on the question published by the W.E. Upjohn Institute for Employment Research. It suggested that 75% to 98% of the incentives that were handed out in the name of relocating, expanding or maintaining jobs went to companies that “would have made a similar decision ... without the incentive.”
Do politics play a role in economic decisions?
Yes. It is easy to speculate that it does, given that these economic programs are born of a political process. But we have more than speculation; scholarly research suggests that politicians who propose subsidy programs receive electoral benefits.
In 2020, for example, Cailan Slattery and Owen Zidar found that “per-capita incentive spending increases by more than 20% in half of the cases in which it is an election year and the governor is up for re-election versus one-fifth of the cases otherwise.” Nathan Jensen and Edmund Malesky found that the “marginal impact of incentives on the probability of independents voting for a governor is 9.2%.”
That’s a big move, and it may at least partially explain political support of demonstrably ineffective programs.
Short of eliminating these programs, what can be done to minimize their abuse?
In addition to adopting the state compact mentioned above, there must be greater transparency and accountability around corporate handouts. Legislation has been introduced here to require members of the state’s economic development board to disclose the details of any handout deal before they vote on it. A law like that gives everyone a chance to determine if the costs might outweigh the benefits.
The state should also be required to perform or have performed better analyses of potential deals before they are struck, to make sure the benefits are likely to outweigh the costs. That means, at a minimum, performing an opportunity-cost analysis where the potential expense is weighed against some other action, such as a personal income tax cut.
Behind all of the deep, scholarly statistical analyses is a raft of anecdotes, many of which the Mackinac Center has reported on in detail over the years. Consider the following companies and the deals they received.
The Michigan Business Development Program offered a $2 million subsidy through to a subsidiary of Biogenic Reagents, located in the Upper Peninsula, in the hope a project there would create 27 jobs. The firm was also given a Renaissance Zone designation that would exempt it from real and personal property taxes. State bureaucrats rolled taxpayer dice for a company that officials knew was, to use their term, “pre-revenue.” State documents show that the company’s leadership told state officials that the firm had a $2 million debt payment due, and without the government subsidy “the project could be at risk.” Lansing bureaucrats gambled anyway and taxpayers lost. In 2018 a spokesperson for the Michigan Economic Development Program said, “We have not received any repayment, and at this point don’t expect that we will. The asset sale was not sufficient to cover all of the creditors, including MSF.”
The story above is hardly the first-time state officials have used the public purse to place a huge bet on a company. One company that received state funds from the 21st Century Jobs Fund, and an offer of tax credits, as well as federal money, was A123 systems. It filed for bankruptcy in 2012 after being enthusiastically praised by supporters of subsidies, including President Barack Obama and Michigan Gov. Jennifer Granholm.
The history of the Michigan Economic Growth Authority is littered with big promises and big failures. Walden Books was among a group of the first three MEGA tax credit deals (worth up to $7.7 million) ever struck in 1995. Company officials had to assure the state that the MEGA subsidy was the reason they were moving their headquarters to Michigan. They did move it, but journalists discovered that executives for the firm had put down deposits on homes in the Ann Arbor area before MEGA was even passed into law. This suggests the firm was moving here anyway and just enjoyed a windfall courtesy of taxpayers. The company filed for bankruptcy in 2011.
The dot-com era led to a number of poor decisions by state officials. One beneficiary, internet darling Webvan.com, was described by the Michigan Economic Development Corporation as “one of the best-financed retailers on the market” when its $23.4 million MEGA offer was announced in December 1999. At the time, the stock was trading at more than $18 per share, but a year later, the stock was worth 47 cents per share. The company would ultimately file for bankruptcy and vanish into dot-com history.
The company, thankfully, never collected on its award. The deal did illustrate in bright lights the inability of government officials to consistently separate market winners from losers and then bet on the winners. That’s why they shouldn’t try. The marketplace has been creating jobs long before there were state governments. It will continue to do so in the absence of subsidy programs and bureaucratic meddling in the economy.
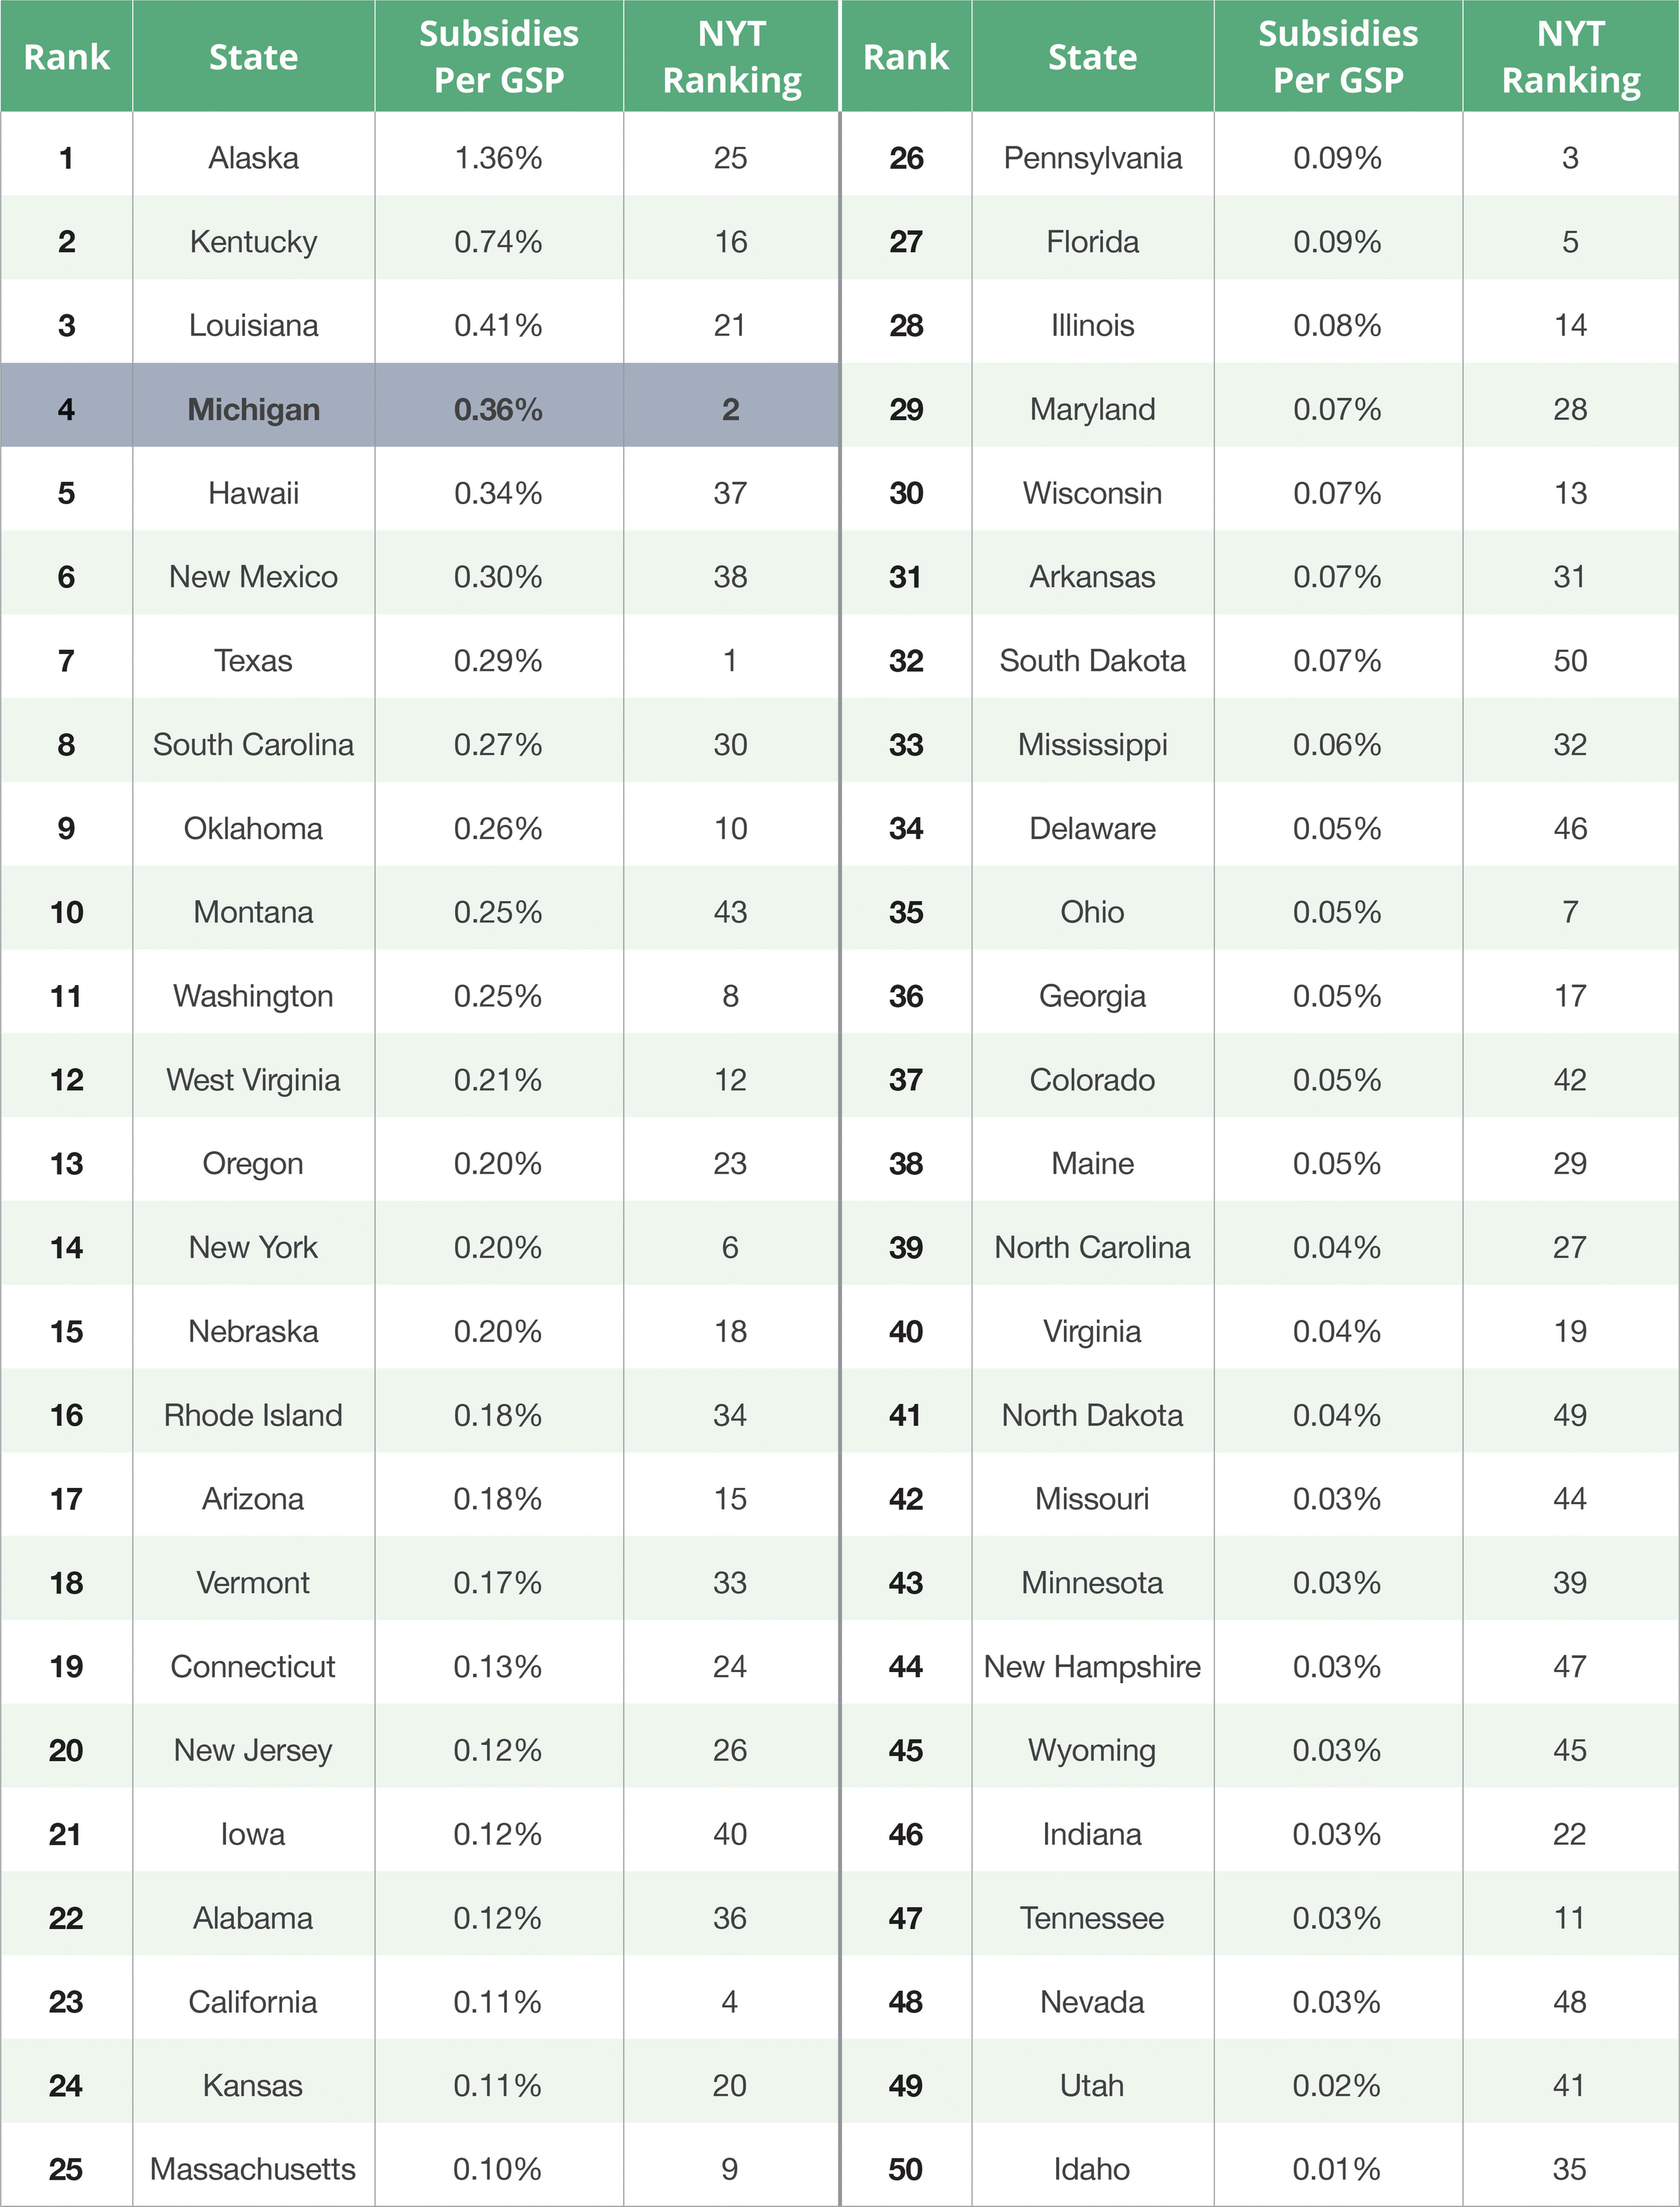
Michigan’s bets have been costly, with the state making substantial payouts of targeted incentives: We ranked fourth in subsidies nationwide, by one measure (See Graphic 2, below). The table below was based on 2012 estimates made by The New York Times and then adjusted by Mackinac Center scholars. It accounts for subsidies as a percentage of each state’s gross state product. State GSP is a measure of the value for industrial output, and the GSP calculation helps put subsidies in perspective, especially if we wish to compare states to each other.
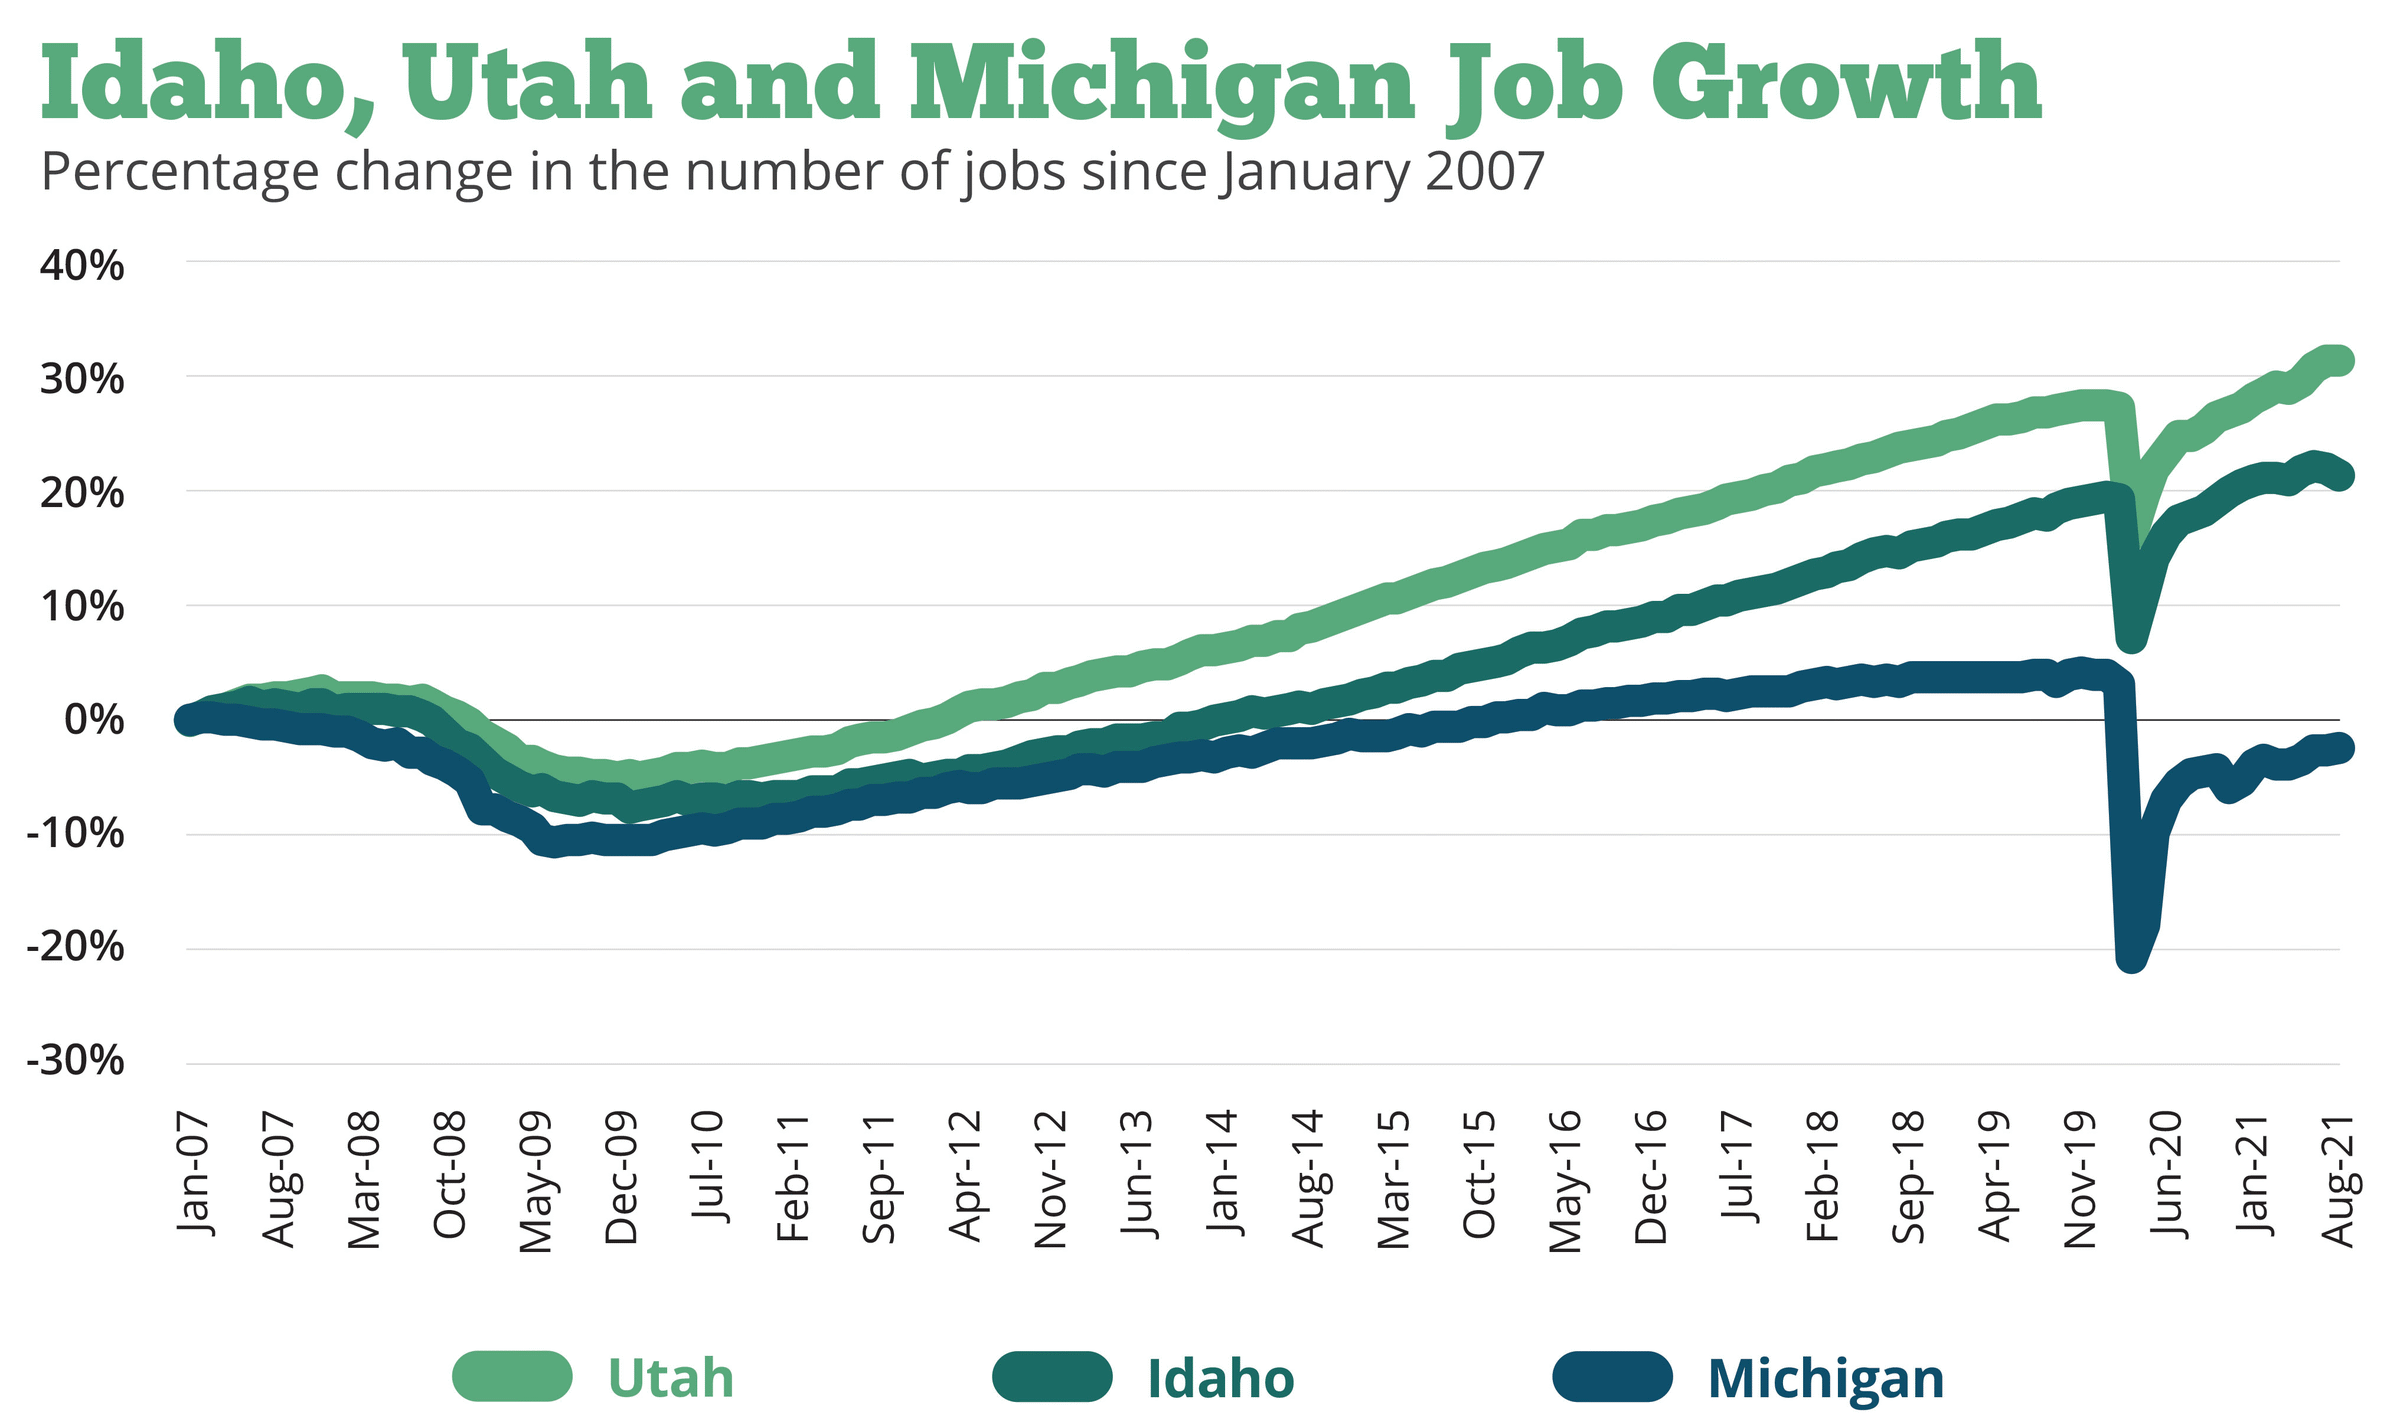
Despite Michigan’s high payouts in 2012 — and payments after that — its inflation-adjusted GSP ranked just 32nd among the states from 2012 to 2020. Contrast that with Idaho, which gave out the fewest subsidies of any state, as a percentage of GSP. Its GSP growth was third among the states over this period.
Maybe there’s something unusual about Idaho that drives its growth. Or maybe it is yet another example that states need not hand out free lunches to targeted corporations to grow their economies.