This pathbreaking approach to expanding parental choice in education embodies a proposal to amend the Michigan constitution and establish a Universal Tuition Tax Credit (UTTC). The tax credit would offset a portion of private or public school tuition and would be claimed against state tax liabilities. In addition to improving education, the UTTC would save the state hundreds of millions of dollars per year. Unlike other tax credit plans, the UTTC would help needy families with low state tax liabilities by encouraging the creation of corporate scholarships to offset tuition costs not covered by the UTTC. The per-student credit could be claimed against the Michigan tax liability of any person or corporation. Unlike vouchers, the UTTC would not allow state funds to support religious schools, would not drain funds from the public schools, and would not spawn new entitlements or overregulation of private schools. The study includes detailed fiscal models, a discussion of school choice, a history of Michigan's constitutional impediments to education reform, and proposed language for a constitutional amendment. 76 pages
Parental choice in education—whereby parents have the freedom to choose the school their children attend—is seeing explosive growth in popularity and implementation. Instead of sending children to an assigned school based on residence, Michigan parents have asked for and received the ability to send their children to public schools outside their home district and to create new charter schools to meet special needs and interests.
This study from the Mackinac Center for Public Policy presents a path-breaking approach to expanding parental choice in Michigan education. It embodies a proposal to amend the Michigan Constitution and establish a Universal Tuition Tax Credit (UTTC). In addition to improving public education, the UTTC will save the state $3.4 billion in education expenses in the first ten years of implementation and over $500 million each year thereafter. These savings could be used to support additional educational programs, address other budget priorities, or reduce taxes on Michigan citizens or businesses.
Section I reviews why parental choice is the most important systemic education reform and evaluates various ways to expand it. In spite of the fact that parents are entrusted to make vital decisions in nearly every area of their children’s lives, most Michigan parents are unable to make true choices about education, one of the most important aspects of their children’s development. Most children are sent to a government-mandated, government-assigned school.
Choice is the engine for a market economy in all goods and services. The foundation of basic economic theory is the ability of individual consumers to choose one good over another based on their own preferences. Parents prefer good schools over poor schools for their children. Assigning children to schools, based on where students live, deprives parents of the freedom to apply their own values and priorities to selecting a school, and it deprives schools of valuable marketplace incentives that drive continuous quality improvement.
Today, 12 percent of Michigan children—over 220,000—attend alternative schools which charge tuition. Alternative schools include both private schools and public schools; the latter may charge tuition when parents choose a public school outside the home district and the home district superintendent refuses to release funding. The best way to expand parental choice is to eliminate the penalty for parents who must pay twice for alternative schools: once through tuition and then through taxes.
Section II examines Michigan’s constitutional prohibition on including nonpublic schools in an open system of parental choice.
Section III reviews several methods of expanding parental choice. The study concludes that, although both tuition vouchers and traditional tuition tax credits could be used to eliminate the problem of double payment, both have disadvantages. Vouchers, for example, are subject to allegations that they drain funds from public schools, permit state funds to be used to support religious schools, will spawn a new type of entitlement program, and invite overregulation of private schools. Traditional tuition tax credits—whereby only parents are allowed to receive a tax credit—address some of the problems with vouchers, but fail to help low-income and many middle-income families who lack enough tax liability to benefit.
Section III sets forth the details of the UTTC plan. Although both vouchers and traditional tax credits would be an improvement over the current system, the UTTC is designed to capitalize on the strengths and minimize the weaknesses of each. The UTTC has the following features and benefits:
It gradually phases in a tax credit for tuition paid to any Michigan elementary
or secondary school—public or private. It is a direct dollar-for-dollar credit
against taxes owed, not simply a deduction.
The tax credit may be claimed by any taxpayer—individual or corporate. This
includes a student’s parents as well as relatives, friends, neighbors or businesses.
A large company, for example, could pay $2,000 tuition for each of 1,000 low-income
children and receive a $2,000,000 tax credit.
The tax credit applies to three major state taxes: the Individual Income tax, the Single
Business Tax, and the 6-mill state education property tax. These taxes represent state
revenue of approximately $7.5 billion.
It is a per-child tax credit, allowing the full credit to be applied to each child in a
family.
The amount of the credit is limited to the lesser of
Fifty percent of the amount Michigan public schools receive to educate each child. This percentage begins at 10 percent and increases to the 50 percent maximum over 9 years.
Eighty percent of the actual tuition paid. This produces incentives for schools to keep tuition rates reasonable, since not all of the payment will offset tax liability. If the student is from a family whose income is below the federal poverty level the credit is 100 percent of actual tuition paid. This makes it easier for low-income students to benefit.
It does not affect city, county, or township finances.
The UTTC produces significant savings to the state. Since the UTTC will make alternative schools more affordable, more parents will transfer their children from traditional public schools to alternative schools. With the maximum credit limited to 50 percent of per-pupil public school revenues, every student who transfers to an alternative school produces a net savings of at least half of per-pupil revenues. For example, in the 1996-97 school year, the average per-pupil public school revenue is approximately $5,600. The maximum tax credit would therefore be $2,800. If a student transfers to an alternative school, the state must no longer spend the $5,600 and at most loses $2,800 through the tax credit, producing a minimum net savings of $2,800.
Since the average tuition at private schools—which constitute the vast majority of alternative schools—is roughly half of public school per-pupil revenue, the amount of the tax credit provides enough incentive for parents to consider the alternative school option.
Section IV and Appendix I present a comprehensive analysis of the impact of the UTTC on student enrollment and state finances over a 10-year period.
The report includes detailed guidelines and analysis, including:
The complete text of a proposed UTTC constitutional amendment (Section III).
Key elements of the implementing legislation, including sample forms and procedures
(Section III).
Answers to commonly asked questions regarding the UTTC (Appendix II)
When the lights go on in bedrooms across Michigan on early school day mornings, young children are roused from their beds by their parents. During that day, these parents will be called upon to decide what foods their children will eat and what foods they will avoid. These parents will decide with whom their children will play, how much television they will watch, and how much homework they will do. These parents will decide which physicians will treat their children’s injuries, which dentists will check their teeth, and which baby-sitters will care for them in the parents’ absence. As their children grow, these parents will help them decide which clubs and organizations to join and which courses of study to pursue. As the young people approach high school graduation, these parents will offer counsel regarding future educational and vocational pursuits.
Yet in spite of the fact that parents are entrusted to make vital decisions in nearly every area of their children’s lives, most Michigan parents are unable to make true choices about one of the most important aspects of their children’s development. For 180 days of the year, most children are sent to a government-mandated, government-assigned educational institution.1
But slowly, things are beginning to change. Historians who look back on the 1990s may well view this decade as one of true educational reform—a turning point when Americans not only talked about reform but individually and collectively made choices about their schools and the quality of American education.
Although it has been decades in coming, educational choice is breaking out all over America. Milton Friedman, in Capitalism and Freedom, kicked off the modern school choice debate in the 1960s by proposing educational vouchers.2 Parental choice in education involves a broad umbrella of plans, which enable parents to make choices about the education of their children. A Heritage Foundation review of parental choice programs throughout the states indicates that school choice or open enrollment legislation was introduced or pending in 28 states in 1995. 3
The choices parents and their children are making go beyond the selection of another school within the same district. Throughout the country, families are taking advantage of charter schools, voucher systems, tuition tax credit plans, and other innovations providing for public and private school choice alternatives to traditional government schools. Wisconsin and Ohio have instituted new choice options for some of their urban parents. Vermont, on the other hand, continues private and public school choice options for many of its rural citizens under a program started in 1869.4 In 1997 both Arizona and Minnesota approved educational tax credits. Arizona now allows a credit of up to $500 for donations to organizations that provide scholarships to private school students. The Minnesota plan allows families with incomes of $33,500 or less a $1,000 per child ($2,000 maximum per family) tax credit for tutoring, textbooks, transportation, computers, and instructional materials. Families with incomes of more than $33,500 receive a tax deduction (up to $2,500) for private school tuition as well as the expenses covered under the tax credit.
In Michigan, parents now have the option of sending their children to public school academies, also known as charter schools. In fact, 1996 could easily be designated the year of the charter school in Michigan. As 34 new charter schools opened their doors in Michigan in 1996, bringing the total number of public school academies to 78, a small segment of parents and school-aged children enjoyed increased educational options.
In the post-Civil War period, the concept of a common-school system was advocated as a "right" and then institutionalized in the early 1900s as a mandate in many states for children from ages 6 to 17. Since that time, students and parents who have made use of the public school system have been generally assigned a specific school. The first such assignments were informal, based on the availability of schools for a particular area. Later, as American cities became more cosmopolitan and students living in rural areas had better transportation and access to schools, such assignments were based on where the school-aged children lived in relation to the schools; in many cases, two children residing on opposite sides of a street might attend different schools, depending on where the school district lines were drawn.
Indeed, much of American history is reflected in the gradual movement from wholly private schools to community schools that were similar to private schools today and then to government-mandated "public" schools that were supported by taxpayer dollars and filled by government assignment and compulsory education laws. As the United States grew more urban and professional, so too did its school system. At the same time, the individual and community autonomy melted away as state governments—and more recently national governments—assumed increasing authority. As government became more powerful, political calculations dominated the design of school systems. The exclusion of American blacks from many public schools is but one unpleasant consequence of this dominance of government and politics in schools as is the rise of the suburban school districts as "asylums" from the city.5 While government schools achieved some of the goals of the common-school movement, they also brought with them many ills.
This study uses the terms "alternative school" and "alternative school student" to refer to any situation where tuition is paid for a student to attend a nonpublic or public school. Some public schools charge tuition when parents choose a public school outside the home intermediate school district and the home district superintendent refuses to release funding. The vast majority of alternative school students, however, are in private schools. In either case parents pay tuition to the school.
Although parents have always had the option of sending their children to alternative schools, often wealthier parents were the only ones who could afford to take advantage of this opportunity with the hope of providing a better education for their children than the assigned public schools might provide. Parents who elected to make use of the assigned public schools could make choices about their schools only by choosing where to live; in fact, home buyers with children have long identified the quality of the local school district as one of the primary considerations when choosing a home. Yet here, too, parents experienced financial constraints because the cost of property tends to be higher in the better school districts. Thus, a system of "assignment" has left parents in a relatively passive role in relation to school selection. It was only with the advent of school choice programs that children attending many public schools began to enjoy some of the choices that their more economically advantaged counterparts enjoyed all along.
Parents can choose to send their children to alternative schools in an assignment system, but they effectively have to pay twice. They pay tuition out of their pockets, and they pay property, income, and sales taxes, which go toward the support of the government education system. In Michigan today, Proposal A and its accompanying legislation did reduce the property tax burden shouldered by many Michigan citizens and businesses. However, the proposal did not eliminate the double payment situation since Michigan citizens must still pay the higher sales tax and the property taxes dedicated to support the government school system. 6
Parents can also exercise choice in an assignment system by selecting a residence in a school district they desire. However, this is still a very limited choice and unavailable to many families, especially those in lower income brackets who cannot afford homes in desired school districts.
In their daily lives as consumers, people make decisions about the products they consume. As the markets in these various products have expanded over the years, manufacturers have given consumers more choices in order to compete with other companies. Competition causes quality to increase and firms to operate more efficiently. The growth of the advertising industry on Madison Avenue can be attributed to the increased number of choices and the need to measure and compare them. 7 Choice is the engine for a market economy in all goods and services. The foundation of basic economic theory is the ability of individual consumers to choose one good over another based on their own preferences. Parents prefer good food for their family over poor food. As a result of economic freedom, they have the right to choose better food, even if it means that better restaurants and grocery stores thrive while others close. Parents prefer better automobiles over poorer ones. They have the right to choose the cars they want, even if it means that some auto-makers expand production and others close plants. Parents prefer good schools over poor schools for their children. Why shouldn’t they have the right to choose better schools for their children?
The empowerment and transformation of parents into active agents is the foundation of educational choice theory. As a review of any literature on the subject of choice will indicate, parents are the primary advocates for school choice. A strong correlation has long been noted between parental involvement and children’s success in school. Parents who advocate choice have asserted consistently that they consider their children’s education a significant responsibility. The concept of choice takes full advantage of parents’ valuable knowledge about their children and their respective talents, abilities, and learning styles. This information equips parents to make optimal choices about where their children should attend school and what kind of school might best suit their children’s temperaments. Parents thus have the opportunity to become active agents in their children’s education. Rather than be intimidated by this responsibility, parents who are able to make choices about schools generally feel empowered, which allows them to continue to play a full, active role in their children’s education. 8
A second reason parental choice works is that it allows educational programs to be tailored to the needs of individual students, not simply provided as a one-size-fits-all package. In what has become one of the seminal works on the educational choice movement, Politics, Markets, and America’s Schools, John E. Chubb and Terry M. Moe explain that the system of public education created in the early twentieth century "was bureaucratic and professional, designed to ensure, so the story goes, that education would be taken out of politics and placed in the hands of impartial experts devoted to the public interest. It was the ‘one best system.’"9 As they argue against the one-system concept, Chubb and Moe emphasize the role that a market system could play in education:
A market system is not built to enable the imposition of higher order values on the schools, nor is it driven by a democratic struggle to exercise public authority. Instead, the authority to make educational choices is radically decentralized to those most immediately involved. Schools compete for the support of parents and students, and parents and students are free to choose among schools. The system is built around decentralization, competition, and choice.10
The work of Chubb and Moe underscores a basic tenet of choice—the idea that competition will enhance the diversity and the quality of the entire educational system. As parents choose schools for their children, the schools they leave behind are forced to improve in order to compete; engaged in competition, these schools provide the energy for their own regeneration, thus improving the entire educational system.
The market approach that provides the philosophical underpinnings for the concept of school choice acknowledges the truth about children as students: that they have different educational needs and learning styles, and that they have a right to seek out a school that will best match their needs and aptitudes. The market system can offer diversity in the type of education offered to students as well as improved quality of the schools.
Gary Becker, the Nobel Laureate in Economics, addressed the "human capital" aspect of school choice in a presentation in Grand Rapids, Michigan, on October 24, 1996.11 Human capital is the investment in training, education, health, values, and other aspects of human potential. Human capital investments increase the ability of people to create wealth.
Becker called the current century the "age of human capital," citing the tremendous growth in investment in human capital in this century, and the resulting huge increase in wealth. He noted that the widely varying economic growth rates among nations could best be explained by investments in human capital rather than by raw materials or other measures. Immigrants in the United States, he noted, have traditionally sacrificed in order to provide a better education for their children—a vivid example of investment in human capital. Becker noted, however, that the public school "monopoly" is a significant deterrent to further investments in human capital in the United States. He noted the "well documented" quality of private school education, particularly at Catholic schools. In his view, the unavailability of parental choice harms the poor in particular, since they do not have the same ability to move to better neighborhoods or purchase private schooling as do middle- or upper-class parents. He suggested vouchers as a workable solution to this problem, since they would enable parents to choose where to send their children.12 Finally, he noted that the improved competition would not only benefit the children who moved to private schools, but also the children who remained in the public system.
Becker’s remarks support a tuition tax credit plan in the State of Michigan as presented in this study. While this study argues that tuition tax credits are superior to vouchers, their ability to empower parents to improve their children’s education is roughly the same.
Although parental choice emerged as a major public policy issue in the late 1980s, Michigan parents, like those in most other states, have always had some options in schooling their children. Parents have always been free to choose private schools for their children in lieu of sending them to government-funded public schools, although such choices required extra expenditures. Inner-city religious schools have long been a source of pride for cities and the religious denominations they represent because of the high-quality education these schools offer. Likewise, the more "elite" private academies in our state, such as Cranbrook or Detroit Country Day School, offer students a strong academic education and grant a small number of students need-based financial aid.
Recent innovations have expanded parents’ options. Many families seeking alternative forms of education for their children have been aided by private scholarships provided by such entities as the Vandenburg Foundation, now known as CEO Michigan. According to Scott Gordon, Executive Director, during the 1997-98 school year, CEO Michigan awarded 462 scholarships statewide to students in 110 schools and 35 cities.13 These scholarships are available to parents who choose any school. Scholarship amounts are $1,000 per year, and the recipients may receive the grant in successive years of schooling. Although the aid is still less than that needed for tuition at an alternative school, it is enough to enable many parents to place their children in an alternative school of their choice.
Located in Detroit, Cornerstone Schools were organized by a coalition of church groups, with support from businesses and community organizations, to offer educational opportunities to children from low-income families. First proposed by Adam Cardinal Maida in 1990, the schools have a Christian, though not explicitly Catholic, orientation. The curriculum is rigorous and is spread across an 11-month school year. The three schools established by the coalition offer assistance to students with a Partner Program, which matches each student with a partner who provides a $2,000 grant to help defray the cost of tuition. The board of the organization, chaired by Michigan School Board member W. Clark Durant, is supported by monetary grants from 270 individual and corporate partners, including the Big Three auto-makers, Blue Cross and Blue Shield, and Detroit Edison. Partners provide more than monetary assistance, however. They also serve as a positive influence in the students’ lives. Meetings between partners and students are arranged four times each year. During the 1996-97 school year, 409 students were enrolled in the Cornerstone Schools.
The success of Cornerstone Schools in creating a quality educational opportunity in an urban setting has won widespread acclaim. The organization has received awards from the Clinton Administration’s National Education Commission on Time and Learning, along with Republican House Majority Leader Dick Armey’s third annual "Freedom Works" award.14
Unlike the system of elementary and secondary education, our system of higher education in Michigan has long been a system of choice. Graduating high school seniors have always had the opportunity to choose the schools, public or private, to which they apply for admission. It is important to note the many reasons behind students’ choices of college, including financial circumstances, the students’ interests, and the students’ high school achievements. Parents and their graduating seniors survey a full range of options, knowing that because individuals differ, the institutions they attend cannot and should not all be homogenous. No government entity could ever weigh properly all these factors for each individual student and impose its choice. Yet, the government attempts to do exactly that for primary and secondary school students.
The success of the choice model for higher education is partly based on the relative freedom in financing options. The 1970 Amendment to the Michigan Constitution represses virtually all direct or indirect financial support for students attending private schools. No such prohibition exists for higher education, and in fact, a wide range of government financing options are available to students at public and private colleges, even private religious colleges. These include government-subsidized loans and grants, tuition tax credits, and direct government aid to colleges and universities.15 While the direct aid for public colleges generally makes their tuition costs lower than those at private colleges, the existence of tuition tax credits and taxpayer-subsidized loans and grants has helped students exercise choice in higher education. One might question why the 1970 Amendment prohibits an 18-year-old student from getting a tax credit for tuition at a high school but allows it for college tuition.
In 1991 Michigan passed legislation that encouraged public school districts to experiment with intra-district school choice options. Intra-district choice allows students to apply to attend other schools within the same school district. Inter-district school choice, which allows students to apply to attend schools in other school districts, was rather limited in Michigan until 1996. In June of 1996, the governor signed Senate Bill 851, the annual appropriations bill for school aid, which authorized inter-district schools of choice within intermediate school districts. School districts within the intermediate school district can make decisions about the extent to which they will participate in the inter-district choice program. Since the 1996-97 school year is the first year of the program, significant data are not yet available, but the existence of the program gives at least some parents yet another option to pursue as they decide on their children’s schooling.16
Some parents have also been able to send their children to traditional public schools in other intermediate school districts. This, however, requires the permission of the receiving school district superintendent and, if funding is to be released, the permission of the home school district superintendent. If funding is not released, the receiving school district may charge the parents tuition. For example, Rory Pettipas was refused a funding release by the Meridian School District superintendent when his parents chose to enroll him in a gifted and talented program at Handley Elementary School in the Saginaw Public School system. His parents were charged $1,800 tuition. 17
Perhaps the most promising expansion of parental choice in Michigan occurred in late 1993 when the Legislature passed charter school legislation as part of a package of bills reforming educational programs and funding. Enacted in 1994, the current public school academy statute gives state public universities, community colleges, and intermediate and local school districts the authority to contract for the creation of "public school academies" or charter schools, to provide education to Michigan’s students.18 During the 1996-97 school year, 76 schools were operating under school charters. Although several universities, most notably Central Michigan University, have granted charters to establish schools, few school districts have exercised this option.
The growing number of charter schools and the expanded choice options offered to Michigan residents are promising developments, but they were not achieved without struggle, turmoil, and acrimonious debate. Given the long and established history of public education, it is not surprising that the concept of expanded educational choice is threatening to some. Though Americans pride themselves on their innovations, advancements, and entrepreneurial spirit, we are still, as Chubb and Moe point out, a people who cling to our perceived heritage, our institutional underpinnings, and our founding creeds, even when the institutions we have inherited are no longer serving us well.
Some of those individuals and organizations that are opposed to the implementation of choice assert that parental choice will eventually lead to the disintegration of the entire system of public education. They argue that the system has served America well for years, and should not be significantly changed. In this century, it is true that a strong public school system has been one of the bedrocks of American society, serving as a cohesive force in a heterogeneous society and enabling people with varied backgrounds to live together in support of common goals and values. This government school system, which grew up from a network of local community schools, has traditionally been a place that offers not only a basic education in subjects such as reading and math, but also an education in citizenship and the workings of American government. However, that legitimate concern has in some cases given way to an overreaction against parents and others who believe they should pursue better alternatives.
Chester Finn, a senior fellow at the Hudson Institute and noted school reformer, has summarized the overreaction of some protectors of the current system in various states:
A Queens, New York couple was charged with fraud for enrolling their 12-year old in a
different school system.
The public schools in Morrisville, Pennsylvania pay a $500 bounty on nonresident
students who are fingered for attending better schools without permission.
A Cleveland mother was actually jailed for putting her son in a neighboring school
district "because I wanted him to have a better life and a better education."
Illinois now has a criminal statute for "illegal school registration," a
misdemeanor punishable by jail and fines.
Finn concludes:
Fortunately for children, school choice is spreading despite the system’s efforts to stop it. And spread it should. There is no reason to confine children, against their families’ wishes, in a bad school when there’s a good alternative on the next block, in the next town, or even in the next state.19
Other overreactions have appeared as well. Today, it is not unusual to see supporters of school choice, especially voucher supporters, to be labeled as "extremists" and lumped together with Ku Klux Klan members or termed a member of the "radical right." The chief lobbyist for the Michigan Education Association (MEA), the state’s largest public school employee union, has said that anyone who supports educational vouchers is "basically racist in nature."20 The MEA also threatened to blacklist teacher education students at a public university if that university chartered public school academies contrary to the MEA’s demands.21 One innocuous-sounding group, the "Coalition for Democracy," supported heavily by the two main teachers’ unions in New York, even has a list of "extremist" groups, which includes such organizations as the Concerned Women of America, the National Association of Christian Educators, and an all-purpose listing for "Taxpayers’ Association: (list specific name.)"22
Of course, the majority of those who defend or work in the public school system do not fall victim to these extreme overreactions. Most are rightly concerned with the quality of education and want it improved. Even among the more thoughtful opponents of parental choice, however, there are several misconceptions that can be dispelled by a review of the experience with parental choice around the nation.
One of the major fears that critics voice about implementing a widespread parental choice program is the notion that it will hurt minorities and economically disadvantaged students and benefit only those who least need it. The evidence demonstrates overwhelmingly that this is not the case. In his review of the Milwaukee Choice Program, Daniel McGroarty points out that through the first four years of Parental Choice in Milwaukee, an average of 92 percent of all children receiving choice vouchers were African-American or Hispanic.23 Chester Finn reports that in a sample of almost 8,400 charter school students across the states, 63 percent were members of a minority group.24 Many existing private schools located within cities have already opened their doors to minorities and the economically disadvantaged, offering full tuition scholarships to those demonstrating need. In addition, charter schools in Michigan and across the nation have been created expressly to serve populations that have traditionally been locked into an assigned government school. Fears of creating an elitist system are unfounded. Expanded school choice programs increase rather than decrease the range of students taking advantage of alternative schools.
A second charge made by opponents of expanded school choice is that it will somehow de-fund the public school system, resulting in its financial bankruptcy or an inability to pay for essential programs. Of course, it is true that choice will allow dollars to follow students. In nearly all states participating in inter-district choice programs, the funding follows each student from the original school district in which he or she resides to the chosen school and its district. This, necessarily, results in a reduction of the overall grant to the original school district, and an increase in the resources to the school receiving new students. For example, due to the opening of two large charter schools in the mid-Michigan area in the 1996-97 school year, the Lansing School District experienced a "loss" of just under four million dollars in state aid when approximately 700 students left the district.25 Of course, these new charter and other public schools "gained" the same amount of money as was "lost" by this school district. Thus, the government education system as a whole did not lose money, and parents and their children gained an increase in options.
When choice is extended to private schools, even more resources are deployed for education. Dollars follow the students, although in a more indirect manner. Other dollars, from private sources, also flow in. Thus, even when choice options include private schools, the overall resources devoted to education need not decrease.26
The dynamic of school choice improves the whole system because competition favors the consumer in every market. The market for education is no different.
Competition has certainly improved the products and services of other industries. In the 1980s, U.S. automobile manufacturers were faced with increasing competition from Japanese car makers, who produced safer, more efficient, and more reliable products. In response to losing significant market share, U.S. automobile manufacturers simultaneously formed partnerships with foreign manufacturers and launched extensive efforts to improve their products.27 Thus, competition brought about improvement in products offered by all manufacturers—both national and foreign. Today, U.S. manufacturers again lead the world in many markets.
Now consider the Lansing School District discussed above. In response to "losing" 745 students to other districts and charter schools in the 1996-97 year, the Lansing School District is creating more options to offer its residents. The school district has added a sixth grade to one of its existing elementary schools and plans to pilot several more K-6 schools in the coming year. In addition, the school district is considering offering all-day kindergartens in some of its elementary schools. Finally, in the ultimate tribute to the power of consumer choice, the district has launched an advertising campaign to showcase its new and improved offerings.28 In the case of the Lansing School District, the exercise of choice options by about 700 students has generated better programs for the over 17,000 who remain in the traditional schools.29
One of the strengths of parental choice is that—just as a restaurant need not lose all of its customers before the chef gets the message—even a small number of students choosing an alternative school can send a powerful message to traditional public school administrators.
The logic that choice options help even those students who stay in the traditional public school system is now overwhelming. A recent "Editorial Notebook" column in The New York Times, subtitled "How Choice Changes Public Schools," confirms how even mainstream opinion has been moved by the evidence now at hand:
In Milwaukee, the threat of expanded competition has worked precisely as Milton Friedman predicted. A system that once treated parents with contempt has begun to answer their calls and embrace local experiments through a charter school and other partnerships with community groups. A city that once rebuffed requests for public Montessori schools now has them. Said John Gardner of the Milwaukee school board: "A system that has been arrogant and indifferent for 20 years has suddenly got religion." 30
Teachers benefit from educational choice because, with a greater number of independent schools, they have more employment choices. Today, if a teacher feels he or she is underpaid, overburdened by red tape, not respected as a professional, or otherwise treated poorly by administrators, the only real option is to leave town and move to another school district. This is because the same employer, the school district, operates nearly all the schools in the area, which practically equates to a monopoly purchaser. With more private and charter schools, however, there will be increasing pressure on school administrators to treat teachers well or risk losing them to competing schools. Teachers can take advantage of better opportunities to teach without having to move their residence.
Another criticism of expanded choice asserts that government schools will be left with the poorest performing, most difficult to educate students—the intractable, the unfocused, the "impossible" individuals. Evidence gathered from school choice programs has not supported this assertion. In the case of the Milwaukee Choice Program, the "skimming" of only "good" or "desirable" students has not taken place. John Witte, who completed several evaluations of the Milwaukee Choice Program, observed that the program seemed to provide an alternative educational environment for students who were not succeeding in the traditional public school. Although Witte’s review of the choice program in Milwaukee is not completely positive, he nevertheless acknowledges that students who were not "making the grade" could always find a place where they were welcome and free to succeed.31 Most schools participating in choice programs, whether they are private, public, or charter schools, seem eager to convey the message long ago inscribed on the Statue of Liberty: "Give me your tired, your poor, / Your huddled masses yearning to breath free . . ."32
Indeed, even The New York Times now recognizes that choice programs offered to economically poor students help them achieve more and pressure the public school system to improve:
Desperate to find a remedy for failing schools, several states are considering voucher experiments that would offer low-income students private-school scholarships at public expense. . . . A study of the longest-running experiment in Milwaukee suggests that vouchers can improve the prospects of the poorest and least prepared students. . . . More work needs to be done to see if the gains are sustained. But the Milwaukee data should serve notice on the teachers’ union—and large, urban districts everywhere—that if the schools do not improve quickly, vouchers could become irresistible.33
If the defenders of the current system are correct in their criticism that choice will hurt the urban poor, we should see urban leaders resisting choice strongly. In fact, just the opposite is the case. In Detroit, Milwaukee, Cleveland, and other cities across the country, urban leaders and parents are at the forefront of demands for choice.
In an essay supporting a modified voucher plan for Cleveland’s public schools, Hugh Calkins, a member of the Cleveland School Board from 1965 to 1969, examines the claim that choice will "skim the cream." Calkins addresses the concern that students who do not take advantage of choice options and remain in their home school may sustain losses that equal and perhaps exceed the gains that those who leave the system may achieve.
I respond that it is intolerable to deny better education to inner city children with the gumption to seek it, in order to help others who are less determined to escape the ghetto. Moreover, the gains and losses are closely related to the degree of involvement that parents have in their children’s education, and providing real choices is the best tool we have to increase the number of involved parents and the intensity of their involvement.34
Mr. Calkins’s comments underscore the danger of focusing primarily on individuals who choose not to make a choice about their schools. It may well be true that those students will, for a time, exist in a school that does not meet their educational needs. But many students in public schools find themselves in this situation right now. The very existence of expanded choice options will bring about changes in the educational environments in the students’ home districts. In Michigan, as charter schools have attracted increasing numbers of students, the traditional public schools have doubled their efforts to "win back" departing students. 35
Mr. Calkins’s words also serve as a reminder that parents should be the primary caretakers of their children’s education, rather than allowing the state to assume that role. Parents deserve the freedom to seek a better education for their children if they think the current system is failing to provide one. Any objection to allowing parents the right to send their children to a better school, because doing so somehow undermines a "system," is significantly flawed. Parents would not accept such an argument with a child seeking medical care: ("But Johnny can’t go to a better doctor; what would happen to the staffing levels at our government-assigned clinic?") People would not accept it for choosing where to live: ("No, I’m sorry, Mrs. Smith, you and your husband cannot move out of town; we need your residency in order to keep up our revenue sharing.") Similarly, it cannot be accepted with respect to education.
In Detroit, local ministers have come together to demand choices in education that extend outside the government school system. A large group of urban leaders, including the former superintendent of the Detroit School District, Deborah McGriff, have traveled to Cleveland and Milwaukee to personally review their choice programs. In both cities, pilot programs offer vouchers to parents of school-age children, which can be used at private schools. The ministers emerged impressed and vowed to support choice programs for their citizens in Detroit. Reverend Edgar L. Vann, President of the Council of Baptist Pastors of Detroit and Vicinity, stated that there is no reason why every school—public and private—"should not be a part of the mix of positive choices available to parents." The Reverend Ned Adams, Jr., pastor of True Faith Baptist Church and a member of the Baptist Council’s education committee, believes that without a choice among private schools, there is no incentive to drive school reform.36 Rabbi E.B. "Bunny" Freedman, former executive director of Yeshiva Beth Yehudah in Southfield, noted that "Parents who send their children to private schools are not getting a fair shake, because they are effectively paying twice for the education of their children." He favors vouchers or tuition tax credits for parents.37
Public opinion supports the ministers’ efforts. A February 1997 poll by the Lansing firm of EPIC/MRA for TEACH Michigan, an organization which supports school choice, found that Michigan residents support state-funded scholarships for poor children to attend any school of their choice.38 The survey of 600 Michigan voters found that 54 percent favored such a plan.39 In Detroit, full choice was favored by an even greater 60 percent.
Economics as a social science explains the behavior of consumers and producers. Both seek to satisfy their own preferences. Producers try to maximize profits. Consumers maximize their own utility, which normally includes cash income, creature comforts, and leisure time. The field of "public choice," a branch of economics, extends these basic findings to the world of politicians, voters, and interest groups.40 A brief public choice analysis explains many of the problems of the current system and points to parental choice as the solution.
Public choice analysis assumes that politicians, although they have a variety of desires, try to maximize their ability to get re-elected. They therefore pay more attention to organized interest groups, the media, and segments of the population which actively participate in politics than to the public at large. This is not to say that politicians are immoral or operate against the wills of the voters. Rather, just as retailers court those customers who have the most to spend in their stores, politicians listen to those who have the most impact on their re-election. In politics, it is the squeaky wheel and, more particularly, the well-funded, influential wheel, that gets the grease.
When this insight is applied to the current public school system, it is easy to see why "the system" as a whole has developed a resistance to competition. There is no organized lobby for parents concerned about their children’s performance.41 There are, on the other hand, a number of very organized, politically active interest groups that support the current system.42 While these organizations—public school employee unions, school board and administrator associations, intermediate school districts, urban and rural school districts—do not agree on all points, they all tend to oppose parental choice and support more money for the current system. Although it is clear that the vast majority of the individual members of these organizations also support better education for children, the vocal lobbying groups representing these individuals are concerned primarily with protecting institutional interests. Even though it is not in the best interests of parents and students, the typical politician responds to the powerful calls for more money for a system that is protected from outside competition.43
Dr. William Allen, Dean of Michigan State University’s James Madison College, analyzed Michigan’s current education system and highlighted the structural deficiencies that prevent citizens from demanding and receiving quality, cost-effective educational services. He notes that "due to the lack of market-like mechanisms," consumers must use the political process. For ordinary citizens in the political process, the costs are high and their ability to influence is limited, when compared to the highly-organized employees of the current system. 44
Thus, it is not surprising that, as the general populace has increasingly noticed the decline in overall performance, the defenders of the system do not wish to embrace the very change that would best address the problem. That change—market competition for students—provides every student a better chance to succeed, but also reduces the power, prestige, and money that accrue to the traditional public school system.
Before concluding that parental choice in education is the best improvement to the system, we should at least consider one alternative: that simply devoting more resources to traditional public schools will dramatically improve their performance. That question has been conclusively answered. Indeed, now even mainstream economists accept that simply spending more money on traditional government schools will not significantly improve education. Edward Gramlich, the Dean of the Public Policy School at the University of Michigan, and a former Acting Director of the Congressional Budget Office, has long been concerned about lagging national investment in human and physical capital. He notes in his 1992 Brookings Distinguished Lecture on National Priorities:
Two types of public consumption seem especially in need of attention—education and health care. In both cases, aggregate measures of performance are lagging badly. In both cases, this lag is in the face of big increases devoted to the problem.
Take first education. There John Chubb and Eric Hanushek make a powerful argument that further resources devoted to the problem without structural reform will simply make the nation’s schools more expensive, not better. Their macro argument is that over the last 30 years real expenditures per pupil have tripled but most measures of test performance have dropped sharply. Their micro argument is that most careful research studies have simply not found any relationship between resource inputs and output measures such as achievement test scores. Presumably the missing ingredient here is some form of performance incentive, but even this is not very clear.45
Gramlich confirms what free-market advocates have been saying for some time: simply putting money into the current system has not worked in the past and will not in the future.46 More recent work, including a comprehensive analysis of Michigan schools by Dr. Allen, again finds a weak relationship between increased expenditures and improved school performance.47
Gramlich, writing in 1992, was not yet convinced performance incentives were the answer. Today, the case for performance incentives is clear and compelling. Indeed, more aggressive reformers go well beyond the parental choice plan proposed herein. They argue that the government school system has completely outlived its usefulness and should be totally replaced. Lewis J. Perelman, in School’s Out, argues that choice is essential, but does not go far enough:
However, the need not merely for "choice" but for commercialization of education has been overlooked by most would-be reformers. We need commercial choice and competition in schools first to goad technological innovation—the profit motive is essential to reward the creation and provision of productive technologies.48
While Perelman argues for outright commercialization, Dr. Allen argues for a new framework of public ownership of schools, in which competition on price and quality would drive the system:
We advocate provisions by which all K through 12 education will be non-governmentally operated. We propose to eliminate all jurisdictional barriers to school selection. No single structure of educational governance would be imposed by the State, even as the State preserves its commitment to equitable funding for Michigan students. Schools will be owned by individual shareholders, who will operate each school acting through their respective boards of directors.49
Thus, we need to change the incentives if we hope to change the outcome.
We need to return power, authority, and responsibility to parents, rather than leaving it vested in politicians and administrators. Parents have the responsibility for the welfare of their children. As choice options have become more widespread, it is apparent that parents are eager to accept the responsibility for their children’s schooling. The problems of our existing public education system—the increase of violence in the schools, the breakdown of communication between students’ homes and the school, the inconsistent level of graduating students’ basic skills—all point to an enervated, overburdened system that needs more than increased funding, administrative tinkering, or pedagogical experimentation. It needs wholesale change in which students and their parents can become an integral part of a new system—a dynamo of improvement.
The Michigan Constitution of 1963, Article VIII, Section 1, states the following: "Religion, morality and knowledge being necessary to good government and the happiness of mankind, schools and the means of education shall forever be encouraged."50 In adopting this language–which sprang from the 1787 Northwest Ordinance–the people asserted that education is vital to our society and that knowledge, morality, and religion are necessary elements of that education.
The very same Constitution, however, and also the U. S. Constitution, place limits on the extent to which the government can support religious activities and organizations. This situation has created a tension between various visions of church and state separation and has shaped the current Michigan Constitutional provision regarding educational options for parents and students, especially with respect to nonpublic schools.
The delicate balance between church and state has been debated and litigated across the country for four decades.51 While it is settled law that the government may not directly support religious instruction, it is also well established that the state can adopt policies which indirectly aid religious institutions, particularly through some form of tax preference.52 The debate over taxpayer financing and private schools in Michigan reached a high point in 1970 and is again headed into the mainstream of Michigan politics. A brief history is instructive.
Since at least 1939, the state had provided indirect support for private schools, for auxiliary functions such as transportation, testing, health, and special services for handicapped children.53 Even prior to that, at least beginning in 1921, some "shared time" classes were held involving both private and public school students, which continued until at least 1970.54 Starting in 1929, however, the state maintained a statutory prohibition on direct support for sectarian schools. 55
Thirty years ago in Michigan, many parents who supported the expenses of their children at private schools and who also supported government schools, urged taxpayer-funded support for private schools. The increasing costs of operating the public school system and paying for private schools created significant support for partial taxpayer funding of private education. The legislature then passed Public Act 100 of 1970, the school aid bill for the year, which provided direct support to eligible private schools, which could be used only for instruction in nonreligious subjects.56 Michigan's law was similar in concept to those passed in a handful of other states, including Pennsylvania and Rhode Island.57
The Michigan Supreme Court quickly upheld the law, ruling in an advisory opinion that "the Constitution of the State of Michigan did not prohibit the purchase with public funds of secular educational services from a nonpublic school."58
The passage of the law then provided impetus for a campaign to amend the 1963 Constitution to prohibit state funds from being used to support education at private schools. A petition drive was mounted by the "Council Against Parochiaid" to place an amendment on the ballot. The petitions were thrown out after a finding by the attorney general, and later the board of canvassers, that the petitions did not let the signers know whether the amendment would abrogate the education section of the Constitution. A split panel of the Court of Appeals, and then a 5-2 majority in the Michigan Supreme Court, ordered the issue onto the ballot. 59
However, a concern for maintaining institutional separation between church and state and avoiding "excessive entanglement" by preventing tax dollars from flowing to religious schools was probably not the only force which drove the ballot initiative. There was a heightened awareness of religious differences at that time in the state of Michigan, and with it came the concomitant concern that state dollars might be used to promote not just private education in general, but a specific religion. Thus the specter of "parochiaid" was born.
The campaign itself was confused and bitter, with the effect of the proposal unclear to the voters as well as to public officials.60 However, the amendment (Proposal C on the November 1970 ballot), was approved by a margin of 338,098 votes: 1,416,838 to 1,078,740. The new language added to Article VIII, Section 2 provided the following:
No public monies or property shall be appropriated or paid or any public credit utilized, by the legislature or any other political subdivision or agency of the state directly or indirectly to aid or maintain any private, denominational or other nonpublic, pre-elementary, elementary, or secondary school. No payment, credit, tax benefit, exemption or deductions, tuition voucher, subsidy, grant or loan of public monies or property shall be provided, directly or indirectly, to support the attendance of any student or the employment of any person at any such nonpublic school or at any location or institution where instruction is offered in whole or in part to such nonpublic school students. 61
The amendment was so restrictive that the Michigan Supreme Court had to determine not only whether it prohibited direct aid, but also whether or not it prohibited the wide variety of indirect services that were shared, supported, or financed by private agencies and the state and federal government. In the Traverse City School District case, the court interpreted the amendment to outlaw direct aid, but to continue to allow indirect and auxiliary services to be performed with taxpayer funding. However, the Court also ruled that a portion of the amendment which prohibits the use of public money to support the attendance of any student or the employment of any person at any such nonpublic school or at any location or institution where instruction is offered "in whole or in part" to nonpublic students was unconstitutional, void, and unenforceable because it contravened free exercise of religion.62 The free exercise of religion is an important guarantee provided by the United States Constitution, and the Court ruled that Michigan voters could not overrule the U. S. Constitution.
With the 1970 amendment, Michigan’s Constitution became one of the most repressive in the country with respect to parental choice involving nonpublic schools. In an attempt to limit state support to religious schools, advocates of the amendment foreclosed the opportunity for nonpublic school educational choice programs that were religion-neutral and consistent with state and federal constitutional requirements. Michigan residents have lived with the result for over a quarter of a century.
The passing of more than two decades has brought about change in Michigan. Nonpublic
schools are attracting more students, support for parental choice in education is growing
rapidly, and it is not clear that 1970s Proposal C would pass in our present day. It is
time to reevaluate the language that is openly hostile and punitive to parents who would
like to send their children to a nonpublic school without having to pay twice.
As demonstrated in the preceding sections, the Michigan Constitution clearly establishes the principle that education must be a top priority of Michigan citizens. Only with a well-educated populace can we achieve the peace, prosperity, and freedom that a constitutional democracy promises.
Since parental choice in education is such an effective method of improving the availability, quality, and efficiency of educational programs, it is vital that Michigan citizens work to provide more educational options for more students. There are essentially four ways to accomplish this: 1) allow parents and students to choose freely between existing public schools, even schools outside the home school district or the home intermediate school district; 2) remove the existing cap on the number of charter schools that may be created and reduce regulations that hinder such schools from starting; 3) implement a tuition voucher program; and 4) implement a tuition tax credit program.
After analyzing the various means of expanding parental choice in education, this section proposes a Michigan Constitutional amendment for a Universal Tuition Tax Credit. This tax credit is "universal" because, unlike traditional tuition tax credits, it applies to
Any Michigan student
Any Michigan elementary or secondary school, public or private
Any taxpayer—individual or corporate; and
Any of three major state taxes: the Individual Income tax, the Single Business Tax, and the State Education Tax (the statewide 6-mill property tax).
As mentioned previously, Michigan law currently permits very limited choice between traditional public schools. Under legislation adopted in 1996, parents may send their children to any school within an intermediate school district, provided that the school district which contains the desired school has elected to accept such students. State funding will follow the child to the school of choice, thereby creating incentive for schools to satisfy parents and students.
However, parents who choose to send their children to a public school outside their intermediate school district may be required to pay tuition to the receiving school if the home school superintendent refuses to release to the school the state funding that would normally follow the student. This creates a financial disincentive for choice that not all parents are able to overcome.
This problem may be solved in one of two ways. A simple solution would be to allow the state foundation grant to follow the student to whichever public school he or she attends, without requiring permission of the home school district superintendent. A second solution would be to provide a tuition voucher or a tax credit to parents who find themselves having to pay tuition to an alternative public school.
Choice among alternative government schools could also be enhanced by lifting the cap on the number of charter schools and by reducing the regulations that make it difficult to start and operate a new school.
Although increasing choice between traditional public schools and increasing the number of charter schools will increase parental choice, both approaches fail to take advantage of the existing nonpublic school infrastructure. Currently 12 percent of Michigan elementary and secondary students are enrolled in Michigan nonpublic schools, institutions that are noted for their efficiency and results, and, in urban areas, are often oases of educational excellence in an environment of under-performing public schools. As with public schools, the quality of private schools varies widely, and of course not all private schools are superior to all public schools. But where the best educational opportunity is a private school, parents should be empowered to choose it for their children.
To engage these schools more fully in the quest for educational excellence, the most effective choice programs must reduce the bias against private schools that is currently enshrined in the Michigan Constitution and state law. The barriers that exist to private school choice have been described in detail in preceding sections.
Where parents choose an alternative school and are required to pay tuition—whether it be to a public school or a private school—the two methods of expanding choice most frequently advocated are the tuition voucher and the tuition tax credit, each of which has its own strengths and weaknesses.
Vouchers
The main strength of a voucher program is that it simply and straightforwardly empowers students who wish to attend an alternative school to do so. Under a voucher program, the state would provide a tuition voucher for a specified amount to any Michigan student who chooses to attend an alternative school. The alternative school at which the student enrolled would submit the voucher to the state for payment. In this way, depending on the amount of the voucher, the student’s parents’ tuition bill would be either reduced or paid in full. Such a system would reduce the injustice of parents of alternative school students paying twice for education, and provide financial means for more parents to choose alternative education that better meets the needs of their children.
However, tuition vouchers present several concerns. First, opponents argue that vouchers transfer public funds to private schools and thereby drain funds from public schools. Related to this is the argument that vouchers transfer public funds, albeit indirectly, to religious schools, raising a question of separation of church and state which concerns many people. These arguments touch upon a critical distinction between credits and vouchers. Under a voucher system, the State of Michigan would end up making payments to particular schools, including religious schools. Under the UTTC system, the State would not make any such payments whatsoever. Individual citizens and businesses would support the schools and students of their choice, and simply pay less taxes to the state as a result. There is no direct transfer of public funds involved.
Voucher opponents also argue that vouchers are more likely than tax credits to create a justification for government regulation of schools. Many people feel that if the state is transferring public funds to a person or organization, the state should have control over how that money is used. This leads to increased regulation of the receiving party. Tax credits and deductions, on the other hand, generate less incentive to regulate the receiving institution. Federal housing subsidies, for example, carry with them many more regulations than the home mortgage deduction. This is because the taxpayer is the one choosing to make a payment of his or her own funds, with only incidental tax consequences. This is not to say that there is no incentive to regulate tax credit or tax deduction programs, but rather that there is less incentive than when direct subsidies are involved. The last thing Michigan educators and students need is for nonpublic schools to be hamstrung with the same burdensome regulations that public school administrators and teachers complain about regarding their schools.
Voucher opponents also claim that vouchers will spawn a new type of middle-class entitlement program, with its concomitant trade associations and lobbying organizations seeking increased government funding. Vouchers present the classic public choice problem of concentrated benefits and distributed costs, providing great incentive for people to spend and little incentive to economize. A tax credit, on the other hand, requires that a taxpayer actually spend his or her own money first, and later pay reduced taxes as a result. There is still political incentive to increase credit amounts, but it is less than when a program involves "free money" sent by the government, such as is the case with many welfare programs.
Some have argued that permitting vouchers for only nonreligious schools would obviate the church and state objections, but that alternative is met with its own shortcomings. First, it would directly contradict the sentiments of Art. VIII, Sec. 1, which state that "Religion, morality, and knowledge being necessary to good government and the happiness of mankind, schools and the means of education shall forever be encouraged."
Furthermore, such a provision may be unconstitutional on U. S. Constitution First Amendment Free Exercise grounds. The Council Against Parochiaid was careful in constructing Section 2 as a religion-neutral provision, and even so, part of it was held to violate the Free Exercise clause.63 In addition to constitutional concerns, such a provision would probably alienate many in the religious community, and it would enshrine in the Constitution disparate treatment of nonpublic sectarian and nonpublic nonsectarian schools. This is poor precedent, even if constitutional.
Traditional Tax Credits
The traditional tuition tax credit—whereby only a parent can claim a credit against his or her personal income tax for school tuition—requires no expenditure of public funds and therefore avoids or minimizes many of the problems with vouchers. Since the parent is paying the tuition directly, there is no transfer of public funds to religious schools, less incentive to create a new entitlement program, and less justification to regulate the nonpublic schools beyond current law.
The main weakness of the traditional tuition tax credit is that it fails to provide effective choice for low-income, and even many middle-income, families. These families simply do not have enough income tax liability to take advantage of a tuition credit.
The Mackinac Center for Public Policy has monitored the national educational choice movement for a decade and has developed an approach informed by the successes and failures of choice programs in other states as well as an understanding of Michigan politics and the economics of public choice.
To overcome the weaknesses of both vouchers and traditional tax credits, the Mackinac Center for Public Policy has developed an amendment to the Michigan Constitution which would establish the Universal Tuition Tax Credit (UTTC). When adopted, the UTTC will greatly expand quality educational opportunities for all Michigan students while reducing government expenditures for education. As discussed below, the UTTC is superior to vouchers, traditional tax credits, and other methods of expanding parental choice in education.
The Universal Tuition Tax Credit is based on the simple principle that Michigan citizens and businesses should make education a priority, and that those citizens and businesses that are already making education a priority should not be penalized or taxed unfairly. This occurs today when parents and others are forced to pay twice when they support nonpublic schools and when they pay additional tuition to send their child to a public school outside their home school district without a release of funds. The UTTC establishes basic fairness by allowing parents and others who choose an alternative school—public or private—to do so without being penalized. The UTTC will expand the effective options for parents and students so they may choose an educational opportunity that best meets their needs. As described here, the UTTC will benefit both public and nonpublic schools.
Unlike a traditional tuition tax credit that may be used only by parents to offset only their personal income tax, the UTTC is "universal" in character. It may be used by any Michigan elementary or secondary school student. It may be used for tuition paid to a public or private school. It is applicable against three separate state taxes and may be applied universally by any state taxpayer—individual or corporation—that pays tuition for a Michigan student to attend an alternative Michigan elementary or secondary school. The credit may be applied to the state individual income tax,64 the Single Business Tax,65 or the State Education Tax.66 It is important to recognize that the UTTC is a tax credit, not a tax deduction. This means that it can be subtracted directly from the taxpayer’s tax liability, not simply used to reduce the basis of the tax. Therefore, if a taxpayer has a pre-credit tax liability of $3,000 and a tuition tax credit of $2,000, the taxpayer would pay tax of only $1,000.
The UTTC plan can be accomplished using the existing tax system and, with slight modifications, the existing mechanisms for tax payment, refunds for overpayment, enforcement mechanisms, and credits. Significantly, the Michigan Individual Income tax already allows tuition tax credits for tuition paid to certain colleges and universities. The UTTC modifies and extends this tax credit to elementary and secondary schools. The income tax already allows credits for property taxes (the "Homestead" or "circuit breaker") and home heating costs. The property tax credit alone accounted for $435 million in tax credits in 1993. Other credits are allowed for artwork, certain community foundations and homeless shelter donations, contributions to colleges and universities, and medical savings accounts.67 Similarly, the Single Business Tax provides for a variety of deductions and credits.
The UTTC is very simple and straightforward. When a taxpayer pays tuition for a Michigan child to attend an alternative school, that taxpayer may claim a portion of the tuition paid as a credit against the tax liabilities mentioned above. The credit is non-refundable; that is, only taxpayers who owe taxes can claim the credit. Taxpayers who do not owe taxes cannot receive a "refund" from the state. The amount of the credit is limited under the plan in two ways.
First, the maximum allowable credit per child is phased in over a period of nine years, starting at 10 percent of the average amount received by state and local government per child in the Michigan public school system and eventually equaling 50 percent of the average per-child revenue. Thus, the tax credit will never be more than half of the amount received per child in the public school system.
To demonstrate with a simplified example, Table 1 shows the amount of the credit over a period of 9 years based on a constant annual per-child public school spending of $6,000 (this amount would actually increase each year). The purpose of the phase-in period, as described later in this report, is to minimize impact on the state budget.
| Table 1. Example of Nine-Year Phase In of Universal Tuition Tax Credit | |||
| Year | Average Per-Pupil Public School Revenue | Maximum Credit as a Percentage of Per-Pupil Revenue | Maximum Credit |
| 1 | $6,000 | 10% | $600 |
| 2 | $6,000 | 15% | $900 |
| 3 | $6,000 | 20% | $1,200 |
| 4 | $6,000 | 25% | $1,500 |
| 5 | $6,000 | 30% | $1,800 |
| 6 | $6,000 | 35% | $2,100 |
| 7 | $6,000 | 40% | $2,400 |
| 8 | $6,000 | 45% | $2,700 |
| 9 | $6,000 | 50% | $3,000 |
| 10 | $6,000 | 50% | $3,000 |
Secondly, the credit is limited to 80 percent of the tuition paid, unless the student is from a family whose income falls below the federal poverty level, in which case the credit is 100 percent of the tuition paid, up to the maximum allowable credit. Requiring a non-creditable payment of 20 percent of the tuition for non-poverty-level families provides downward pressure on the cost of tuition, helping keep education efficient and affordable. The credit for students whose family income is below the federal poverty level is limited only to the maximum credit amount, making it easier for taxpayers to assist such students.
The state Legislature and the Michigan Department of Treasury would develop the administrative procedures for implementing the UTTC. Such procedures should include the following provisions, described in detail in the section "Legislative Implementation of the UTTC" below:
Allow individuals and corporations the option to make one annual payment to a nonprofit
scholarship organization or charitable foundation which acts as a conduit to make direct
tuition payments and handle recordkeeping. This will remove from businesses and
individuals the administrative burden of supporting multiple students at multiple schools.
Modify the state Individual Income tax form to provide a convenient way for individuals
to claim credit against their Individual Income taxes and state education property taxes.
Modify the Single Business Tax form to provide a convenient way for businesses to claim
credit against their Single Business Tax.
Create a method whereby businesses and individuals can claim credit against the state
education property tax.
Provide for a standard receipt to be issued by alternative schools that will track tuition payments to each identified student and the maximum credit allowed for that student. This will assure that credits are accurately tracked and guarantee that the tuition payer can claim the proper credit.
The UTTC has several distinct benefits:
The UTTC will vastly expand parental choice in education in Michigan, bringing with it
the dynamics of consumer choice and a competitive educational marketplace. It will result
in marked increases in educational quality, educational opportunity, and parental
involvement.
The UTTC overcomes the shortcomings of traditional tuition tax credits by allowing both
parents and non-parents to obtain tax relief when they support a student at an alternative
school. By allowing the credit to be applied to three state taxes by any taxpayer, the
additional money that could be dedicated to alternative school education would be
significant. For Fiscal Year 1996-97, for example, the amount would be over $7.5 billion.68
Friends and relatives of a student could pay all or part of the student’s tuition at
an alternative school and receive credit against their Individual Income tax, state
education property tax, or Single Business Tax. A corporation could also pay tuition and
receive a tax credit against its Single Business Tax or state education property tax. The
only cost to such taxpayers of assisting parents and students will be the minimal time
required to complete the paperwork associated with claiming the credit.
The UTTC will have no effect on the revenues of municipal governments such as cities, counties, townships, and villages. Because revenues from the Individual Income tax, state education property tax, and Single Business Tax all accrue to the state of Michigan, the credits will not reduce local revenue.
The following are several examples of how the UTTC would work. These examples are based on an average per-pupil public school revenue of $6,000, yielding a maximum credit amount of $3,000. These examples also assume that the maximum credit is fully implemented, which would only occur nine years after the UTTC was adopted. Until that time the actual maximum tax credit would be much smaller.
Mary Smith, a single mother of two with family income below the federal poverty level,
lives in inner-city Detroit. She wants to take her children out of the public schools
because of the lack of achievement her children are experiencing. She would like to send
them to a local Catholic school known for emphasizing discipline and academic achievement.
Luckily, ACME Motor Company, a large automobile manufacturer, has established a
scholarship program for such families. ACME Motor’s "Educational Hope
Program" pays the entire tuition for both children ($2,000 per child) and the company
takes a $4,000 credit against its Single Business Tax liability. ACME Motors advertises
this program, which earns it much national and community goodwill. The program has cost
ACME Motors nothing but the promotional expenses it chooses to incur.
James and Patty Williams like the "Gifted and Talented" program offered by Our
Town Elementary, a public school located in a school district other than the one in which
they live. They feel their son, a very bright and energetic learner, is not sufficiently
challenged by the local school program. However, they are required to pay an additional
$2,000 to send their child to the public school outside their district because the local
school superintendent will not release the funds. James and Patty—whose family income
is above the poverty level and whose Michigan Individual Income tax liability is
$3,000—can take a $1,600 credit (80 percent of $2,000) against their tax bill, paying
only $1,400 in income tax. (Based on an actual Michigan case.)
Robert Doe, a wealthy real estate developer living in Oakland County, pays $15,000 each
year to send his only child to the Cranbrook Academy, a private school. He takes a tax
credit of $3,000 against his state Individual Income tax liability ($15,000 x 80 percent =
$12,000, which exceeds the $3,000 cap). This is the maximum credit amount any
taxpayer—or combination of taxpayers—may claim per student. Therefore, it costs
Mr. Doe $12,000 per year instead of $15,000 to send his child to the alternative school.
Robert Middleclass, a middle-income auto worker living in Kent County, pays $4,000 each
year to send his only child to the Gifted Science Academy, a private school. He takes a
tax credit of $3,000 against his state Individual Income tax liability ($4,000 x 80
percent = $3,200, which exceeds the $3,000 cap). Therefore, it costs Mr. Middleclass
$1,000 per year instead of $4,000 to send his child to the alternative school.
As mentioned previously, any expansion of educational choice that includes non-public schools will require a change in the Michigan Constitution. This section presents detailed language for an amendment that would establish the Universal Tuition Tax Credit, and discusses the policy considerations surrounding the specific language.
One question that should be addressed first is how much of the UTTC plan should be established in the Constitution as opposed to statutory law. It would be possible to amend the Michigan Constitution to simply permit tax credits, and then leave it up to the Legislature to implement such a system. There are, however, several problems with such an approach. First, opponents of parental choice in education, the most vociferous of which are the public school employee labor unions, have attacked such proposals by obfuscation. The more that is left to doubt regarding the specific details of a choice plan, the more opportunity its opponents have to paint a picture of bizarre and harmful situations that may occur under whatever plan does arise. Secondly, Michigan parents have little ability to influence the Legislature in matters of education reform when compared to the considerable power of the public education establishment (which includes administrators and teacher unions), which views parental choice as a threat to its operations.
There are two primary considerations that govern the drafting of this proposal. First, the language must be as simple, clear, and concise as possible while still accomplishing the desired objective. The proposed language below consists of removing just 11 words from the existing Article VIII, Section 2, and adding four paragraphs. Second, the amendments should, as much as possible, leave existing statutory and case law undisturbed while still accomplishing the objectives. The debate over parental choice should focus on the merits of the Universal Tuition Tax Credit, not on issues resulting from changes that are unnecessary to implementing the UTTC.
(Note: Existing language is shown in normal type. Language to be eliminated is
shown striked out. Language to be added is shown in UPPER CASE.)
The policy objective with respect to amending the existing language of Article VII, Section 2, is to eliminate the prohibition on tax credits for nonpublic schools while maintaining the prohibition on vouchers.
Suggested revisions to the existing Article VIII, Section 2:
Section 2. The legislature shall maintain and support a system of free public elementary and secondary schools as defined by law. Every school district shall provide for the education of its pupils without discrimination as to religion, creed, race, color or national origin.
No public monies or property shall be appropriated or paid
or any public credit utilized,by the legislature or any other political subdivision or agency of the state directly or indirectly to aid or maintain any private, denominational or other nonpublic, pre-elementary, elementary, or secondary school. No payment,credit, tax benefit, exemption or deductions,tuition voucher, subsidy, grant or loan of public monies or property shall be provided, directly or indirectly, to support the attendance of any student or the employment of any person at any such nonpublic school or at any location or institution where instruction is offered in whole or in part to such nonpublic school students. The legislature may provide for the transportation of students to and from any school.
These modifications eliminate all barriers to tax credits and maintains the prohibition on vouchers. A prohibition on vouchers is important due to the fact that survey results show that public support for tax credits is much stronger than support for vouchers. As discussed previously, although vouchers would accomplish the objectives of parental choice and would improve the existing assignment system, they are less preferable to tax credits.
The policy objective of the UTTC is to establish a per-child tax credit against the state Individual Income tax, Single Business Tax, and State Education Tax for ANY taxpayer who pays tuition for a Michigan student to attend ANY Michigan public or non-public elementary or secondary school. The amendment is completely nondiscriminatory; it applies equally to nonreligious and religious schools, to private schools and to public schools.
To maintain incentive for tuition payers to be prudent purchasers of nonpublic educational services, the credit should equal only 80 percent of the tuition paid. The only exception to this restriction is that persons paying tuition for children from families whose income is below the federal poverty level should receive a tax credit equal to 100 percent of the tuition paid. However, in either case, the credit may not exceed a certain maximum amount. This maximum amount shall be 10 percent of the average state and local per pupil revenue for school district operating purposes for the first year following ratification and shall increase evenly over a nine-year period to 50 percent of the average state and local per pupil revenue for school district operating purposes.
Suggested language defining the UTTC:
SUBJECT TO THE LIMITATION OF THIS SECTION, THERE SHALL BE A CREDIT AGAINST AMOUNTS PAYABLE UNDER THE STATE INCOME TAX, THE STATE SINGLE BUSINESS TAX, THE STATE EDUCATION TAX, OR ANY SUCCESSOR TAXES, AND OTHER TAXES AS PROVIDED BY LAW TO ANY PERSON FOR PAYMENTS MADE BY THE PERSON FOR TUITION FOR EDUCATION FOR ANY RESIDENT CHILD ATTENDING A PUBLIC OR NONPUBLIC ELEMENTARY OR SECONDARY SCHOOL IN THIS STATE.
THE TAX CREDIT PER PUPIL SHALL BE LIMITED TO THE LESSER OF THE MAXIMUM CREDIT ESTABLISHED IN THIS SECTION OR 80 PERCENT OF THE ACTUAL TUITION PAID PER PUPIL FOR EDUCATION AT A PUBLIC OR NONPUBLIC SCHOOL. THE TAX CREDIT PER PUPIL FOR TUITION PAYMENTS FOR A PUPIL WHOSE FAMILY INCOME IS BELOW THE FEDERAL POVERTY LEVEL SHALL BE THE LESSER OF THE MAXIMUM CREDIT ESTABLISHED IN THIS SECTION OR 100 PERCENT OF THE ACTUAL TUITION PAID.
THE MAXIMUM CREDIT PER PUPIL PERMITTED IN THE STATE FISCAL YEAR FOLLOWING THE RATIFICATION OF THIS AMENDMENT SHALL BE AN AMOUNT EQUAL TO TEN PERCENT OF THE AVERAGE STATE AND LOCAL PER PUPIL REVENUE FOR SCHOOL OPERATING PURPOSES FOR PUBLIC ELEMENTARY AND SECONDARY SCHOOLS. FOR EACH FISCAL YEAR THEREAFTER THE MAXIMUM CREDIT SHALL INCREASE OVER THE PRIOR YEAR BY AN AMOUNT EQUAL TO AN ADDITIONAL FIVE PERCENT OF THE AVERAGE STATE AND LOCAL PER PUPIL REVENUES, UNTIL THE MAXIMUM CREDIT AMOUNT PER PUPIL IS EQUAL TO FIFTY PERCENT OF THE AVERAGE STATE AND LOCAL PER PUPIL REVENUE.
THE LEGISLATURE SHALL PROVIDE BY LAW FOR THE IMPLEMENTATION OF THIS SECTION.
The primary purpose of the credit is to end the penalty on parents and others who both pay taxes to support public schools and pay tuition at alternative schools. The purpose of extending a 100 percent credit to children of families below the poverty level is to provide educational opportunity to students whose parents may not be able to pay even the 20 percent of the tuition charged.
The phase-in of the maximum credit amount will create a positive fiscal impact on state finances by allowing time for students in traditional public schools to switch to lower-cost alternative schools, thereby reducing the amount of state funds needed for traditional public schools.
The policy objective of this provision is to prevent nonpublic schools from being subject to regulations that hinder learning, discourage and frustrate professional educators, increase operating costs, and have no bearing on the health, safety, or education of students.
Suggested language to protect against overregulation:
LIMITATION ON STATE REGULATION OF NONPUBLIC SCHOOLS.
THE LEGISLATURE SHALL NOT ADOPT ANY LAW IMPOSING REGULATIONS ON NONPUBLIC SCHOOLS OR THEIR PUPILS OR TEACHERS IN ADDITION TO THOSE IN EFFECT ON THE DATE THIS SECTION IS RATIFIED EXCEPT BY A VOTE OF TWO-THIRDS OF THE MEMBERS ELECTED TO AND SERVING IN EACH HOUSE.
Public school teachers and administrators agree that current Michigan regulations impose excessive mandated procedures, recordkeeping, and reporting requirements that hinder the education process and drive up costs. It is important that nonpublic schools are protected from this same overregulation while maintaining a safe and healthy environment in which children can learn.
This language establishes a supermajority voting requirement as used in other portions of the Michigan Constitution. It is probably not feasible to specify particular areas to exempt from state or local regulation due to the difficulty of identifying and defining all such areas. Broad language prohibiting "burdensome" or "onerous" regulations is vague, would leave the definitions to the courts, and would invite charges that such language would spawn a flood of litigation. The best alternative is to limit regulation to the contours of the current Nonpublic Schools Act and require that future regulatory proposals are sufficiently compelling that a supermajority of the Legislature supports their enactment. One reason that nonpublic schools are efficient and effective is that they escape many of the debilitating restrictions and regulations that public school teachers and administrators complain about. The Nonpublic Schools Act has provided a sufficient regulatory framework to date and will continue to do so.
The UTTC amendment requires the Legislature to enact an implementing statute to provide the means by which Michigan individual and business taxpayers may claim the tuition credit against the state Individual Income tax, the Single Business Tax, and the state education property tax. The implementation will involve three key areas: 1) accurately tracking the application of credits to specific students, 2) establishing a method by which taxpayers may financially support a number of students without having to engage in extensive detailed recordkeeping, and 3) developing the tax forms and filing procedures for claiming credits.
The first step to developing an effective implementation strategy is tracking tuition payments and applying the appropriate credit. A model of how this may be accomplished is the existing procedure for claiming a Michigan Individual Income tax credit for payment of college tuition and fees. As shown on the following page, form MI-1040, Schedule CT (Download study file for image of form (343KB)), requires taxpayers to identify each student’s name, Social Security number, college or university attended, college or university code number, amount of tuition and fees paid, and the amount of the credit. The form also requires the taxpayer to state whether someone else is contributing to the students’ tuition and fees.
The Michigan Department of Treasury should design a similar form and procedure for the UTTC. In addition to identifying the same items listed above, the form should identify whether or not the student’s family income is below the federal poverty level. Each year, the form will be modified to reflect the increasing maximum credit amount. Other modifications may be made as the Department of Treasury deems necessary.
To eliminate the possibility that several taxpayers will claim total credit for a single student in excess of that allowed by law, the Legislature may require alternative schools to issue receipts showing tuition payments made for each student, the date of each payment, and the maximum credit.
A key element of this process will be verifying claims of eligibility for a 100 percent credit based on having family income below the federal poverty level. When a parent fraudulently claims poverty level status, and such a claim results in an excessive tax credit to be claimed by any taxpayer, the parent should be liable to the state for the amount of excess credit claimed. The implementation legislation must provide for this and specifically exempt from liability those taxpayers who pay tuition and claim a credit for such students in good faith after having received confirmation from the parents of the families’ poverty level status.
Taxpayers with substantial tax liability may be able to pay tuition for many alternative school students. For such cases, the Legislature should provide a means by which these taxpayers can make payments to nonprofit charitable organizations which act as a conduit to make direct tuition payments and handle recordkeeping. Such organizations may be either existing nonprofit charities or special scholarship organizations that are dedicated exclusively to paying tuition to students who attend alternative schools. As long as these organizations document that 100 percent of each payment is used to fund tuition for students at Michigan alternative schools, the payments should qualify for the tax credit. These organizations may solicit other funding to cover administrative costs.
Such a provision will remove from businesses and individuals the administrative burden of supporting multiple students at multiple schools, thereby improving the accessibility of the UTTC.
The Michigan Individual Income tax and Single Business Tax both currently provide for a number of tax credits and deductions. Adding a tax credit for alternative school tuition will be relatively straightforward from the taxpayers’ perspective.
As mentioned above, the state Individual Income tax form, MI-1040, should be modified to permit an alternative school tuition credit similar to that currently permitted for college and university tuition using Schedule CT. The new or modified schedule should also allow a taxpayer to elect to claim some or all of credit against the state education property in addition to the Individual Income tax. Although the state education tax is collected locally, the most convenient way to permit a credit is through form MI-1040. Since this tax and the Individual Income tax are both state taxes, reconciling the appropriate credits is a matter of accounting. In addition, a method should be created whereby the State Education Tax may be claimed without filing an Individual Income tax return.
The Single Business Tax annual return C-8000 also includes a schedule, C-8000C (Download study file for image of form (343KB)), that is used to claim a number of tax credits for contributions to community foundations, homeless shelters, and other public contributions. Form C-8000C, shown on the following pages, should be modified to include the tuition credit. A list of students who receive tuition support, similar to the Individual Income tax Schedule CT, should also be included. The most efficient method would be to use a similar schedule for both the Individual Income tax form MI-1040 and the SBT form C-8000.
The Single Business Tax annual return should also be modified to permit businesses to claim a credit against their state education property tax. The state will be required to develop a separate form to claim credit against the State Education Tax for those businesses that do not file a Single Business Tax return.
The Legislature may wish to allow imputed state education property tax payments for renters (both residential and commercial) similar to what is provided now under the "homestead" income tax credit. In that case, 17 percent of rent is imputed to be property taxes. Such an imputed property tax under the UTTC should equal the actual prorated amount of state education property tax paid by the renter.
In addition to improving the quality of education in Michigan through consumer choice, the UTTC will have a strikingly positive impact on state finances and no direct impact on local finances. The end result will be a system with the incentives for schools to become increasingly efficient while at the same time providing greater educational opportunities for Michigan parents and students.
To assess the impact of the UTTC on state and local finances, a model of state and local finance of public schools in the state of Michigan was developed. This model is used to project future financial changes under both the current system of public finance of public schools and the proposed UTTC plan. The model captures the most significant dynamics in the complicated financial structure for public schools and explicitly incorporates incentives that apply to parents as they choose whether to send their children to the assigned public schools or alternative schools.
Appendix I contains a complete discussion of the model, including a comprehensive set of tables showing how the model projects student enrollment costs and other variables. This appendix also includes extensive discussion of the sources of the information used as well as a discussion of key techniques.
Under the current system, the state guarantees every pupil in the government school system, including charter school students, a minimum amount of revenue. Should local property tax revenue to the school district fall below this figure, the state appropriates money to the districts to make up the difference. The guaranteed amount, often called the "foundation allowance," will be approximately $5,400 in fiscal year (FY) 1998. The model assumes that the state per-pupil guarantee increases by about 3 percent per annum from this base for the next ten years.
Some school districts are currently receiving less than the "formula" guarantee, and many are receiving much more. The average revenue is about 6 percent higher than the guarantee amount.69 The variation among school districts in per-pupil revenue is declining under the constitutional amendment known as "Proposal A," which reformed school finance in 1994. In general, Proposal A "averaged up" the spending of the large majority of school districts in order to bring them into closer parity with the highest-spending districts.70 This "averaging up" has significantly increased overall taxpayer support of the public school system.
Per-pupil revenues do not include all revenues of the public school system. "Categorical" program revenues and intermediate school district revenues add roughly $1.3 billion annually; also not included are some federal funds and other local taxpayer sources. However, the rate of per-pupil revenues reasonably predicts the overall revenues of the school system. Since the analysis is concerned mainly with the financial impact that occurs when pupils shift from one system to another, we rely on this "per pupil" revenue pattern to indicate the overall change in revenue and spending that would occur. This makes the analysis conservative, since some of these revenues would probably shift to alternative schools under the UTTC plan.
The model assumes that, under the current system, the number of students in the government school system—now approximately 1.6 million—will grow slowly. The charter school portion of this number grows more rapidly, but starting at a small base of roughly 15,000 students, it does not represent a substantial portion of the overall enrollment. The model projects that alternative school students will number approximately 220,000 in 1998. Under the current system, the model assumes that alternative school enrollment grows somewhat faster than traditional public school enrollment.
Expanded school choice, as discussed in Section I, benefits children who move to private schools as well as those who stay in the traditional public school system. To fully encourage these benefits, the constitutional amendment described in Section III establishes a credit "for tuition for education for any resident child attending a public or nonpublic elementary or secondary school in this state."
Thus, a credit would be available to a parent sending their child to a private school, or a public school that charges them tuition. We have defined such schools in this study as "alternative schools." Currently, as detailed in Appendix I, there are between 400 and 500 students attending public schools and paying tuition, normally because their resident districts have not chosen to participate in inter-district school choice programs. This compares with about 220,000 private school students and 1.65 million students in traditional public schools. Data on these tuition-paid students is not precise, and we expect the number to decline as more districts adopt agreements allowing public school choice without financial penalties for parents, and as state law changes. The average tuition is also small compared with public school costs; our survey data indicates average tuition of about $470 per year, with the most common tuition amount being $1.
We have not adjusted the figures for tax credits calculated for private school attendees to include these tuition amounts, for three reasons. First, the number of students in this category is so small—less than 1/10 of 1 percent of the public school attendance. Second, the fiscal impact is negligible, as the measurement error in modeling a $9.3 billion direct-cost system exceeds the total tuition paid by students in this category. Third, we expect the numbers in this group to decline.
Thus, figures listed under "alternative school" costs and attendance, unless noted otherwise, are those projected by the model for private schools alone. However, the data and other information on this category of alternative school students are described in Appendix I.
To predict the effect of the UTTC on state and local finances, one must predict the behavior of individual parents. These parents are currently acting as consumers of educational services and thus exhibit behavior much like consumers of any other service. Such behavior includes preferring high quality services over low quality services, taking into account factors such as location and convenience, and of course, preferring to pay less for educational services when a lower-priced service is available with comparable quality. A market reflecting such activity operates fairly freely in preschools, in trade schools, and, to a certain extent, in higher education.
In the K-12 education market in Michigan, the "price" that a consumer pays to send his or her child to an assigned public school is close to zero. The cost is not zero—we have already discussed how private taxpayers finance the system—but the price to the parent of sending one more child to the traditional public school is roughly zero. The "price" of sending a child to an alternative school can be substantially higher. These costs include the tuition as well as other costs that the parents must pay, such as books, transportation, and fees.
The model predicts consumer behavior using well-defined techniques that take into account the incentives for parents to place their child in a traditional public school because of the significantly lower effective price. As the UTTC becomes available, the incentive to choose a traditional public school over an alternative school will be reduced. Therefore, more parents are likely to put their children in alternative schools. Appendix I discusses in detail the economic analysis used to project the response of consumers (students and parents) to changes in the price structure (alternative school tuition, tax credits, and "free" traditional public schools) in this market.
The model takes into account the increasing value of the UTTC relative to the average alternative school tuition. As shown in Figure 1, the UTTC starts at a relatively small share of the average alternative school tuition. Over the nine years in which the system is phased in, the maximum tuition tax credit increases to an amount somewhat less than the average alternative school tuition.71
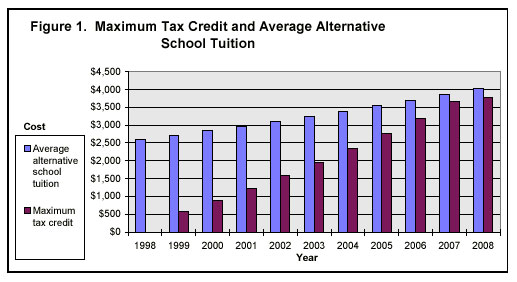 Given this increasing incentive to place children in alternative schools, the model predicts that alternative school enrollment grows significantly. Figure 2 compares alternative school enrollment under the current system with the UTTC plan. It shows that with the UTTC, alternative school enrollment increases from approximately 220,000 to over 550,000 over the next ten years. This rapid growth in enrollment levels off once the UTTC is fully implemented.
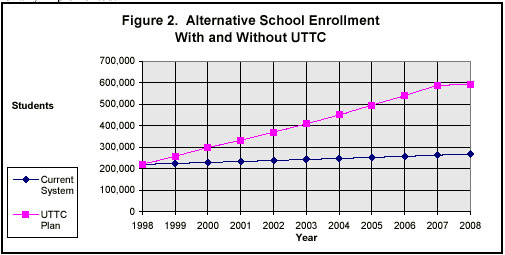 However, even under this scenario, alternative schools take only a small share of the overall market for education. Figure 3 shows that under the UTTC plan, the traditional public school system continues to have over 1.4 million students even after the UTTC is fully phased in. Thus, even with the UTTC system, it is likely that the traditional public school system will remain two to three times the size of the alternative school system.
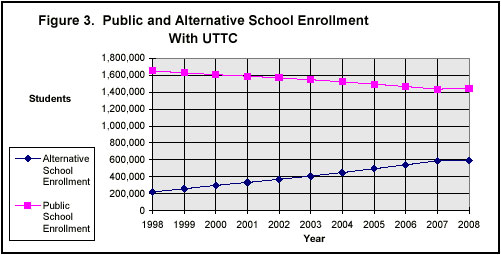
The UTTC both reduces state government expenses and reduces state government revenues. Parents who pay alternative school tuition, and other taxpayers who assist parents with such tuition will receive a tax credit. These tax credits result in less state government revenue.
At the same time, parents who choose to move their children from a traditional public school to an alternative school are moving from a system that costs the state roughly $5,500 per student to a system that costs the state fifty to ninety percent less (depending on the point of time in the UTTC phase-in period). Even when fully phased in, a tax credit of fifty percent of the average public school per-pupil revenue will save the state of Michigan (and therefore Michigan taxpayers) thousands of dollars for each student that migrates to an alternative school.
When the reduced state revenue and reduced state expenses are combined, the model shows that the UTTC plan would have a significant positive effect on state finances. Figure 4 shows the overall net effect. Under the current system, per-pupil state expenditures grow from under $10 billion to almost $14 billion. Under the UTTC plan, state expenditures still increase, but at a significantly slower rate. When these expenditures are added to the revenue loss, the total impact is still substantially less in each year than under the current system. By the time the UTTC is fully implemented, the taxpayers would be spending about a half-billion dollars less each year: $13.1 billion versus $13.7 billion in 2008. This would amount to a total savings to Michigan taxpayers of over $3.4 billion in the first ten years alone and over $550 million each year thereafter.
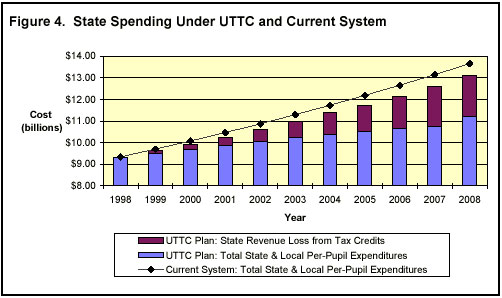 The UTTC avoids undermining the tax base of local units of government and would not distort the financing of individual school districts whose residents decided to support students in other districts. Since the UTTC is integrated into the existing state finance system for local schools, each district would still be guaranteed the same foundation allowance as it would under current laws. The large majority of tax credits would be claimed against the state income tax and state Single Business Tax, which would not affect local tax collections. To the extent residents of a district took tax credits against the 6-mill State Education Tax, which is a state property tax collected by the local school districts, the state would simply increase—dollar for dollar—the amount it provided the school district for its foundation allowance. Each school district would retain the same amount of per-pupil funding it has under current state laws, regardless of how many or how few of their residents claimed tax credits, or where the students sponsored by the residents attended school.
For other local units of government, there would be no direct effect on their tax base. The tax credit can be claimed only against state taxes.
Indirectly, the UTTC would strengthen the economic and tax base of all units of government. First, by encouraging better education for the majority of children who would remain in traditional public schools and allowing all parents to choose the very best school options for their children, the UTTC would help the economy grow through a better-educated citizenry. Second, although less important, the overall positive effect on the state budget would mean hundreds of millions of dollars in net savings. These savings could be used to lower taxes on businesses and individuals, address other budget priorities, or provide additional educational resources.
A careful analysis of Michigan’s state and local financing structure for public schools, using a model that includes both the incentives for alternative school enrollment faced by parents and the effect on the taxpayers of those choices, presents several reasonable conclusions.
First, the UTTC will be popular. If the state provides a tuition tax credit to parents who choose to send their children to alternative schools, many will take that credit. We can anticipate that, as the tuition tax credit increases, more parents will choose to send their children to alternative schools, even if that tax credit does not fully cover their tuition.
Second, even with the UTTC, a majority of parents will keep their children in public schools, which will increase in quality. Even if the tuition tax credit ends up supporting 80 percent of the costs of sending a child to an alternative school, sending that child to an alternative school will still cost parents more than a public school. For this reason alone, many parents will send their children to traditional public schools. As discussed elsewhere in the report, the increase in competition will also force traditional public schools to improve. Thus, after the tuition tax credit has been phased in, public school education will also provide a much more attractive option.
Third, the public school system will remain intact. One common objection to tuition tax credits and other forms of school choice is that they would cause the destruction of the traditional public school system. A sober analysis shows that is simply not the case. Even taking into account the full tuition tax credit proposed in this study, the traditional public school system continues to spend roughly $14 billion in direct per-pupil expenditures and enroll 1.4 million students when the credit is fully phased in. Clearly, it will be forced to become more efficient, but the traditional public school system will continue.
Fourth, taxpayers will save money with the UTTC. Under reasonable assumptions about the number of parents who would choose to send their children to alternative schools, the cost savings from some children moving from 100-percent-taxpayer-financed schools into alternative schools more than outweighs the reduction in state revenue. This analysis projects that, counting the costs of the tuition tax credit, Michigan taxpayers would save over $550 million each year when the program is fully implemented.
Fifth, local municipalities are unaffected by the UTTC. Because the UTTC applies
to only the state Individual Income tax, state Single Business Tax, and State Education
Tax, local municipalities will experience no loss of revenue due to the tax credit.
Most analyses of school finance take into account the funding of only government schools, focusing on the taxpayer sources for such funding. For example, the convulsive debate that resulted in the passage of Proposal A in 1994 was entirely about taxpayer financing of public schools. This analysis brings in, at least partially, the forgotten sector: citizen financing of alternative schools, which include nonpublic schools and tuition-paid public schools. The UTTC will reduce the current disincentive to attend alternative schools; thus, the costs to an individual parent for his or her child to attend traditional public schools and alternative schools must be explicitly addressed.
A close analysis of public and private school costs shows that commonly-used measures do not accurately reflect the true costs of educating children in the two systems. Neither the prevailing "tuition" costs nor the commonly discussed "per pupil expenditures" fully take into account all costs.
In the government school system, Michigan anticipates a per-pupil "guarantee" or "foundation allowance" of about $5,445 per pupil in fiscal year 1998.72 Some school districts will spend less, and others much more, so that the average revenue is about 6 percent higher than that.73 An approximation of 1.6 million students multiplied by the formula guarantee yields an estimate of over $9 billion in direct per-pupil expenditures annually spent on public education. Adjusting for per-pupil expenditures above the guarantee brings the total to over $9.5 billion.
Even that amount does not include categorical and intermediate school district expenditures of roughly $1.3 billion annually, nor some federal funds, nor other local taxpayer sources. Adding these yields current expenditures for Michigan’s government school system that exceed $11 billion annually. 74
The taxpayers also provide additional direct and indirect support of public schools. For example, taxpayer dollars help provide land and facilities for the school system, along with government services, without those facilities contributing to the local tax base.75 Government agencies in Michigan pay no property tax, no sales tax, and no income or single business tax; further, they borrow money at tax-exempt rates.76 All these costs are indirectly paid for by the taxpayers, and many do not appear in the accounting for expenditures. Thus, the actual burden of the government school system on the taxpayers is significantly higher than the foundation allowance might imply.
Private school tuition is about half that of the average per pupil revenue of public schools. Private school tuition in Michigan averages about $2,500, with significant variation among schools.77 This amount is much less than half of the expenditures of the public school system, which is consistent with the national pattern.78 However, just as the per-pupil expenditure for public schools is a significant underestimate of the government school costs, private school tuition also underestimates private school costs. Most religious schools receive significant contributions from their sponsoring organizations to support their operations. Many also receive volunteer time and services from parents. Furthermore, those same parents often face fees for their children’s participation in extra-curricular activities such as sports, music, and various student clubs.79 Thus, while private school tuition is often half or less than the commonly discussed per-pupil expenditure figure for public schools, actual costs are a larger share. Once all private and taxpayer-funded costs are included for both systems, the ratio of total public school costs to total private school costs is less clear, but is probably about 2:1.
It should be noted, however, that the prime motivation behind the movement to parental choice in education is not efficiency or the need to save money, but the desire to improve the education of children.
To analyze the effect of tuition tax credits on taxpayer finances, a model of state and local financing of public schools in the state of Michigan was developed. The model incorporates both the current system, and the proposed Universal Tuition Tax Credit. Although the model does not take into account all the complicated and intricate financial conditions involved in a public school system, it captures the most significant dynamics. It can be used to predict reliably what will happen should the people of Michigan adopt the UTTC.
The model assumes continuation of the current system, in which the state guarantees every school district a minimum per-pupil revenue. The state is proposing $5,445 as the per-pupil guarantee for FY 1998.80 Under the statutes which accompanied Proposal A, some school districts are spending less than this formula guarantee, and many are spending more. As a consequence of the Proposal A reforms, the variation between the lowest and highest spending school districts is being substantially reduced while the average revenue is rising sharply.81 The model assumes that this per-pupil foundation grant can be used to reasonably predict the overall revenues of the school system. As noted above, multiplying the state foundation grant by the number of students in the government system will actually substantially underestimate the total state expenditures to support the system. However, this underestimate would be roughly proportional to the same underestimate in a tuition tax credit scenario.
Using the 1998 budget recommendation as a starting point, we assume that the state per pupil grant guarantee will increase at 3 percent per year for the following ten years. Therefore, for the school year starting in the fall of 1998 (FY 1999), the basic foundation allowance is calculated to be $5,608, which represents a 3-percent increase from the FY 1998 figure of $5,445.82
Department of Education figures indicate that there are slightly more than 1.6 million students in the traditional government school system. Allowing for some growth and incorporating approximately 15,000 charter school students in 1998, we arrive at a base projection of 1,650,000 students in the "public" system, which includes the traditional standard government system and newer charter schools. Multiplying this number by the state per-pupil grant guarantee, we arrive at a current system state and local per-pupil expenditure of $9.3 billion in 1998. As noted above, this direct per-pupil expenditure is a substantial underestimate of the total expenditures, but changes in this measure should be a reliable predictor of the change in total expenditures. The projections of student enrollment and expenditures are shown on page 58 in Table 3 and Table 4, respectively.
The constitutional amendment described in Section III establishes a credit "for tuition for education for any resident child attending a public or nonpublic elementary or secondary school in this state." Thus, a credit would be available to a parent sending their child to a private school, or a public school that charges them tuition. We have defined such schools in this study as "alternative schools."
There are no reliable data from State sources on the number of tuition-paid public school students. To fully explore this category of students, the Mackinac Center conducted a survey of ten public school districts in various areas of the state, in the fall of 1997. The survey revealed the following:
State law currently does not require school districts, in which reside parents who
choose to send a child to another intermediate school district, to "release" the
tuition amount. If the student is "unreleased," the student may be forced to pay
tuition.
Tuition charged by receiving districts varies from $1 to $8,000. The average appears to
be about $470, as most districts charge only nominal fees. The existence of one district
in the sample—Ann Arbor—charging an exorbitant amount clearly skewed the average
upward. Two other measures of central tendency, which tend to be more robust, were much
lower. The median figure—the middle figure—was just $1, as was the mode (the
most common figure).
The decision to refuse to "release" a student appears to be often based on
political opposition to school choice by teacher unions in the district, rather than
fiscal or management considerations. A district which refuses to release a student, who
nonetheless attends school in another district, cannot include that student in their
overall pupil count. This means they do not receive the per-pupil funding for that pupil.
More districts are joining in compacts or agreements that allow free, or nearly free,
movement of students among districts.
In cases where the district refuses to release a student, adverse publicity often results. The case of the Meridian school district not releasing a student to attend the Handley Elementary School in the Saginaw school district in an example. 83
Data from the survey are presented in Table 2, below.
Summary Statistics
|
||||||||||||||||||||||||||||||||||||||||||||||||||||||||||||||||||||||||||||||||||||||||||||||||||||||||||||||||||||||||||||||||||||||||||||||||||||||||||||||||||||||||||||||||||||||||||||||||||||||||||||||||||||||||||||||||||||||||||||||||||||||||||||||||||||||||||||||||||||||||||||||||||||||||||||||||||||||||||||||||||||||||||||||||||||||||||||||||||||||||||||||||||||||||||||||||||||||||||||||||||||||||||||||||||||||||||||||||||||||||||||||||||||||||||||||||||||||||||||||||||||||||||||||||||||||||||||||||||||||||||||||||||||||||||||||||||||||||||||||||||||||||||||||||||||||||||||||||||||||||||||||||||||||||||||||||||||||||||||||||||||||||||||||||||||||||||||||||||||||||||||||||||||||||||||||||||||||||||||||||||||||||||||||||||||||||||||||||||||||||||||||||||||||||||||||||||||||||||||||||||||||||||||||||||||||||||||||||||||||||||||||||||||||||||||||||||||||||||||||||||||||||||||||||||||||||||||||||||||||||||||||||
| Using these districts as an indicator of "refusal to
release" statewide, we can infer that between 400 and 500 students statewide are
currently paying tuition at public schools, at an average tuition of about $470.84
These numbers are tiny compared to approximately 220,000 private school students and 1.65
million students in traditional public schools. If we use the median as a measure of
tuition, the tuition amounts are even smaller—$1 per student multiplied by 400 or 500
students. Thus, figures listed under "alternative school" costs and attendance, unless noted otherwise, are those projected by the model for private schools alone, for three reasons. First, the number of students in this category is so small—less than 1/10 of 1percent of the public school attendance. The real dynamic in the model, in terms of both fiscal impact and migration of students, is between public and private schools. Second, the fiscal impact is negligible, as the measurement error in modeling a $9.3 billion direct-cost system exceeds the total tuition paid by students in this category. Third, we expect the numbers in this group to decline, though not to reach zero.85 |
||||||||||||||||||||||||||||||||||||||||||||||||||||||||||||||||||||||||||||||||||||||||||||||||||||||||||||||||||||||||||||||||||||||||||||||||||||||||||||||||||||||||||||||||||||||||||||||||||||||||||||||||||||||||||||||||||||||||||||||||||||||||||||||||||||||||||||||||||||||||||||||||||||||||||||||||||||||||||||||||||||||||||||||||||||||||||||||||||||||||||||||||||||||||||||||||||||||||||||||||||||||||||||||||||||||||||||||||||||||||||||||||||||||||||||||||||||||||||||||||||||||||||||||||||||||||||||||||||||||||||||||||||||||||||||||||||||||||||||||||||||||||||||||||||||||||||||||||||||||||||||||||||||||||||||||||||||||||||||||||||||||||||||||||||||||||||||||||||||||||||||||||||||||||||||||||||||||||||||||||||||||||||||||||||||||||||||||||||||||||||||||||||||||||||||||||||||||||||||||||||||||||||||||||||||||||||||||||||||||||||||||||||||||||||||||||||||||||||||||||||||||||||||||||||||||||||||||||||||||||||||||||
| Figures for alternative and home school students are not as readily
available. Based on discussions with private school representatives and other educators,
we have started with a projection of 220,000 alternative school students and 20,000 home
school students in the year 1998. As mentioned earlier, "alternative school"
students include all students for whom tuition is paid, whether it be to a public school
or a private school. The vast majority of these students attend private schools. |
Universal Tuition Tax Credit StructureThe UTTC begins at 10 percent of the average state and local per-pupil revenue and grows to 50 percent of this amount.86 The maximum credit of 50 percent of the average per-pupil public school revenue establishes a credit which, when fully implemented, will approximate the average alternative school tuition. The amount of the credit is also limited to 80 percent of the actual tuition paid. This provision provides incentive, similar to a co-payment with a medical insurance policy, for the purchaser to exercise care. It provides downward pressure on the price of tuition, even if the tuition tax credit is enough to cover their children’s tuition. There is an exception to the 80 percent limit, however. A credit of 100 percent of actual tuition paid may be claimed for children in families whose income is below the federal poverty level, subject to the same overall limit of 50 percent of the average per-pupil public school revenue. The proportion of students in this category is small and does not affect substantially the cost of the proposal. The rationale for the inclusion of this provision is to give additional support to parents whose children are in the poorest areas and are in most need of aid. Universal Tuition Tax Credit DynamicsThe Education MarketTo predict the effect of the proposed universal tuition tax credit on state and local taxpayers, we must predict the behavior of individual parents. In the K-12 education market in Michigan, the "price" that a consumer pays to send his or her child to a traditional public school is close to zero. That is not to say that the cost is zero—we have already discussed how private taxpayers finance the system—but the price of sending one more child to a traditional public school is roughly zero. The "price" of sending a child to an alternative school will be substantially higher. It will include the tuition as well as other costs that the parents must face in the alternative school that the traditional public schools cannot impose. Price Elasticity of DemandThe "law of demand," namely that the higher the price of a good, the less consumers will purchase, has been termed the "most famous law in economics, and the one that economists are most sure of."87 To predict consumer behavior, economists use well-defined techniques evaluating the sensitivity of consumers to changes in price. Such techniques, pioneered by the great British economist Alfred Marshall (1842-1924) in the early part of this century, are the foundations of microeconomics.88 The most commonly used measure of consumers' sensitivity to price is known as "price elasticity of demand." It is simply the proportionate change in demand given a change in price.89 If a one-percent drop in the price of a product produces a one-percent increase in demand for the product, the price elasticity of demand is said to be one.90 Hundreds of studies have been done over the years calculating long-run and short-run price elasticity of demand. For most consumer goods and services, price elasticity tends to be between .5 and 1.5. As the price elasticity for most products clusters around 1.0, it is a commonly used rule of thumb.91 A good with a price elasticity stronger than negative one is said to be "elastic;" goods with price elasticities smaller (closer to zero) than negative one are said to be "inelastic." Goods that are more essential to everyday living, and that have fewer substitutes, typically have lower elasticities; staple foods are a good example. Goods with many substitutes, or that are not essential, have higher elasticities. Goods that are considered luxuries, or whose purchase can be easily postponed, often have elastic demand. Table 5 on the next page shows estimated price elasticities of demand for a variety of consumer goods and services, taken from a standard economics textbook.93 For example, the demand for automobiles would, in the short term, be somewhat elastic, as the purchase of a new vehicle can often be delayed. The demand for a specific model automobile would likely be highly elastic, because there are so many substitutes. Table 5 shows estimated price elasticities of demand for a variety of consumer goods and services. Over the long run, the demand for automobiles in rural areas would probably be inelastic, since there are few alternative modes of transportation. Table 5 includes an estimate for the price elasticity of demand of 1.1 for alternative schools. Schooling itself is considered an essential service by most parents, and better schools are so desirable to many parents that they undertake considerable sacrifices to send their children to alternative schools. This would tend to produce a highly inelastic demand. However, there is also a widely available substitute for alternative schools, namely the traditional public schools. For most goods and services, the availability of substitutes produces a highly elastic demand. Given this combination of widely available substitutes and high importance to many parents, it is not surprising that the existing research places the demand elasticity for alternative schools near 1.
Price Elasticity of Demand for Michigan Alternative SchoolsParents are today choosing to send, or not to send, their child to alternative schools based partially on the price of doing so. The model incorporates a price elasticity of demand parameter to project the likely behavior of parents sending their children to alternative schools, as the price changes. Based on this wide body of research on related quantities, and some limited data on demand for alternative and traditional public school services, we have used a price elasticity of demand of 1.0 in this model. 94 While it is impossible to know the actual price elasticity of demand, there is a small amount of data showing that a financial incentive of approximately $1,000 will, in present-day Michigan, induce parents to send their child to alternative schools.95 Economic theory also holds firmly that parents have a strong desire to send their children to better schools, since it increases their "human capital" and thus their earning power for the future. Since we know that a significant number of parents already send their children to an alternative school—all the while paying twice—we cannot avoid the fact that many consumers in this market perceive the value of an alternative school education very highly. Predicting Consumer BehaviorIf we apply this analysis to the price of alternative schools given the existence of a tuition tax credit, we can predict consumer behavior. Table 6 on the next page shows how the UTTC changes the incentive for a parent to send his or her child to an alternative school. It reflects how the decrease in the effective price of alternative school tuition due to the tuition tax credit would change the demand for the services of alternative schools.
Table 6 presents basic data for the school year 1998-99, in which no tuition tax credits are granted. We assume an average alternative school tuition of $2,600 in 1998.96 Because the tax credit is not yet implemented, Table 6 shows that the maximum tax credit is zero. In this base year, a parent pays 100 percent of the cost of alternative school tuition. Calculating DemandIf we assume that the UTTC plan takes effect in 1999 (the 1999-2000 school year), a maximum tuition tax credit of only 10 percent of the average public school per-pupil revenue ($5,776 for 1999) provides a maximum tax credit that year of $578. The dollar amount of $578 is 21 percent of the average alternative school tuition in that year ($2,174). Thus, the parent receiving a tuition tax credit for that student experiences a 21-percent decrease in the relative cost of alternative schools versus traditional public schools. Using a price elasticity demand of -1.0, we would expect a 21 percent increase in demand for alternative schools. Applying Constraints to the ModelA number of factors have been included in this model to try to make it more realistic. First, the increase in the relative affordability of private schools will also likely boost the rate of increase of private school tuition. As noted above, private school tuition—just like public school "per pupil expenditures"—does not include the full cost. It is easy to anticipate that, should a tuition tax credit program go into effect, some of those costs currently being subsidized by churches, religious institutions, or parents’ volunteer work would no longer be subsidized.97 Thus, we have assumed that the average private school tuition grows at 4.5 percent per year, 50 percent faster than the 3.0 percent growth assumed for the public school per-pupil guarantee to account for this effect. Secondly, we have also noted that behavior does not change overnight. Parents with children in traditional public schools are not likely to pull them all out or move them around in the first year the tuition tax credit is available. Thus, we have smoothed the migration behavior slightly by including in the model an adjusted desired migration factor, which indicates the likely migration that would occur with the implementation of the tuition tax credit plan. That smoothed migration factor starts at 17 percent in 1999, tapering to 14 percent, 10 percent, 9 percent, and then 8 percent, before finally moving to zero after the UTTC has been fully implemented. This is somewhat slower migration than a straight application of price elasticity would indicate. Likely Migration to Alternative SchoolsTable 7 on the next page shows the predicted number of students who would migrate from traditional public schools to alternative schools. Table 7 begins with the base-case assumption of total students, government school students, and alternative school students. Since the main dynamic in consumer choice in the education market is between the traditional public schools and private schools, the model is constrained to allow movement between these two sectors only, with the smaller charter school and home school sectors left alone. While this assumption is artificial, the relative size of these sectors suggests that a relaxation of the assumption will matter little in terms of the overall cost.98 From the current system alternative school student enrollment of 220,000, we apply a smoothed desired migration factor. Table 7 indicates that the migration in the first year, before the UTTC is implemented, is zero. This indicates that there is no migration between the two sectors. In the second year, the largest desired migration comes into effect: a 17-percent increase in demand for alternative schools.
Limits on MigrationThe model also includes some self-regulating behavior. It is unlikely that any sector of the economy can grow at 10-20 percent per year indefinitely. Certainly, a 20-percent increase in alternative school enrollment would be difficult to handle, although with some excess capacity and the ability to lease space in other buildings, it may be possible. To account for this supply constraint, the model places a limit of 15 percent per year on migration to alternative schools. Thus, in the first year migration is to be constrained to only 15 percent. In subsequent years, as the desired migration drops to 10, 9, and then 8 percent per year, the migration limit becomes less of a factor. In the last three columns of Table 7, we see that the projected migration between the traditional public schools and alternative schools ranges between 0 and 43,000 students per year. This equates to a migration of approximately 2 percent of traditional public school students each year, a relatively small amount, and leaves the government school sector at 1.4 million students in the year 2005. Alternative schools experience an annual increase in their enrollment of approximately 15 percent each year due to the tax credit, producing a total enrollment of nearly 600,000 in 2005. These figures are shown on the next page in Table 8, which compares the enrollment trends under the current system and the UTTC plan.
The Fiscal Impact of the Universal Tuition Tax CreditEffects on Revenue and ExpensesTo model the effect of the UTTC on state and local finances, the model calculates revenue and expenses under both the current system and the UTTC plan. Under the current law, state per-pupil expenditures equal the per-pupil guarantee multiplied by the number of students in traditional public and charter schools. Under the UTTC plan, the model calculates this amount as well as the state revenue loss due to the tax credits extended to individual and corporate taxpayers who pay alternative school tuition. There are some additional expenditures, approximately $1.3 billion per year, that the taxpayers are now paying for the public school system. Since it is unlikely that this amount would go away or change substantially under the UTTC system, these costs are not included in either scenario. 99 Table 9 on the next page shows the loss of tax revenue due to tax credits under the UTTC plan. The first column shows the number of alternative school students, which grows from 220,000 to almost 600,000 during the ten-year period. This table then shows the maximum tuition tax credit as a share of per-pupil revenue and the maximum tuition tax credit per student.
Utilization of the CreditThe model includes a utilization ratio to adjust for consumer behavior in using the credit and for the 80-percent-of-tuition limit on creditable tuition for most taxpayers. The ratio is the share of the theoretical maximum amount of credits available that are actually claimed. The utilization ratio starts off fairly high at 95 percent; this percentage is selected because, with a maximum tuition tax credit of between $500 and $600, tuition almost everywhere will exceed the maximum tax credit. Almost all those who apply will receive the maximum tax credit. The difference between 0.95 and 1.0 is due to tuition payers who for some reason do not apply for a tax credit. Over time, the utilization ratio drops to 85 percent. The ratio declines largely because the maximum tax credit grows to a level that will exceed 80 percent of the tuition paid by some parents on behalf of their children. (The increase in the relative size of the tax credit—from 21 percent of average alternative school tuition in the first year to 86 percent in the eighth year—is shown in Table 6 on page 64.) The model then calculates a weighted average tax credit per student, which, when multiplied by the number of alternative school students, produces a tax credit total. Table 9 shows that this figure starts at about $140 million in 1999 and increases to almost $2 billion over the ten-year period. Fiscal Impact of the UTTC PlanTo view the net effect on state finances, we must combine the reduction in tax revenue with the direct expenditures for public schools. This results in a comparable figure to the total expenditures under the current system. Table 10 outlines the reduced state public school expenditures that would occur if the UTTC plan were implemented. The first few columns show the per-pupil guarantee, the number of traditional public school and charter school students, and the state and local per-pupil revenue under the UTTC plan. The figure representing expenditures is still a large and growing number, but the growth is less than that which would occur if the current system were allowed to continue unchanged.
Adding the direct public school expenditures to the amount of tuition tax credits produces the total combined costs under the UTTC plan. The total costs grows from $9.3 billion in 1998 to $13.1 billion in 2008. Tax Savings from the Tuition Tax CreditTable 11 on the next page summarizes the fiscal costs under the two systems. Both begin at about $9.3 billion in the year 1998 and grow to over $13 billion ten years later. However, under the UTTC plan, the savings from the reduced number of students in the government school system more than outweigh the reduced tax revenue due to the UTTC. Thus, on net, taxpayers will save between $50 million and $550 million a year under the UTTC plan. This represents a total of over $3.4 billion in the first 10 years alone and over $550 million each year thereafter. These savings may be used to lower individual and business taxes, to fund additional educational programs, or to address other state budget priorities.
Total Spending on EducationWe have already seen that total state and local per-pupil expenditures on schools increase substantially under the UTTC plan, although at a slower rate than under the current system. This does not mean, however, that overall education resources are less than under the current system. Although total state per-pupil expenditures would decline under the UTTC plan, that does not necessarily mean that total expenditures on education would decline. Even when the credit is fully phased in, every dollar of tax credits would be supplemented by private expenditures for private schools. Thus, total private and public expenditures could be higher or lower. More importantly, the expenditures would be more closely aligned with those who receive the benefits and have the opportunity and incentive to demand results. Thus, while taxpayers would save money, they would, more importantly, receive better value for the dollars they do spend. A Note on Refundable Versus Non-Refundable CreditsThe original analysis of the impact of the UTTC assumed that the credit was "refundable," i.e., that a parent who filed an Individual Income tax return could receive money back from the state even though his or her tax liability was less than the amount of tuition paid. A refundable tuition tax credit is actually a combination subsidy and credit; a credit for those who have sufficient tax liability to be offset, and a subsidy for those who, in some years, do not have sufficient tax liability.100 This is one method commonly used to permit low income families to benefit from a tax credit. Since a refundable tuition tax credit is basically a combination subsidy and credit, it suffers from problems similar to those of vouchers as discussed in Section III. Fortunately, however, the final structure of the UTTC provided such powerful incentives and mechanisms for individual and business taxpayers to make tuition payments available for students from low-income and middle-income families, there was no need to make the credit refundable. Gary Wolfram, Ph.D., George Munson Professor of Political Economy at Hillsdale college and former deputy state treasurer for taxation and economic policy, analyzed the dynamics of the proposal and summarized the refundability issue as follows:
Notes on Data Sources
Appendix II. Questions and Answers Regarding the Universal Tuition Tax CreditDuring the development of the Universal Tuition Tax Credit, the proposal was presented to numerous education, business, and government leaders and organizations. Below are answers to specific questions commonly asked about the UTTC. How will the UTTC impact non-educational expenditures in the state budget?
How will the UTTC impact local property tax revenue?
The UTTC sounds too good to be true. How can we expand parental choice in education and save significant money at the same time?
How do you know how many students will migrate from traditional public schools to alternative schools?
The above may be true, but during the first part of the phase-in period the maximum credit is quite small. Is it sufficient to allow and motivate parents to choose alternative schools?
Endnotes
ADDENDUMSince the release of the Universal Tuition Tax Credit in November 1997, the Mackinac Center for Public Policy continues to strengthen the original proposal by incorporating revisions based on input from school choice organizations, legislators, and education experts in Michigan and across the country. The following changes represent an effort to create the most viable and effective school choice proposal.
Revised School Choice Amendment Language No public monies or property shall be appropriated or paid TO IMPROVE PUBLIC EDUCATION BY EMPOWERING PARENTS WITH GREATER FREEDOM TO CHOOSE THE BEST AND SAFEST SCHOOLS THAT MEET THE INDIVIDUAL NEEDS OF THEIR CHILDREN, IT IS HEREBY ESTABLISHED THAT: AS PROVIDED IN THIS SECTION, THERE SHALL BE A CREDIT AGAINST AMOUNTS PAYABLE UNDER THE STATE INCOME TAX, THE STATE SINGLE BUSINESS TAX, THE STATE EDUCATION TAX, OR ANY SUCCESSOR TAXES, AND OTHER TAXES AS PROVIDED BY LAW TO ANY PERSON FOR PAYMENTS MADE BY THE PERSON FOR TUITION FOR EDUCATION FOR ANY RESIDENT CHILD ATTENDING A PUBLIC OR NONPUBLIC ELEMENTARY OR SECONDARY SCHOOL IN THIS STATE. A CONTRIBUTION TO A NONPROFIT ORGANIZATION SHALL QUALIFY FOR THE CREDIT AT THE TIME THAT 100 PERCENT OF THE CONTRIBUTION IS DISBURSED BY THE ORGANIZATION AS TUITION FOR INDIVIDUAL PUPILS PURSUANT TO THE LIMITATIONS OF THIS SECTION. THE TAX CREDIT PER PUPIL FOR TUITION PAYMENTS FOR A PUPIL WHOSE FAMILY INCOME IS AT OR BELOW 150 PERCENT OF THE FEDERAL POVERTY LEVEL SHALL BE 50 PERCENT OF THE AVERAGE STATE AND LOCAL PER PUPIL REVENUE FOR SCHOOL OPERATING PURPOSES FOR PUBLIC ELEMENTARY AND SECONDARY SCHOOLS OR 100 PERCENT OF THE ACTUAL TUITION PAID, WHICHEVER IS LESS. THE TAX CREDIT PER PUPIL FOR OTHER PUPILS SHALL BE LIMITED TO THE LESSER OF THE MAXIMUM CREDIT ESTABLISHED IN THIS SECTION OR 80 PERCENT OF THE ACTUAL TUITION PAID. THE MAXIMUM CREDIT PER PUPIL PERMITTED IN THE STATE FISCAL YEAR FOLLOWING THE RATIFICATION OF THIS AMENDMENT SHALL BE AN AMOUNT EQUAL TO TEN PERCENT OF THE AVERAGE STATE AND LOCAL PER PUPIL REVENUE FOR SCHOOL OPERATING PURPOSES FOR PUBLIC ELEMENTARY AND SECONDARY SCHOOLS. FOR EACH FISCAL YEAR THEREAFTER THE MAXIMUM CREDIT SHALL INCREASE OVER THE PRIOR YEAR BY AN AMOUNT EQUAL TO AN ADDITIONAL FIVE PERCENT OF THE AVERAGE STATE AND LOCAL PER PUPIL REVENUES, UNTIL THE MAXIMUM CREDIT AMOUNT PER PUPIL IS EQUAL TO FIFTY PERCENT OF THE AVERAGE STATE AND LOCAL PER PUPIL REVENUE. THE LEGISLATURE MAY IN ANY YEAR INCREASE THE AMOUNT OF THE CREDIT APPLICABLE TO PUPILS WHO REQUIRE SPECIAL EDUCATION SERVICES, OR FOR ANY OTHER PUPILS AS THE LEGISLATURE DEEMS APPROPRIATE. THE LEGISLATURE SHALL PROVIDE BY LAW FOR THE IMPLEMENTATION OF THIS SECTION. LIMITATION ON STATE REGULATION OF NONPUBLIC SCHOOLS THE LEGISLATURE SHALL NOT ADOPT ANY LAW IMPOSING REGULATIONS ON NONPUBLIC SCHOOLS OR THEIR PUPILS OR TEACHERS IN ADDITION TO THOSE IN EFFECT ON NOVEMBER 7, 2000, EXCEPT BY A VOTE OF TWO-THIRDS OF THE MEMBERS ELECTED TO AND SERVING IN EACH HOUSE. | ||||||||||||||||||||||||||||||||||||||||||||||||||||||||||||||||||||||||||||||||||||||||||||||||||||||||||||||||||||||||||||||||||||||||||||||||||||||||||||||||||||||||||||||||||||||||||||||||||||||||||||||||||||||||||||||||||||||||||||||||||||||||||||||||||||||||||||||||||||||||||||||||||||||||||||||||||||||||||||||||||||||||||||||||||||||||||||||||||||||||||||||||||||||||||||||||||||||||||||||||||||||||||||||||||||||||||||||||||||||||||||||||||||||||||||||||||||||||||||||||||||||||||||||||||||||||||||||||||||||||||||||||||||||||||||||||||||||||||||||||||||||||||||||||||||||||||||||||||||||||||||||||||||||||||||||||||||||||||||||||||||||||||||||||||||||||||||||||||||||||||||||||||||||||||||||||||||||||||||||||||||||||||||||||||||||||||||||||||||||||||||||||||||||||||||||||||||||||||||||||||||||||||||||||||||||||||||||||||||||||||||||||||||||||||||||||||||||||||||||||||||||||||||||||||||||||||||||||||||||||||||||