The recent decline of water levels across the Great Lakes has generated considerable media coverage and alarming pronouncements about climate change. But a new report by researchers with the U.S. Geological Survey documents a natural variation[1] in Great Lakes levels throughout millenniums. Moreover, the fluctuations of the past century have been far less dramatic than previous ones. The geologic record also reveals thousands of years of significant climate variability in the Great Lakes region, according to the report, which is excerpted below.
Lake-Level Variability
Water levels in the lakes vary naturally on timescales that range from hours to thousands of years. Short-term changes are triggered by storms and seiches[2]; seasonal changes are driven by differences in snowmelt, precipitation and evaporation; annual to millennial changes are driven by subtle to major climatic changes affecting both precipitation (and resulting stream flow) and evaporation. Rebounding of the Earth’s surface in response to loss of the weight of melted glaciers has also affected water levels.
Recorded Water-Level History
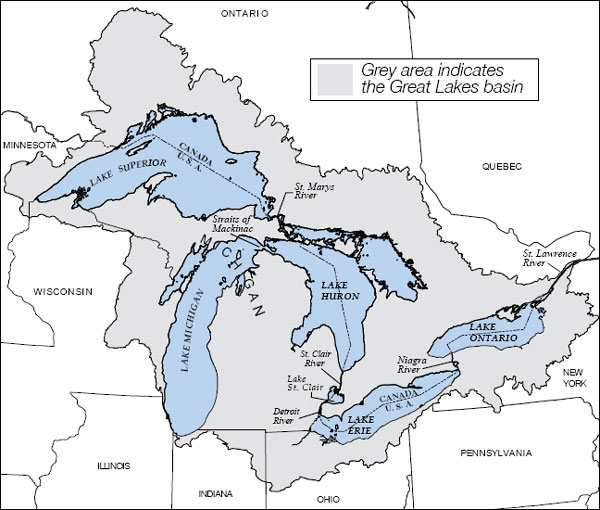
Dredging, control structures[3] , locks, dams, hydroelectric facilities, canals and diversions[4] have altered the hydrology of the Great Lakes/St. Lawrence River System. Dredging and control structures have had the largest impacts. For instance, dredging of the St. Clair River from 1880 to 1965 permanently lowered Lake Michigan/Huron by about 16 inches. Control structures at the outlets of Lake Superior and Lake Ontario keep the levels of these lakes regulated within a range that is smaller than the range of levels that would occur under natural outflow conditions.
Recorded lake-level histories for each lake show some similarities. Periods of higher lake levels generally occurred in the late-1800s, the late-1920s, the mid-1950s, and from the early-1970s to mid-1980s. Pronounced low lake levels occurred in the mid-1920s, the mid-1930s and the mid-1960s, and returned again in 1999. Because Lake Superior water levels have been regulated since about 1914 and levels of Lake Ontario have been regulated since about 1960, lake-level patterns on those lakes since regulation began do not reflect all the natural variability that would have occurred without regulation. For example, unregulated Lakes Michigan/Huron and Erie had extremely high water-level peaks in 1929, 1952, 1973, 1986 and 1997, as well as extreme lows bottoming out in 1926, 1934, 1964 and 2003. Some of those extreme levels, especially the lows, were muted in Lakes Superior and Ontario after regulation began.
Reconstructed Water-Level History
The Great Lakes are rimmed by coastal features[5] and associated sedimentary deposits, some as old as 14,000 years and some that are developing today. Many of these features are formed by and respond to changes in lake level.[6] … Because many … coastal deposits formed in response to either short-term or long-term fluctuations in lake level, they can be used to reconstruct lake-level changes that preceded instrument measurement of water levels that began in the mid-1800s ... .
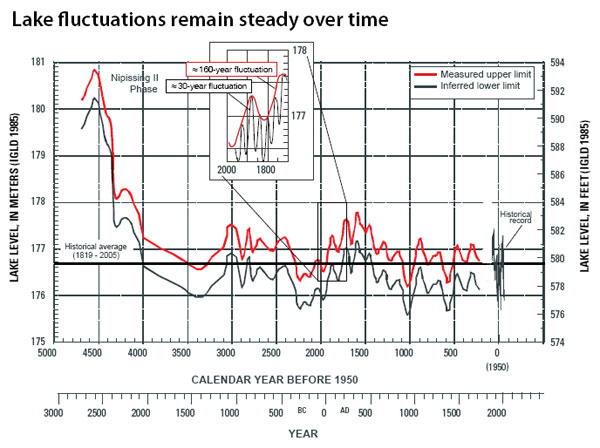
For the Lake Michigan Basin, data from five strandplains[7] were combined to produce a hydrograph[8] of lake-level change over the past 4,700 years.[9] ... [Several] periodic lake-level fluctuations were active in the past and are probably still active in the lake basin today. ... [The] lake level was roughly 13 feet higher 4,500 years ago. This high phase is called the Nipissing II phase[10] of ancestral Lake Michigan, and it is represented around the lakes by high, dune-capped ridges, mainland-attached beaches, barrier beaches and spits. This shoreline commonly was instrumental in isolating small lakes from the larger lake basins. The Nipissing II phase was followed by more than 500 years of lake-level decline during which lake levels dropped to elevations similar to historical averages. Three high phases from 2,300 to 3,300, 1,100 to 2,000, and zero to 800 years ago followed this rapid decline. Pervasive in the hydrograph is a quasi-periodic[13] rise-and-fall pattern of about 160 ± 40 years in duration. This fluctuation can be extended into the historical record, and it appears that the entire historical dataset (mid-1800s to present) may be one such 160-year quasi-periodic fluctuation. Superimposed on this 160-year fluctuation is a short-term fluctuation of 32 ± 6 years in duration. This lake-level rise-and-fall pattern produced the individual beach ridges in most embayments[14] and is also expressed in the historical data, most easily seen in the low levels in the 1930s and 1960s and again starting in the late 1990s.
Relation to Climate
... The importance of climate variability in controlling Great Lakes water levels during the past 5,000 years has been assessed by comparing independent proxy records[15] of past climate variability with the reconstructed water-level history of Lake Michigan inferred from sediments. The development of high-resolution and well-dated paleoclimate[16] records, such as those from inland bogs and lake sediments, has revealed significant climatic variability in the Great Lakes region at decadal to millennial timescales during the past several thousand years. One unsettling pattern in these records is that, despite being a relatively humid region, severe droughts larger than any observed in the past century occurred several times in the last few thousand years and had large and long-lasting ecological effects. For example, between about 1,000 and 700 years ago, a time interval broadly consistent with the Medieval Warm Period,[17] a series of large-magnitude moisture fluctuations occurred over the western Great Lakes region, the Great Plains and the western United States.[18] Lake Michigan water levels were greatly affected by these fluctuations, particularly a large drought about 1,050 years ago. This large drought dramatically altered forest composition in southeastern Michigan[19] and may have extended well into eastern North America.
Another major drought in the region, which was probably even larger than the Medieval Warm Period droughts, was associated with the large drop in Lake Michigan water levels between 4,500 and 4,000 years ago. At that time, water levels in Lake Michigan dropped at a rate at least five times the rate of isostatic rebound.[20] Although non-climatic factors may have been involved in this rapid drop, the timing corresponds to a well-documented and widespread centennial-scale drought that affected much of the North American mid-continent — activating dune systems, causing widespread fires and leading to long-lasting changes in forest composition.[21] Abrupt climate changes at that time are well documented on most continents, suggesting potential global-scale linkages.
Times of prolonged high water levels in the Great Lakes (highstands) have also been linked to climate variability. For example, bog surface-moisture reconstructions and inland lake records from throughout the Great Lakes region indicate wetter conditions during highstands.[22] Pollen records indicate that populations of trees favoring moist conditions also expanded at these times.[23] Although some climate changes associated with lake-level fluctuations were widespread, others were probably more spatially variable, with different areas of the Great Lakes Basin receiving more or less moisture. The water-level history of the Great Lakes integrates these spatial patterns. Comparison of localized records of climate variability from throughout the Great Lakes Basin (for example, records from small lakes, bogs and tree rings) with the regionally integrated record of Great Lakes water-level history will … help develop hypotheses regarding the atmospheric-circulation patterns associated with Great Lakes water-level fluctuations at scales of decades to millennia.
Clearly, the water balance of the Great Lakes region has varied considerably, and the overall variability for the past 14,000 years far surpasses that of the last 100 years in magnitude and ecological effect. Mechanisms behind climatic variability at these long timescales are poorly understood; however, many severe moisture fluctuations of the past century have been linked to dynamics of the ocean-atmosphere system, particularly variability in sea-surface temperatures and the associated changes in atmospheric circulation. For example, sea-surface temperature variability in both the Pacific and the Atlantic has been linked to changes in atmospheric circulation that influence the water balance of the mid-continent, including the Great Lakes region.[24] Interactions between land surface and atmosphere, particularly with regard to soil moisture, often extend and amplify a large drought.[25] The extreme fluctuations in water balance evident in the Great Lakes water-level history and other paleoclimatic records may represent interactions and amplifications of this kind, as well as responses of the ocean-atmosphere system to variability in external influences such as solar radiation and volcanic activity.[26] …
Relation to Coastal Ecosystems
Water-level fluctuations in the Great Lakes are of great ecological importance in the coastal zone because even small changes in lake level can shift large areas from being flooded to being exposed and vice versa. The vegetation of shallow-water areas in the Great Lakes is the one biotic resource most directly affected by natural or regulated changes in water level. Individual plant species and communities of species have affinities and physiological adaptations for certain water-depth ranges, and their life forms may show adaptations for different water-depth environments. Changes in water level add a dynamic aspect to the species-depth relation and result in shifting mosaics of wetland vegetation types. In general, high water levels kill trees, shrubs, and other emergent[27] vegetation, and low water levels following these highs result in seed germination and growth of a multitude of species. Some species are particularly well suited to recolonizing exposed areas during low-water phases, and several emergents may coexist there because of their diverse responses to natural disturbance.
In the first year after a reduction in water levels, the distribution of new seedlings is due to the distribution of seeds in the sediments. In ensuing years, the distribution of full-grown plants is due to survival of seedlings as they compete for growing area. If one species is favored in early colonization, its density may be great enoughthat it can maintain dominance of an area. In most cases, early colonizing species or communities are later lost through competitive displacement, but the opportunity to go through a life cycle allows them to replenish the seed bank in the sediments. Occasional low water levels are also needed to restrict growth of plants that require wet conditions, such as cattails, at higher elevations in wetlands that are typically colonized by sedges and grasses.
The magnitude of lake-level fluctuations is of obvious importance to bordering wetland vegetation because it directly results in different water-depth environments.[28] The different plant communities that develop in a Great Lakes wetland shift from one location to another in response to changes in water depth. The water-depth history largely determines the species composition of a particular site at a given point in time…
The effect of water-level changes on shorelines varies with the morphology, composition and dominant processes of the coast. Variability in lake levels causes erosional and depositional processes to take place at different elevations over time. The most dramatic effect is the impact of an elevated storm surge during high lake levels, flooding low-lying areas and eroding mobile substrates. These storms can liberate sediment from upland areas, feeding the littoral[29] system, and can ultimately nourish downdrift shorelines. The effects of this nourishment may not be seen until times of low water levels when exposed sand bars, widened beaches and dune growth are evident.
Water-level fluctuations in the Great Lakes also play a major role in development and stabilization of coastal dunes. Studies of buried soils within dunes along the southeastern shore of Lake Superior and eastern shore of Lake Michigan show that dune building occurred during the high lake-level periods that have recurred about every 160 years. High lake levels destabilize coastal bluffs and make sand available to leeward perched dunes.[30] Intervening periods of lower lake levels and relative sand starvation permit forestation and soil development on the dunes.[31]
Summary
... Independent investigations of past climate change in the basin over the long-term period of record confirm that most of these changes in lake level were responses to climatically driven changes in water balance, including lake-level highstands commonly associated with cooler climatic conditions and lows with warm climate periods. The mechanisms underlying these large hydroclimatic anomalies are not clear, but they may be related to internal dynamics of the ocean-atmosphere system or dynamical responses of the ocean-atmosphere system to variability in solar radiation or volcanic activity. ...
The extreme high and low lake levels measured in recorded lake-level history have altered storage by as much as 31 cubic miles in Lake Michigan-Huron and as little as 9 cubic miles in Lake Ontario. Diversions of water into and out of the lakes are very small compared to the total volume of water stored in the lakes.
Conclusion
A variety of factors influence lake levels that may shift hourly, daily and seasonally, or even over centuries and millennium. Some of the causes are easily understood, including the levels of snowmelt, precipitation and drought. Other possible causes are not fully understood, including the impacts of solar and volcanic activity and the interaction between Earth’s atmosphere and oceans. But the latest research by the U.S. Geological Survey documents that current conditions are well within the natural variability of long-term cyclical change.
[1] Excerpted from the U.S. Department of the Interior U.S. Geological Survey Circular 1311 “Lake-Level Variability and Water Availability in the Great Lakes”; available online at http://pubs.usgs.gov/circ/2007/1311/
[2] Stationary waves usually caused by strong winds and/or changes in barometric pressure. Seiches are found in lakes, semi-enclosed bodies of water and areas of the open ocean.
[3] Levees and breakwalls, for example.
[4] A transfer of water from the Great Lakes Basin into another watershed, or from the watershed of one of the Great Lakes into that of another.
[5] Any geological feature along the coast, from dunes, beaches and swamps to cliffs and rock outcroppings.
[6] Thompson, T.A., Baedke, S.J., and Johnston, J.W., 2004, Geomorphic expression of late Holocene lake levels and paleowinds in the upper Great Lakes, in Hansen, E.C., ed., The geology and geomorophology of Lake Michigan’s coast: Michigan Academician, v. 35,p. 355-371.
[7] Shore-parallel ridges of sand commonly occurring in embayments along the lakes, forming a washboard pattern inland from the shore.
[8] A graph showing water level, flow rate, or some other property of water with respect to time.
[9] Baedke, S.J., and Thompson, T.A., 2000, A 4,700-year record of lake level and isostasy for Lake Michigan: Journal of Great Lakes Research, v. 26, p. 416-426.
[10] Nipissing phases are one or more high levels of the Great Lakes between 6,000 and 4,000 years ago. Nipissing lake levels were slightly more than 4 meters (13 feet) higher than historical levels.
[11] Neff, B.P., and Nicholas, J.R., 2005, Uncertainty in the Great Lakes water balance: U.S. Geological Survey Scientific Investigations Report 2004-5100, 42 pp.
[12] Lakes Huron and Michigan are usually considered as one lake because of their wide connection at the Straits of Mackinac.
[13] A repetitive behavior that is not uniform in period or amplitude.
[14] A hyrdrogeological formation that either resembles or is actually a bay.
[15] A reconstructed history of environmental changes based on the contents of a natural archive (for example, sediments, ice cores), typically using an indicator, measurement, or suite of measurements that are highly correlated with a particular environmental variable (for example, temperature).
[16] The climate of a given period of time in the past.
[17] A warm interval lasting several centuries, beginning around 1,000 years ago and particularly well documented in Europe.
[18] Booth, R.K., Notaro, M., Jackson, S.T., and Kutzbach, J.E., 2006, Widespread drought episodes in the western Great Lakes region during the past 2000 years—Geographic extent and potential mechanisms: Earth and Planetary Science Letters, v. 242, issues 3-4, p. 415-427.
[19] Booth, R.K., and Jackson, S.T., 2003, A high-resolution record of late-Holocene moisture variability from a Michigan raised bog, USA: Holocene, v. 13, p. 863-876.
[20] Rebounding of the Earth’s surface in response to loss of the weight of melted glaciers.
[21] Booth, R.K., Jackson, S.T., Forman, S.L., Kutzbach, J.E., Bettis, E.A., Kreig, J., and Wright, D.K., 2005, A severe centennial-age drought in continental North America 4200 years ago and apparent global linkages: Holocene, v. 15, p. 321-328.
[22] The uppermost topographic position or elevation reached by lake level during a specific period in time. For example, Booth and Jackson, 2003; Booth and others, 2004.
[23] Booth, R.K., Jackson, S.T., and Thompson, T.A., 2002, Paleo-ecology of a northern Michigan lake and the relationship among climate, vegetation, and Great Lakes water levels: Quaternary Research, v. 57, p. 120-130.
[24] McCabe, G.J., Palecki, M.A., and Betancourt, J.L., 2004, Pacific and Atlantic Ocean influences on multidecadal drought frequency in the United States: Proceedings of the National Academy of Science, v. 101, p. 4136-4141, 2004; Schubert, S.D., Suarez, M.J., Pegion, P.J., Koster, R.D., and Bacmeister, J.T., 2004, On the cause of the 1930s dust bowl: Science, v. 303, p. 1855–1859; Booth, R.K., Notaro, M., Jackson, S.T., and Kutzbach, J.E., 2006, Widespread drought episodes in the western Great Lakes region during the past 2000 years—Geographic extent and potential mechanisms: Earth and Planetary Science Letters, v. 242, issues 3–4, p. 415–427.
[25] For example, Delworth, T.L., and Manabe, S., 1988, The influence of potential evaporation on the variabilities of simulated soil wetness and climate: Journal of Climate, v. 1, p. 523–547; Manabe, S., Wetherald, R.T., Milly, P.C.D., Delworth, T.L., and Stouffer, R.J., 2004, Century-scale change in water availability—CO2-quadrupling experiment: Climatic Change, v. 64, p. 59–76; Schubert, S.D., Suarez, M.J., Pegion, P.J., Koster, R.D., and Bacmeister, J.T., 2004, On the cause of the 1930s dust bowl: Science, v. 303, p. 1855–1859.
[26] For example, Adams, J.B., Mann, M.E., and Ammann, C.M., 2003, Proxy evidence for an El Niño-like response to volcanic forcing: Nature, v. 426, p. 274; Meehl, G.A., Washington, W.M., Wigley, T.M.L., Arblaster, J.M., and Dai, A., 2003, Solar and greenhouse forcing and climatic response in the twentieth century: Journal of Climate, v. 16, p. 426–444; Rind, D., Shindell, D., Perlwitz, J., Lerner, J., Lonergan, P., Lean, J., and McLinden, C., 2004, The relative importance of solar and anthropogenic forcing of climate change between the Maunder Minimum and the present: Journal of Climate, v. 17, p. 906–929.
[27] Refers to vegetation with roots in water and parts that grow above the water surface.
[28] Environment Canada [Wilcox, D.A., Patterson, N., Thompson, T.A., Albert, D., Weeber, R., McCracken, J., Whillans, T., and Gannon, J., contributors], 2002, Where land meets water—Understanding wetlands of the Great Lakes: Toronto, Ontario, 72 pp.
[29] Pertaining to the area of the coast affected by near-shore waves and currents.
[30] Dunes that sit on a plateau high above the shore; they consist of sand as well as other loose material, and dramatically changing lake levels help to create them.
[31] Anderton, J.B., and Loope, W.L., 1995, Buried soils in a perched dunefield as indicators of late Holocene lake level change in the Lake Superior basin: Quaternary Research, v. 44, p. 190–199; Loope, W.L., and McEachern, A.K., 1998, Habitat change in a perched dune system, in Mac, M.J., Opler, P.A., Puckett, C.E., Haecker, and Doran, P.D., eds., Status and trends of the Nation’s biological resources, volume 1: U.S. Geological Survey, p. 227–230; Loope, W.L., and Arbogast, A.F., 2000, Dominance of a ~150-year cycle of sand-supply change in late Holocene dune-building along the eastern shore of Lake Michigan: Quaternary Research, v. 54, p. 414–422.