This guide explains how privatization programs can help cities cut costs. Topics include identifying appropriate privatization opportunities, developing programs, and overcoming obstacles. 20 pages.

Mayors, city council members, and city managers across the nation continue to confront unprecedented fiscal constraints as the cost of operating government continues to outpace revenues. City officials need a solution to the fiscal crisis that is practical, responsive, entrepreneurial, and comprehensive, yet provides flexibility as to project scope and the timing of implementation.
Comprehensive, city-wide privatization programs meet these criteria. Comprehensive privatization programs apply nine types of privatization on a city-wide basis to government-owned assets, services, facility operations, debt and needed new facilities or infrastructure. Typically, two to three types of privatization apply to each government activity. Such privatization programs can generate at least 100 to 200 privatization opportunities for a city.
Governments should view comprehensive privatization programs as a means to reinforce and enhance their ability to govern and increase the level and quality of services for their constituents. Government officials actively participate in designing the program. They select the criteria that determine whether privatization opportunities proceed beyond the first phase. They determine the number, type, and scope of privatization opportunities that are fully developed. Moreover, they set the ground rules because they identify: 1) the level of control they want; 2) the level of risk they are willing to incur; and 3) which assets are in play. Tradeoffs and compromises will be necessary in order to implement a comprehensive privatization program, and changes and flexibility are required of government.
However, the benefits are likely to outweigh any risks that city officials may have to take. If properly structured and implemented, comprehensive privatization plans can generate non-tax revenue, reduce government costs, and assist in the finance and development of needed new facilities and infrastructure.
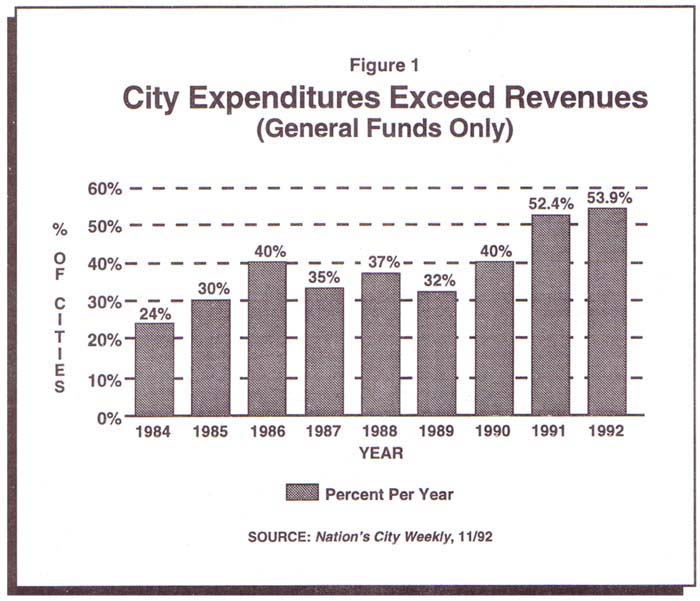
According to a report from the National League of Cities, over half of the country's cities and towns were facing budget deficits as of July 1992. Of the 620 cities and towns that responded to the League of Cities survey, 54 percent reported budget deficits for 1992, slightly more than in 199 1. Moreover, small cities and towns are just as likely to be facing red ink as large urban cities.
A number of interrelated trends are causing the fiscal problems. These include: 1) surging city-government spending; 2) rapid escalation in government employee salaries and fringe benefits; 3) unfunded state and federal mandates; 4) the recession; and 5) a declining tax base in many cities.
TREND #1: The Tremendous Growth in City-Government Spending and Taxes.
Per capita city-government spending doubled in real terms from 1960 to 1990, according to Census Bureau data.[1] In the ten fastest-shrinking of the 40 largest cities, real per capita government spending increased even faster, rising an average of $855 between 1960 and 1990.[2]
Increases in city revenues have been driving the growth in government spending (see Figure 1 above). City revenues increased 22 percent after adjusting for inflation and population from 1980 to 1990.[3] State and local governments collected $531 billion in taxes in 1991, a 5 percent increase from the previous year.[4]
Much of this money has been spent on expanding government by greatly increasing the number of city-government employees. The number of public employees in the country's largest cities rose 38 percent faster than did their populations from 1960 to 1990.[5] State and local governments employed 15.1 million people as of 1991, an increase of 149 percent since 1960, according to the Census data.[6]
Even during the latest recession, state and local government employment has continued to grow rapidly. Local government payrolls grew by 173,000 workers between January 1992 and December 1992, according to the Department of Labor.[7]
TREND #2: The Rapid Escalation in Government Employees' Salaries and Fringe Benefits.
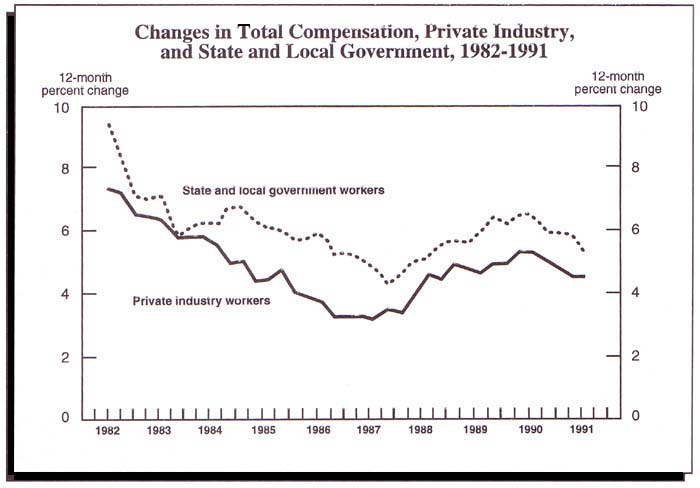
Not only has the number of city employees mushroomed over the last decades, but so has their pay. From 1980-1990, state and local public employees received an average annual compensation increase of $4,258. This amounts to increases of $6.32 for every $1.00 of private-employee increase during the same time period, according to a report from the American Legislative Exchange Council (ALEC).[8] These findings were reinforced by the December 1991 U.S. Department of Labor report on Employment Cost Indexes and Levels 1975-91 (see Figure 2 above).
Moreover, on average, public employees have: 4.4 days more in paid holidays;[9] 3.1 more days in paid vacation time after one year of work;[10] and 28 percent higher pension and insurance benefits than workers in private industry.[11]
TREND #3: Unfunded State and Federal Mandates.
State and federal mandates are also adding greatly to cities' financial obligations. A federal EPA storm water mandate for cities of under 100,000, for instance, is projected to cost as much as $20,000 per family in every community.[12] Another EPA regulation, this mandating new regulations on radon levels in drinking water, may force many cities and towns to pass on $14.5 billion in new capital and operating costs to local ratepayers and taxpayers.
Columbus, Ohio, a city with a population of 633,OW, did a thorough analysis of the costs of complying with federal mandates from the Clean Water and Safe Drinking Acts. Total costs to the city were estimated to approach $1 billion-$7'70 million for Clean Water and $105 million for Safe Drinking Water.[13]
TREND #4: The Movement of People from the Cities to the Suburbs and Exurbs.
Jobs and residents have been leaving the nation's major central cities for the suburbs at high rates over the last 40 years. Since 1950, the population in St. Louis has fallen by over 50 percent, while in Detroit and Cleveland it has declined by more than 40 percent.[14] On average, central cities contain only one-fourth of the population in metropolitan areas of more than one million. Furthermore, two-thirds of the job growth in America between 1960 and 1980 was in the suburbs.[15] The population loss has meant a smaller tax base in cities. thus further exacerbating the fiscal problems.
TREND #5: The Recession.
The recession has also taken a toll on cities. Slow economic growth has caused income and sales taxes to fall short of revenue projections. Nearly four out of five respondents to the National League of Cities survey reported that they were less able to meet their financial needs in 1992 than in 1991.[16]
Trends Are Interrelated. These five trends are highly interrelated. For example: since employee salaries and benefits amount to 60 percent of the average city's budget, the rapid growth in public employee compensation was a driving force behind the increase in spending. Moreover, there appears to be a correlation between the high taxes required to fund the large increases in government and the movement of people away from these cities. In the cities whose governments grew most quickly between 1960 and 1990, for example, population declined by 37 percent. Population loss, in turn, reduces a city's tax base, meaning in order to raise the same amount of revenues as previously, the city must increase taxes.
THE FAILURE OF TRADITIONAL METHODS
METHOD #1: Tax Increases. The most common methods for cities and towns to deal with budget deficits is to increase taxes and fees, reduce services, and/or issue short-ten-n debt. Of the cities responding to the National League of Cities survey, 72 percent raised taxes or fees or imposed new ones in 1992. This reliance on tax increases has numerous adverse effects, including slowing economic growth, driving businesses away from the cities. and causing citizens to rebel with tax revolts.
METHOD #2: Service Cuts. While city taxes and spending have been skyrocketing, services have been reduced in many cities. According to a survey of 50 cities by the U.S. Conference of Mayors covering the period from 1980-1990, the majority of cities raised taxes; of these cities, 60 percent had also reduced services.[17]
Cuts in essential services, such as police and courts, are unnecessary at a time when city taxes and spending are rising greatly. The problem is not insufficient government funds, but rather the often inefficient public-sector delivery of services. This inefficiency drives up operating costs. City operating costs increased 22 percent from 1980 to 1990.[18] The operating cost increases in turn are largely the result of increases in unit costs, meaning the costs of providing services outstrip the overall cost increases in the general economy. According to ALEC, unit-cost escalation averaged 28 percent (inflation and population adjusted) between 1980 and 1990 among 41 large cities surveyed.[19] Insulated from competition, government units have little incentive to cut costs or implement innovative techniques to increase productivity.
METHOD #3: Short-term Debt. Another method of balancing budgets increasingly used by city governments is to issue short-term debt.
In 1990, state and local government debt totaled $648.6 billion.[20] This is more than double the $303.7 billion of total debt in 1981 and 900 percent greater than in 1960.
The increasing reliance on short-term fixes such as tax increases and debt to finance budget shortfalls has resulted in lowered credit ratings for many cities, thereby reducing their ability to incur additional debt. (see Figure 3 - click More Images to view)
There is a better way to balance budgets and put a stop to continually escalating city government spending. The solution: generate new non-tax revenue and cut the costs of government by implementing a comprehensive city-wide program to privatize selected government services, operations, facilities, and assets.[21]
Comprehensive privatization programs involve systematically applying a variety of privatization techniques across an entire range of government services, facility operations, and assets. Privatization techniques can also be applied to a city government's organizational structure, cash management and debt, facilities and infrastructure which need to be renovated or expanded, and new facilities and infrastructure. Applying different privatization methods to these government activities can generate 100 to 200 privatization opportunities in an average city.
Objectives of a Comprehensive Privatization Program. There are many reasons for policymakers to explore the possibilities of privatization. Studies have demonstrated that carefully implemented privatization efforts can lead to significant cost savings, efficiency gains, and greater flexibility, while allowing city officials more time to determine policy, rather than manage personnel.[22] City-wide privatization programs have ten main objectives, These are to:
1. Improve the quality, responsiveness, and efficiency of public services.
2. Finance and build needed new facilities and infrastructure, not defer construction.
3. Reduce or eliminate government equity, and/or debt for needed rehabilitation and construction of facilities and infrastructure, rather than increasing cash outlays or municipal bond financing, or deferring maintenance.
4. Proactively manage all hard and soft government-owned assets to generate additional revenue from prior and current government investments.
5. Maintain, and possibly increase, employment opportunities in the local and regional economy.
6. Enhance the economic performance of facilities and infrastructure to generate additional revenue rather than continuing operational deficits.
7. Dispose of government-owned companies, pulling governments out of businesses that the private-sector can provide.
8. Improve government organizations and management, rather than duplicate efforts and fostering inefficiency.
9. Dispose of government-owned facilities and infrastructure, rather than continuing to be fully responsible for operational deficits and owner risks.
10. Reduce, and possibly eliminate, income lost from ineffective management of cash and/or debt.
In addition to the benefits listed above, privatization, if structured well, can reduce most of the problems and risks associated with owning and operating businesses and facilities that compete in the commercial industry.
Why a "Comprehensive" Approach to Privatization? City-wide privatization programs provide government officials with a much wider array of financially feasible privatization projects than do piecemeal approaches to privatization. Comprehensive privatization programs enable governments to enhance the effectiveness and quality of government services, facilities and infrastructure, while requiring less, not more, tax-based funds. The cumulative total of additional non-tax revenue and cost savings from the anticipated 100 to 200 privatization opportunities will also have a profound effect on the financial condition of a government. There are other advantages:
Flexibility. Governments can select from a menu of different privatization opportunities and have great flexibility about when to implement the chosen opportunities.
Short and Long-Term Results. If a government is facing a budget shortfall and wants to focus on short-ten-n results, privatization opportunities can be selected which produce an economic return and/or cost savings in as little time as three months.
Greater Impact. The cumulative impact on the quality of services and the financial impact of privatization is much greater under a comprehensive approach.
A city-wide privatization program consists of six separate and distinct phases. These phases are clearly interdependent. The phases include:
Phase 1: Choosing the Privatization Team.
Phase 2: Identifying Appropriate Privatization Techniques.
Phase 3: Identifying Privatization Opportunities.
Phase 4: Evaluating Privatization Opportunities.
Phase 5: Developing Implementation Plans.
Phase 6: Overcoming Obstacles to Privatization.
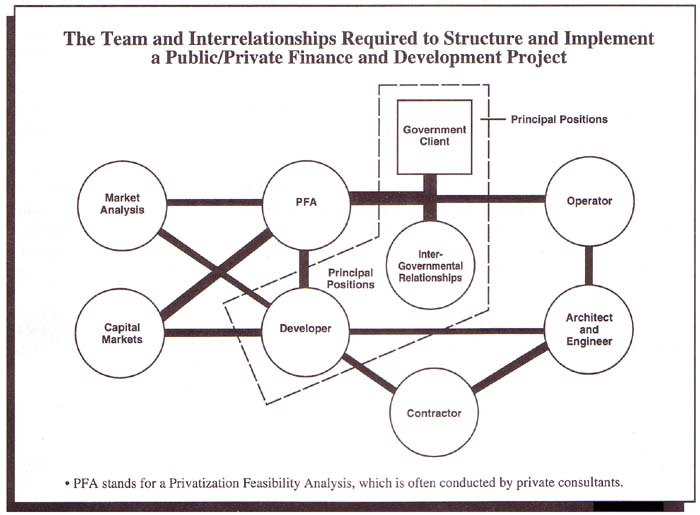
A team needs to be assembled that will design and implement the privatization program. Structuring successful privatization programs requires a careful balance of intangible ingredients, such as creativity and insight into the marketplace. (see Figure 4)
Other important qualities team members should possess include:
Entrepreneurial spirit.
Knowledge of the economic return required by the private investment community for each type of project.
Ability to develop alternative privatization plans that balance a government's constraints and opportunities with the often rigorous requirements of private investors and the capital market.
Knowledge and access to the national network of private companies offering the services required for each of the privatization opportunities.
Ability to carry out exhaustive financial analyses and develop alternative deal structures from the perspectives of both the government and the private-sector.
A high level of sensitivity and responsiveness to the participating public and private groups, as well as users, media and the voters.
Ideally, the team of advisors would include individuals with expertise in the following areas:
Public/Private Deal Structures/Privatization Plans
State-of-the-Art Public/Private Finance Plans and Instruments
Financial Models and Cost Analysis
Traditional Public Finance and Current Private Finance
Legislation and Regulation
Public/Private Partnership Agreements
Land and Building Development
Taxes
Asset Valuation
Facility Operations
Cash Management and Debt Restructuring
Business Management
Investment and Development Incentives
Local Commercial Development Market
Delivery of Services
Building Construction
Architecture and Engineering
The government's team for a privatization program must continually consider future contingencies, such as: 1) how to implement a privatization opportunity; 2) what the political obstacles will be; 3) when the project should be implemented, and so on. One individual should have responsibility for the entire project.
Most governments using privatization to generate new revenue or reduce costs typically use only one or two types of privatization. The most common types of privatization are contracting out public services to the private sector and selling government-owned enterprises. In order to fully utilize privatization, governments should expand their arsenal by using nine types of privatization and a wide variety of privatization techniques. The nine types of privatization and examples of the various privatization techniques (see Table 1) used for each type are as follows:
|
A Generic “Menu of Privatization Opportunities” |
|
An example of privatization opportunities that result from applying the nine types of privatization on a city-wide basis for a relatively large U.S. city. |
|
TYPE 1: Transfer Facility Operations to Private-Sector Management Companies.
|
|
TYPE 2: Fully Utilize Government-Owned Hard and Soft Assests.
|
|
TYPE 3: Structure and Implement the Public/Private Finance and Development of Facilities and Infrastructure
|
|
TYPE 4: Structure the Public/Private Lease or Partial Disposition of Facilities.
|
|
TYPE 5: Enhance the Economic Performance of Existing Government-Owned and Operated Facilities.
|
|
TYPE 6: Structure Selected Public Services to be More Competitive
|
|
TYPE 7: Streamline Government Organization and Restructure Selected Administrative Groups and Departments.
|
|
TYPE 8: Enhance Cash Management and Restructure Debt.
|
|
TYPE 9: Structure the Disposition of Government-Owned Companies.
|
TYPE 1: Transfer Facility Operation to a Private-Sector Management Company. Many governments operate facilities that could be operated by private management firms specializing in a particular type of facility. Example: sports and entertainment facilities. A number of highly qualified facility management companies are available to government. These firms take advantage of their economies of scale and their ability to specialize in one type of facility or, in some cases, one type of operation.
By leveraging their national network of entertainers and events, these private management firms are better able to generate new bookings. Private management firms, or operators, also introduce innovative management techniques to control operational costs. By retaining private management companies, governments are often able to reduce or even eliminate the need for operating subsidies, and share the additional net income stream.
TYPE 2: Fully Utilize Government-Owned Hard and Soft Assets. Most governments passively manage their real estate properties, which in most instances represent valuable assets. Not only are governments not monetizing selected assets, they are having to fund maintenance and insurance costs. While wholesale selling of assets is never advocated, a selected few assets could be sold and returned to the property-tax rolls to generate long-term streams of income for governments.
TYPE 3: Structure and Implement the Public/Private Finance and Development of Facilities and Infrastructure. Governments are continually studying and analyzing the feasibility of public and public/private development projects. However, many of these efforts neglect to fully consider all of the potential sources of revenue or cost sharing. Nor are innovative public/private finance and development plans explored.
There are many ways to structure public/private development projects. Three techniques increasingly employed around the world include:
Build-Operate-Transfer (BOT) of a new facility. Basically, a private entity structures the public/private finance of a road, airport, or other entity, and then builds and operates the facility for a specified term, typically 20 to 40 years. Title and operation are transferred to the government at little, or no cost upon expiration of the term of the agreement.
Build-Transfer-Operate (BTO) technique. BTO requires a private entity to finance the facility, but title to the facility is transferred to the government upon completion of construction. The private entity then operates the facility for a term of 20 to 40 years to collect all revenues and recoup its investment.
Perpetual Franchise technique. The title, financing, construction, and operation of an entity becomes the primary responsibility of a private firm. The government has oversight controls on safety, quality of construction, and day-to-day service.
TYPE 4: Structure the Public/Private Lease or Partial Disposition of Facilities and Infrastructure. Governments have made an enormous investment in public facilities and infrastructure. The management and operation of these investments is complex. Owning, and especially operating, this wide array of facilities and infrastructure, may not always be the most appropriate means for a government to meet the needs of residents. Public/private partnerships can be structured in a manner whereby the government retains ownership, or at a minimum, maintains a comfortable level of oversight control without being burdened with all of the costs, risks, and responsibilities traditionally required of an owner and operator.
Investments in stadiums, arenas, theaters, garages, and other revenue-generating facilities can be very attractive to the private sector. Governments can recognize an economic return from these valuable assets by structuring long-term lease agreements, or partial dispositions, in which the private sector is responsible for the day-to-day operation of the facility. Governments receive an up-front cash payment and a negotiated portion of the net or gross revenues. Governments also benefit from the interest income from the initial payment, plus the enhanced future revenue stream while maintaining partial ownership and quality control.
Governments should also capitalize on the privatization breakthroughs contained in passage of the Intermodel Surface Transportation Efficiency Act (ISTEA) in 1992.
TYPE 5: Enhance the Economic Performance of Existing Government-Owned and Operated Facilities. There are a number of ways to improve the economic performance of government-owned and operated facilities. Increasing or implementing user-fees, establishing or expanding concessions, or joint-development opportunities can increase revenues and/or reduce expenses.
TYPE 6: Introduce Competition into Public Services. The cost of government operations and services, as well as compensation for public employees, has grown at a faster rate than the private market. Yet the quality and scope of public services has sometimes decreased. Government officials need to remember three important points: 1) services are tax-supported; 2) delivery of services should be as effective and efficient as the competitive private market where taxpayers live and work; and 3) the services provided should be customer-driven.
Governments have considerable flexibility in structuring privatization plans for services, because at least seven privatization techniques apply to services:
Contracting Out. Governments structure a contract with private companies, or nonprofit organizations for the delivery of services, or government supplies.
Intergovernmental Agreements. One government agrees to pay another government to provide a service, or a government unit is designated to provide a service to several governments within a region.
Vouchers. The government pays for the service, however, the user, or consumer of the service can freely select producers in the marketplace.
Grants. Grants are a form of government subsidy to a private entity producing the product, or service. The primary objective is to reduce the retail price of services for participating consumers.
Franchise. The government structures the contract, but the user pays the private company for goods or services such as infrastructure, utilities, telephone service, and cable television.
Self-help. Small community organizations and charitable groups perform public services on a voluntary basis. Examples: street cleaning, neighborhood security, social services, recreational programs, and volunteer fire departments.
Load Shedding. Government discontinues providing a service and lets the private sector take over the function.
TYPE 7: Streamline Government Organization and Restructure Selected Administrative Groups and Agencies. Governments can benefit from establishing clear and distinct responsibilities for each of their administrative groups and agencies. Often several agencies have overlapping responsibilities that lead to inefficiencies. By restructuring the management and responsibilities of these agencies and groups, government can realize substantial cost savings and increase efficiency, as well as short- and long-term effectiveness.
TYPE 8: Enhance Cash Management and Restructure Debt. Cash management is exactly what it sounds like--governments seeking to increase their access to cash from their financial claims and maximize their income on that cash.
The objectives for cash management are: 1) to collect the cash as fast as possible; 2) to disburse the cash as slowly as possible; and 3) to maximize income from the idle cash. Privatization opportunities for cash management typically focus on collection procedures, accounts-payable systems, and investment programs.
For debt, the primary focus is to explore any opportunities for government to capitalize on restructuring debt. This could include benefits such as reducing the cost of financing, and maximizing the paydown of principal on selected investments.
TYPE 9: Structure the Disposition of Government-Owned Companies. Many government-owned enterprises, or companies, are attractive privatization candidates. If the private sector acquires a government-owned enterprise, the government usually benefits from a large cash infusion, as well as added corporate and property taxes.
In some situations a sale or disposition eliminates the government's need to support enterprises that have operating deficits. In these situations, a sale or disposition should be viewed as an expense reduction rather than a revenue source.
When selling a government-owned enterprise, it is imperative that the government's actual cost of operation be quantified. Frequently, the full costs associated with security, vehicle maintenance, and administrative support are not reflected in an enterprises' operating budget. Conversely, in many situations the revenue generated by an enterprise is understated in the operating budget.
The primary objective of this phase is to uncover privatization opportunities on a government-wide basis. There are three main steps in this phase.
1. Assemble and Organize Data.
2. Establish Criteria to Qualify Each Privatization Opportunity.
3. Apply Privatization Techniques to a Whole Range of Government Services and Facilities.
STEP 1: Assemble and Organize Data. The more that is known about the government services and facilities, the greater the number of privatization opportunities. Data will include such items as:
Current Financial Report,
Capital Improvement Program (CIP);
Existing legislation, regulations, and procurement laws, which may be constraints or opportunities for privatization. This type of data would address: public employees, contracting out, financing capital improvements, etc;
Facility Master Plans or Urban Development Plans;
Current major contracts with private operators, concessionaires, and management companies;
Any information on prior privatization transactions or nontraditional financing;
Current Costs for Providing Services; and
Revenue and Expenditures for Major Facilities.
The type of data relevant will be somewhat dependent on the sponsoring government's goals and objectives for the privatization program.
STEP 2: Establish Criteria to Qualify Each Privatization Opportunity. This criteria, jointly established by the sponsoring government and their advisor, will also be used later in evaluating and implementing privatization opportunities. The number and type of criteria used will reflect the government's needs and objectives. The total number of criteria typically ranges from 25 to 50.
The criteria will be used in this phase to qualify or ensure that each privatization opportunity included in the "menu of privatization opportunities" generally meets the government's specific needs. Once the privatization opportunities are identified, these criteria are used later to more thoroughly evaluate each privatization opportunity.
The evaluation criteria are generally organized into eight to ten generic categories. They would in reality be specifically tailored to reflect the government's goals for the privatization program. The criteria generally fall under categories such as:
Characteristic of Privatization Opportunities (project scope, cost, level of risk, complexity of deal structure, etc.);
Economic Return/Cost Savings (annualized and term);
Public/Private Finance (source, technique, and instrument);
Implementation (management issues and approval s);
Impact on Public and Private Groups (intergovernmental, unions, media, etc.);
Schedule Requirements;
Anticipated Problems.
STEP 3: Apply Privatization Techniques to a Whole Range of Government Services and Facilities. By applying one or more of the privatization techniques identified earlier to government assets, facilities, infrastructure, services, government-owned companies, facility operations, and other selected government activities, a government-wide privatization program yields 100 to 200 privatization opportunities. Consequently, there is a menu of privatization opportunities from which governments select privatization projects for further development and/or implementation. A detailed example of how several privatization options can be generated by applying a variety of techniques to a single facility is described in the appendix.
The opportunities comprise a wide range of characteristics, such as:
small to large project scopes;
low to high levels of risk;
immediate to lengthy implementation schedules; and
varying equity/debt ratio requirements.
Once privatization opportunities are identified, they must be evaluated in detail to determine whether they should proceed to the implementation phase. Each privatization opportunity is put through exhaustive analyses, such as financial feasibility, legal review and cost/benefit analysis. These analyses will require obtaining additional data. Moreover, each privatization opportunity will be tested against the evaluation criteria established earlier. There are three principal elements in this phase.
1. Analyze the Legislative and Regulatory Constraints.
2. Determine the General Marketability of Each Privatization Opportunity.
3. Develop Deal Structures for Each Privatization Opportunity.
ONE: Analyze the Legislative and Regulatory Constraints. Because privatization is a relatively new tool for governments, most government legislation and regulations are not geared to facilitate the use of privatization. Therefore, early in the privatization process, task forces should identify the potential roadblocks to privatization. Depending on the particular privatization opportunity, or privatization techniques, existing legislation may require modifications. If this step is ignored, or not thoroughly explored, a government could invest time and money to develop privatization opportunities that will eventually be "killed" by existing legislation.
Another reason to explore legislative constraints and opportunities in this phase is that if existing legislation has to be modified, or new legislation introduced, in order to implement a privatization opportunity, the time required for implementing privatization will be substantially longer. If short-term results are expected from a certain privatization opportunity, it needs to be known early on which privatization opportunities, if any, will require the additional time to modify or introduce enabling legislation.
TWO: Determine the General Marketability of Each Privatization Opportunity. Private markets, such as the capital markets, land and building development markets, and sports and entertainment markets are continually changing. The ups and downs of a market will substantially affect the level of interest of private companies in structuring and implementing a public/private partnership with government.
Even if private-sector interest exists, the requirements, or terms of a "deal structure" could be affected by a market change occurring a few weeks or months earlier. Therefore, current insights and access to these markets is important.
If a privatization opportunity involves several markets, companies in one market could be interested but still face new, or more rigorous requirements in another market. A member of the privatization advisory team needs to have a pulse on the anticipated markets.
A prime example of this situation is a city's need for a convention hotel near their convention center in today's market. While a building developer may be interested in working with the city, attracting financing for a hotel could be difficult. This situation is compounded by the financial instability of some hotel operators. Thus, a government could discover that an apparently viable privatization opportunity on paper is actually highly risky and unlikely to be financed. It is best to discover this before the local government has made a sizable investment of time and/or money in the pre-development phase.
THREE: Develop Deal Structures for Each Privatization Opportunity. Alternative privatization plans, or conceptual public/private "deal structures" are developed for each opportunity that has passed up to this stage. These plans illustrate how the government and the private sector would share project responsibilities, costs, risks, and the projected economic return. These alternative plans provide governments with a large amount of flexibility. The alternative privatization plans range from a public/public partnership of two or more governments, to a plan where the private sector takes on nearly 100 percent of the responsibilities, costs, and risk.
The government selects one or all of the alternative privatization plans to be quickly tested for financial feasibility. The surviving alternative(s) would be comprehensively analyzed to cover issues such as:
Marketability;
Sources of Public and Private Finance;
Legal and Regulatory Issues;
Public/Private Financing Instrument(s);
Implementation Schedule; and
Level of Control of Each Party.
Each privatization opportunity is then evaluated against the established 35 to 50 criteria, and ranked from 1 to 10 to provide the government with a sense of how well each opportunity meets their needs and objectives.
The privatization opportunities that receive a high ranking are generally selected to proceed with the preparation of implementation plans. Implementation plans outline the specific steps required to complete the transaction, and typically include:
Detailed Financial Analyses and Valuation(s);
Implementation Schedules;
Specific Responsibilities of Each Party;
Solicitation Processes;
An Evaluation of Private-Sector Proposals;
Negotiation with the Selected Private-Sector Team; and
Preparation of the Required Public/Private Partnership Agreement(s).
Prior to distributing any solicitation, governments need to analyze privatization opportunities from the perspective of the particular private industries required to successfully implement each project. In other words, a government needs to know the answer before they ask the private sector the question.
Loss of control is perceived as one of the foremost implementation problems with privatization. It is also one of the easiest to resolve. Governments can use four methods to deal with this important issue.
METHOD 1: Identify Government Control as a Critically Important Criterion in the Privatization Process. If a government wants to maintain a certain level of control over selected facilities, operations or services, this factor should be weighted heavily when establishing the criteria to qualify and evaluate the privatization opportunities.
METHOD 2: State the Desired Level of Control in the RFP. Government officials should also indicate in the RFP the extent and nature of the control they wish to retain over contracted service provision.
METHOD 3: Document Performance Standards. If the required level of control by the government is marketable and negotiations begin with the selected private company(s), the government needs to develop specific "performance standards" to which the private company(s) will be held in the evaluation of their work.
Performance standards address issues such as:
Quality of Service;
Timeliness of Service and Repairs;
Actual Versus Expected Savings; and
Availability/Access to Government.
A potential problem with developing performance standards is to specify performance requirements that are so specific that they obviate the entire purpose of contracting out. By over-specifying, governments can also kill the interest of private companies in participating in privatization projects or public/private partnerships.
METHOD 4: Additional Control Mechanisms for Governments. Governments should develop and document performance standards and other requirements as if there will be a problem or dispute in the future with the private company selected for each privatization. Governments can specify a rate schedule to cover the cost of government intervention, if the private company fails to perform to the documented standards.
METHOD 5: Performance Bonds. Governments can also demand bid bonds and performance bonds. The objective of the bid bond is to create an incentive for private companies to "close" an agreement. In other words, if the "shortlisted," or selected private company(s) declines the award, it must forfeit the amount of the bid bond. The performance bond goes into action when private companies default in some manner during the term of the contract. Governments should be careful not to set the size of the performance bond too high, because it inhibits the participation of small companies, and could serve as a catalyst for higher consumer costs. The size of the bond should be determined in advance to cover only the cost incurred by government to correct the situation or structure a contract with another company.
METHOD 6: Monitoring Techniques. In order for governments to detect a less-than adequate performance by a private contractor, they will need to establish a system of monitoring and maintaining accurate records. Governments can use a variety of methods to monitor the performance of a contractor. These methods include:
Scheduled On-site Inspections;
Surprise On-site Inspections;
User Surveys;
Complaint Monitoring; and
Periodic Cost Comparisons.
Unless governments retain at least oversight control, and manage the privatization contract, there will always be the danger of losing the advantages of competition, or having a private monopoly evolve.
Privatization efforts face many obstacles, including existing legislation and regulations, public employee resistance, misperceptions about privatization, and a general resistance by governments to change.
Privatization programs, if they are to be successful, must incorporate innovative strategies to overcome obstacles to privatization. These strategies need to be developed and put in place early on in the development of the privatization program. Most of the obstacles can be substantially reduced or eliminated by well-conceived and structured privatization plans and agreements.
Public Employee Opposition. The main obstacle to privatization in cities is likely to be public employee unions. In a 1992 Reason Foundation survey of the 24 largest cities in the United States, public employee unions were cited by more than 80 percent of the cities as a major obstacle to contracting out. In 1988 a survey conducted by the International City/ County Managers Association (ICMA), 40 percent of respondents cited public employee opposition as an impediment to privatization.[23]
Unions primarily focus on three types of problems they believe are created by privatization:
Elimination of Well-paying Public-sector Jobs;
Undermining of Wage and Benefit Standards; and
Decline in Service Quality.
Policymakers must address these concerns in the early stages of designing privatization programs. They can use a number of techniques, for example, to minimize job losses of public-employees.
Attrition. The most common technique for avoiding public employee job loss is to phase in privatization and then rely on yearly attrition of public employees, which averages around 5 percent in most jurisdictions. Early retirement incentives can also be given to workers to reduce the size of the current work force.
First Consideration. Many public employees will go to work for the private firm when a service or facility is privatized. A 1989 nationwide survey by the National Commission on Employment Policy (NCEP) found that 58 percent of public employees went to work for the participating private contractors.[24] If necessary, city governments can encourage or require private contractors to give first consideration to public employees for new positions. In Los Angeles County, bonus points in the bidding process are awarded to contractors who provide public employee accommodation plans.
ESOPs. Another option is to set up mechanisms whereby public employees are encouraged and assisted in taking their departments private and providing the public service themselves. Employees could set up Employee Stock Ownership Plans (ESOPs) and operate the public services as private enterprises. Employee buy-outs of government enterprises and services have been widely employed in Britain.
Noncompetitive Public-Employee Wages and Benefits. Public employees strongly oppose privatization because they believe that private firms pay lower salaries and provide less fringe benefits than public agencies. Although there are important exceptions, most research on this subject has demonstrated that wages and benefits paid by public agencies are higher than private contractors in most cases, depending in part on job category. In many social services, however, private wages are typically higher than public-sector wages.
Higher pay in some public-sector job categories results largely from the lack of competition in labor prices in public employment, rather than rock-bottom pay from private contractors. Public-sector compensation tends to be determined on the basis of administrative and political factors, rather than on prevailing rates in the competitive market.[25] If public-sector wages had just kept pace with private-sector wages, state and local governments could have reduced employment costs by $39 billion in 1989 alone.[26]
Service Quality. Some cities also argue that privatization causes an erosion in service quality. Again, the evidence indicates that generally this is not the case. In a 1992 Survey on State Government Privatization conducted by Apogee Research and sponsored by the National Association of State Comptrollers, "Higher Quality Services" was ranked near the top of the "Advantages of Privatization." Only "Capital Cost Savings" and "Operating Cost Savings" were ranked higher. In a 1980 survey of 89 municipalities, 63 percent of public officials reported that contracting out resulted in better services.[27]
Comprehensive privatization programs offer city governments a means to maximize revenue, cut costs, and make greater use of private capital for public services and facilities.
The traditional methods of solving budget crises such as tax increases, deep service cuts, or issuing short-ten-n debt have significant economic or political pitfalls.
Comprehensive programs offer three main advantages over traditional governing strategies. First, they afford governments great flexibility by allowing officials to choose between a variety of privatization techniques for each government-owned asset, facility operation, service, debt structure, and needed facility and infrastructure.
Second, the cumulative economic impact of implementing all, or some portion of, the menu of privatization opportunities is potentially much greater and longer lasting than short-term fixes such as tax increases or bond offerings.
Finally, if governments properly manage the privatization process and carefully monitor the implemented privatization projects. government spending can be held in check.
John Stainback is President and CEO of Privatization For America, Inc. (PFA), a privatization advisory firm based in Houston, Texas. After seven years in the privatization industry, Mr. Stainback has structured public/private finance and development plans for facilities and infrastructure valued at $4.2 billion. In addition, the "added value" generated by the Comprehensive Privatization Programs he has completed to date is conservatively estimated at several billion dollars. He is a Vice President of The Privatization Council's Board of Directors, and holds a Master of City Planning and Master of Architecture from the University of Pennsylvania (PENN), and a Bachelor of Architecture and Bachelor of Arts from the University of Maryland.
An Example of the Privatization Opportunities Generated for One Facility
An example of how a combination of the nine types of privatization can be applied to one facility will begin to reveal the power of a city-wide privatization program. A city-owned and operated civic arena would be one facility among a multitude of facilities included in the city's responsibility of owning and operating public facilities and infrastructure. Five of the nine types of privatization could be used on this single facility, and they could be implemented in this sequence, or grouped:
Enhance the economic performance of the arena by tapping most, if not all, of the 28 sources of revenue, which are possible for this type of facility. (Type 5)
Structure the arena's public services to be competitive. (Type 6)
Transfer the management of the arena to a private operator. (Type 1)
Depending on such factors as how the arena was financed, and the balance of the principal debt, the remaining debt could be restructured. (Type 8)
Structure a disposition plan for the arena to offer it to the private sector on the basis of an outright sale, or long-ten-n lease-acquisition. The latter would allow the government to retain ownership. (Type 4)
Privatization of the civic arena alone generates five privatization opportunities. To further illustrate why so many privatization opportunities evolve from a comprehensive privatization process, assume a government owns and operates ten facilities, and on average only two of the nine types of privatization are applicable, the number of privatization opportunities generated is 20.
Comprehensive Privatization Programs should be designed around these privatization methods. Often the combination of methods further enhances the results. For example, on an engagement involving the sale of sports and entertainment facilities, it is recommended that government first enhance the economic performance of its facilities (privatization Type 5) and transfer operations to a private management company (Type 1) prior to structuring the sale of these government-owned assets (Type 9). The increase in the sale price resulting from these sequential privatization actions will likely exceed the estimated proceeds from the disposition of the facility on an as-is basis.
The Comprehensive Privatization Program for the City of Philadelphia
In 1992, the author designed a comprehensive privatization plan for the city of Philadelphia. The primary objective of the plan was to generate non-tax revenue and reduce the cost of government. The city could not support its $2.1 billion budget and taxes could not be increased without causing a furor. The citizens of Philadelphia are taxed at one of the highest rates in the nation. These problems were compounded by the fact that the city had recently experienced difficulty in securing debt financing.
During the first step of the CPP process, 35 evaluation criteria were identified, in conjunction with the city, and used as a means to qualify the privatization opportunities. Applying nine types of privatization to the city's real estate assets, existing facilities, transit and bus systems, and city-operated facilities and services, 71 privatization opportunities were identified. The wide array of privatization opportunities included projects small and large in scope, and projects which could be implemented in time to affect the city's bottom line prior to the end of the fiscal year.
In conjunction with city officials, twenty of the most viable privatization opportunities were selected for further financial analysis and refinement of each of the proposed privatization plans. Some of the more important criteria used to select the twenty projects included:
Projected Economic Return;
Marketability (the anticipated level of interest of the private sector);
Cost of Implementation;
Schedule Required to Implement; and
Level of Sensitivity of Various Public and Private Groups.
Drawing on the results of the comprehensive analyses of each privatization opportunity, five of the twenty opportunities were recommended for priority implementation. The final step of the comprehensive privatization program was to prepare detailed implementation plans for each of the priority projects.
The five privatization projects recommended for priority implementation and the estimated proceeds to the city were:
n Philadelphia International Airport — $490 million. It was recommended the city establish an airport authority and enhance the economic performance of the airport, then transfer the operation of the airport to a private management company. After the true annual income stream was determined, it would then be the appropriate time to structure the disposition of the airport to the private sector.
n Philadelphia Gas Works — $400 million. It was recommended that the city structure the disposition of this city-owned and operated company. Three different methods of valuation were used to determine the value of this asset.
n Veterans Stadium — $153 million. At the time the privatization program was being prepared, the owners of the Philadelphia Phillies were proposing to purchase the stadium. Our team recommended, since the stadium was currently underperforming asset, to stop negotiations and proceed with a three-phase privatization plan. The first-phase plan included ways to enhance the economic performance of the stadium. In the second phase, a solicitation would be distributed to private operators to manage the stadium. In the third phase, a solicitation would be distributed to the private sector for competitive offers to acquire the facility.
n Real Estate Asset Management Board — $125 million. The city owns over 10,000 properties valued at $2.4 billion. It was recommended to establish a management group to proactively manage these assets and dispose of at least 5 percent of the properties, which would generate $120 million, and an additional $5 million annually by placing the selected properties back on the tax roll.
n Philadelphia Computing Center — $2 million. It was recommended to introduce competition into the operation of this facility, which had become a government monopoly.
The total value of these five privatizations is $1.2 billion.
The total amount of non-tax and tax revenue, and cost savings, which the city could realize from implementing all 71 of the privatization opportunities is difficult to assess, but a conservative estimate would be $3 to $5 billion over the next 3 to 5 years.
1. U.S. Bureau of the Census, City Government Finances, 1960 and 1990.
2. Ibid.
3. Wendell Cox and Samuel A. Brunelli, "The Untold Story: The Rapid Growth in City Revenues," American Legislative Exchange Council, The State Factor, 18, (August 1992), p. 3.
4. Commerce Clearing House, Chicago, Ill., October 1992.
5. U.S. Bureau of the Census, City Employment, 1960 and 1990.
6. Ibid.
7. "Why They Raise Taxes," The Wall Street Journal, December 10, 1992.
8. Wendell Cox and Samuel A. Brunelli, "America's Protected Class H: The Widening Public/ Private Pay Gap," Chapter Draft from Saving the States, American Legislative Exchange Council, August 1992.
9. Number of paid holidays available to eligible employees. Data from United States Department of Labor, Bureau of Labor Statistics, "Employee Benefits in State and Local Governments Address Family Concerns," News (Washington D.C.: October 31, 1991); United States Department of Labor, Bureau of Labor Statistics, "Employee Benefits Focus on Family Concerns," News (Washington D.C.: March 30, 1990); and United States Department of Labor, Bureau of Labor Statistics, "BLS Reports on its First Survey of Employee Benefits in Small Private Establishments," News (Washington D.C.: June 10, 1991).
10. Ibid.
11. United States Department of Commerce, Bureau of Economic Analysis, "The National Income and Product Accounts of the United States: 1929fl982," Statistical Tables (NIPA Historical Tables), (Washington: September, 1986) and "National Income and Product Accounts," NIPA 1989.
12. National League of Cities, Nation's Cities Weekly, July 20, 1992, p. 8.
13. "Environmental Legislation: The Increasing Costs of Regulatory Compliance to the City of Columbus," report of the Environmental Law Review Committee, City of Columbus (Ohio), May 13, 1991.
14. Census Figures, op. cit.
15. Ibid.
16. Nation's Cities Weekly, op. cit., p. 4.
17. The United States Conference of Mayors, "City Fiscal Conditions 1980ç1990: A 50-City Survey," (Washington D.C.: January 1991).
18. Cox and Brunelli, August 1992, op. cit., p. 11-13.
19. "The Untold Story: The Rapid Growth in City Revenues," op. cit., p. 11-16.
20. Tax Foundation, (Washington D.C.).
21. The outlines of this Comprehensive Privatization Program (CPP) were developed by the author in 1989.
22. John Hilke, Competition in Government-Financed Services (Westport, Conn.: Greenwood Publishing Group, Inc., 1991).
23. I.T. David, "Privatization in America," Municipal Yearbook, International City Management Association, Washington, D.C., 1988.
24. "The Long Term Employment Implications of Privatization: Evidence from Selected U.S. Cities and Counties," National Commission on Employment Policy, Washington D.C., March 1989.
25. Wendell Cox and Samuel A. Brunelli, "America's Protected Class: Why Excess Public Employee Compensation is Bankrupting the States," American Legislative Exchange Council, The State Factor, 18, No. 3.
26. "The Public Water Pay Trough," Investor's Business Daily, March 27, 1992.
27. P.S. Florestano and S.B. Gordon, "Public vs. Private: Small Government Contracting with the Private Sector," Public Administration Review, No. 40, 1980, p. 29-34.