(A version of the following commentary by Mackinac Center Adjunct Scholar Mark J. Perry was published on May 31, 2005 in USA Today. The graphs that accompany the piece were supplied independently by the author.)
If you’re like most Americans, you have probably found yourself complaining lately about the high price of gasoline — especially if you just spent a day or two in the car over Memorial Day weekend. A USA TODAY/CNN/Gallup Poll in May found that 59 percent of those surveyed said high gas prices had caused hardship for them. You might even find yourself longing for the good old days of cheap gas.
If so, think again. Gas prices today, by any measure that adjusts for inflation and rising real income, are a bargain.
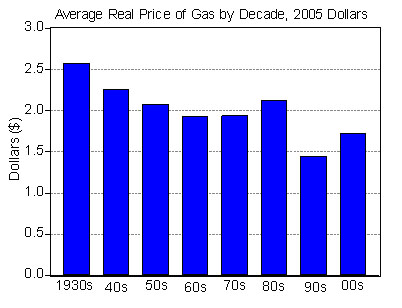
Gas prices appear to be at a historical high, and prices of the past appear to be cheap (17 cents per gallon in the 1930s, a quarter in the 1950s and 50 cents in the 1970s). But this is a classic example of "money illusion." In real inflation-adjusted dollars, gas prices are the same or lower today than in most previous decades.
Measured in real dollars, gas prices peaked in March 1981 at more than $3 per gallon. We have not even come close to paying the highest real gas price in history — today's prices are still 30 percent below the all-time high.
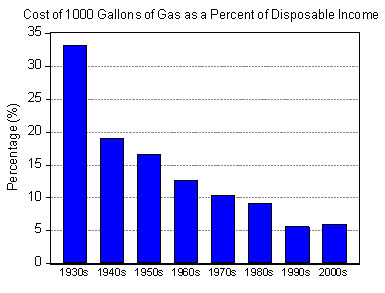
We can compare gas prices over time by calculating the cost of 1,000 gallons of gas purchased at the average price in a given year as a percentage of per-capita disposable income in that year. For example, in 1935, when gas prices were 17 cents per gallon and annual disposable income was $466, the cost of 1,000 gallons of gas was 36 percent of average disposable income. Today, it takes less than 7 percent of our disposable income to buy 1,000 gallons of gas at the current U.S. average price of $2.10 per gallon. The "cheap" gas of the ‘60s and ‘70s cost about 12 percent as a share of income.
Gas prices since the mid-1980s have not only been more affordable as a share of income than at any other time, they also have been remarkably stable. The recent small increase in gas prices relative to income is fairly insignificant.
Further, we can avoid the money illusion by pricing gas in "minutes of work at the average wage per gallon of gas," instead of dollars per gallon. Priced in minutes per gallon, you certainly wouldn’t be longing for yesteryear’s gas prices.
A typical American working today at the average hourly wage of $17.50 works about seven minutes to buy a gallon of gas for $2.10. In contrast, the average worker in the 1930s labored more than 20 minutes to buy a gallon of gas. During the 1940s, it fell to 12 minutes of work. During the 1950s, it took about 10 minutes per gallon.
Americans are paying about the same for gas in minutes per gallon today — 7.2 minutes — as during the 1970s, when the retail price was only 40 cents per gallon, and we are paying much less than during the early 1980s, when real gas prices peaked and the average worker toiled for more than 10 minutes per gallon.
Finally, consider the consumers in most other countries. With the exception of members of the Organization of Petroleum Exporting Countries, such as Iran, U.S. gas prices are lower than almost anywhere in the world.
Go to Europe and you’ll pay from $5 to $7 per gallon — even in Finland and the United Kingdom, which are major oil producers and exporters. In Mexico, the world’s fourth-largest oil producer, they pay $3.20 per gallon, about the same as in India, Brazil and Singapore.
Consumers might have a lot to justifiably complain about, but the illusory high price of gas is not one of them. The good old days of cheap U.S. gas are here now.
#####
Mark J. Perry is a professor of finance and economics at the University of Michigan-Flint and an adjunct scholar with the Mackinac Center for Public Policy, a research and educational institute headquartered in Midland, Mich. Permission to reprint in whole or in part is hereby granted, provided that the author and the Center are properly cited.
The Mackinac Center for Public Policy is a nonprofit research and educational institute that advances the principles of free markets and limited government. Through our research and education programs, we challenge government overreach and advocate for a free-market approach to public policy that frees people to realize their potential and dreams.
Please consider contributing to our work to advance a freer and more prosperous state.