The November 1992 general election in Michigan included two propositions regarding property taxes, Proposals A and C. This evaluation presents a detailed analysis of them, including projections for state and local government revenues. Widely cited in the press when released, it remains a useful guide to Michigan's property tax structure. The report makes a strong case that Michigan, which has the second highest property tax burden among twelve Midwestern states, sorely needs a property tax cut to spur economic growth and to stem the exodus of business from the state. 44 pages.
This introduction discusses and explains the existing property tax system in Michigan, in the following sections:
Michigan's Property Tax Burden;
Tax Reduction and the Michigan Economy
Your Property Tax Bill Explained; and
The "Headlee" Amendment.
Readers who are familiar with these topics may wish to skip ahead to the following chapters and appendices.
Michigan taxpayers will pay over $9 billion in property taxes in 1992 – more than the sales tax and income tax combined. Almost 70% of property tax revenues go to local public school districts, with the rest split between cities, townships, counties, community colleges, and other local authorities.[1]
By any measure, Michigan's property tax burden is much higher than the national average. While the exact ranking among the 50 states varies with the year and the measure, Michigan consistently ranks in the top 15 states for property tax burdens on their citizens.
A recent survey by the Senate Fiscal Agency recorded Michigan's property tax burden on two important scales.[2]
Property Taxes per $1,000 of Personal Income: This measure, from the U.S. Census Bureau, is probably the best measure of the relative burden of taxes. In fiscal year 1990, Michigan ranked 10th among the 50 states with $47.09 in property taxes per $ 1,000 of personal income The national (50-state) average was $35.62. Michigan's high burden also placed it second among the 12 Midwestern states.
Property Tax Effort Index: This sophisticated measure developed by the Advisory Commission on Intergovernmental Relations takes into account the tax revenue raised and the value of property that is taxed. For 1988 (the latest year available), Michigan's index of 157 was the second highest among the SO states, which had an average index of 100.
The Senate Fiscal Agency study also notes that Michigan's property tax burden would still rank among the top 15 on both these scales if "Homestead" income tax credits were assumed to reduce the property tax burden.[3] Other studies have also shown Michigan's property tax burden to be much higher than the national average.[4]
Since property taxes are almost entirely local taxes in Michigan, this high state average includes communities with more reasonable burdens, as well as those with stratospheric property tax rates. In particular, Detroit was rated the city with the highest property tax burden on a typical family among the largest cities in all SO states and the District of Columbia.[5]
In addition to high property taxes, Michigan has consistently endured a much higher overall state-and-local tax burden than most other states. The income, business, and property taxes are significantly higher in Michigan than in most other states, while the sales tax is somewhat lower.[6] However, Michigan's total state-and-local tax burden, while still above the national average, has recently become much closer to the average of the other states, for two reasons: First, other states have raised taxes, while Michigan has not; and second, Michigan's economy has not grown as rapidly as other states, and therefore has not generated the same increase in tax revenue.
For almost a half century following the beginning of the Great Depression, Michigan enjoyed per-capita income above the national average. Beginning in the early 1980's, our per capita income dropped to and below the national average, where it stands today. This decline in relative economic strength came on the heels of a dramatic increase in state and local tax burdens beginning in the 1960's.
Both economic theory and common sense hold that Michigan's high tax burden depresses economic growth by reducing the disposable income available to consumers, and discouraging entrepreneurs from locating in the state.[7] Research beginning in the late 1970's,and continuing into this decade, has confirmed that high tax burdens are associated with slower job growth, more unemployment, less attraction of new businesses, and income stagnation. These studies also confirm that reducing tax burdens powerfully improves the economic prospects of a state.[8]
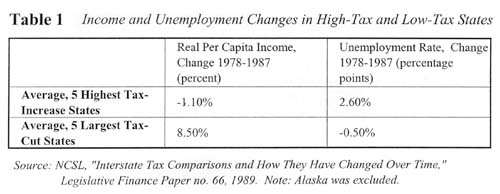
For example, the five states that raised taxes the most between 1978and 1987 saw real per-capita income fall by an average 1.1%, while the five states that reduced taxes the most saw real per-capita income increase by an average8.5%. The five "tax increase" states saw their unemployment rates increase by an average2.6%, while the five "tax cut" states enjoyed a decline in their unemployment rates of an average 0.5%.[9] See Table One.
Two states in the "tax cut" group, California and Massachusetts, began the decade under study with major property tax cuts – "Proposition 13" in California, and "Proposition 2 1/2" in Massachusetts. Both states saw dramatic economic growth following the tax cut, as evidenced by the results in the table. However, by the end of the 1980's or beginning of the 1990's, both had reversed fiscal policy, and substantially increased taxes. Subsequently, both experienced economic and budgetary distress. This is a clear lesson for Michigan: An industrial state can significantly improve its economy with a tax cut, or it can depress its economy with tax increases.
The property tax bill on each parcel is the product of three factors:
Property tax bill = "True Cash Value" of parcel x Assessment Ratio x Total Millage Rate.
Each of these factors is discussed below.
Assessments
Property taxes are ad valorem taxes, or taxes levied on the value of an asset. Thus, assessing the value of property is just as important in determining the property tax bill as the millage rate.
Market value, called true cash value in the Michigan Constitution, is the value of a parcel of property at a normal sale. Since parcels do not sell every year, their value must be estimated using some method, other than reviewing a sale price.[10] These estimates, or assessments, are made by local tax assessors employed by local governments.
The assessments of all property in each jurisdiction are then collected, and adjusted or equalized by the counties and finally by the State Tax Commission. Equalization ensures that local assessors do not under-assess their parcels, in the hopes of passing off some of the tax burden on other areas within the same taxing jurisdiction. Normally, this happens in the background with little input notice or input from the taxpayer. After local assessments have been equalized by the State Tax Commission, the values given to property are known as State Equalized Value (SEV). This SEV, or a preliminary estimate of SEV, appears on a notice issued in the spring of each year to property owners.
The assessment and equalization processes are intrinsically inaccurate, and inequities and abuses are common.
Assessment Ratio
The SEV of a parcel of property should be about half the actual market value. This ratio is known as the assessment ratio, or the portion of the value of property on which taxes are paid. The Constitution sets the assessment ratio at no more than 50%, and the Michigan Legislature, in the General Property Tax Act, set the ratio at the maximum 50%.
At the current assessment ratio of 50%, a home with a true cash value of $100,000 should be given an assessment or SEV of $50,000. A millage rate of 57 (about the current statewide average) would produce the following property tax bill:
$100,000 x .50 x 57/1000 = $2,850.00.
Millage Rates
A mill is a rate of 1/1000. In the equation above, a millage rate of 57 mills is expressed as 57/1000, and multiplied by the assessed value of $50,000.
Millage rates are levied by schools (about 70% of total millage), counties (11%), cities (15%) and other authorities. The Constitution sets a 50-mill limit on property tax rates, but exempts voted for generalobligation debt millage, cities, and certain other chartered authorities from the limit.[11] Thus, most urban and many suburban areas levy substantially more than 50 mills, and the statewide average now totals about 57 mills.[12]
Article IX section 31 of the Constitution, added as part of the "Headlee" Tax Limitation Amendment of 1978, limits the tax revenue increase that results solely from increases in assessments. Should the value of property, excluding any increase due to new construction, increase faster than the rate of inflation, the excess growth requires a proportionate reduction in the maximum authorized millage rate. This mechanism keeps the property tax bill for the entire taxing jurisdiction growing at about the "real" rate of growth in the district.[13]
Proposal A. placed on the ballot by House Joint Resolution H ("HJR H"), would establish separate tax limitations for different classes of property, and limit annual assessment increases on certain parcels until sold. It would initially result in slightly higher property taxes, and would ultimately -result in higher taxes on some parcels and lower taxes on others.
HJR H has two main provisions, and one special provision:
Limit annual assessment increases on "homestead" (principal residence) parcels to 5% or the rate of inflation, whichever is less, until sold;
Apply the current Headlee amendment limitations on tax increases caused by assessment growth separately by two classes, (residential & agricultural, and all other), resulting in two separate millage rates; and
In 1993, allow property taxes to increase because of assessment growth up to the rate of inflation for the past two years: rather than the one year allowed by the current Headlee amendment; resulting in higher tax rates in many areas of the state.
HJR H would create a hugely confusing array of property tax rates; with two millage rates – one for residential and agricultural property, and another for all other property – for each current millage rate. In most cases, the rate for residential and agricultural property would be equal or higher than the other rate, which would fall mostly on business property.
Property taxes would be initially slightly higher under HJR H than under current law, and might eventually become slightly lower. However, since HJR H could allow citizens or public officials to increase property taxes on business property alone, it might result in higher total property taxes over the long run.
While apparently motivated by a desire to protect homeowners from bearing an unfair burden of property taxation, HJR H's two main provisions work directly against each other. It would ultimately create three classes of property, each facing a different combination of valuation method and milIage rates. Some property owners would pay higher taxes than under the current constitution; others would pay lower, with little rhyme or reason why. In addition; HJR H would create great uncertainty about enforcement of other constitutional provisions, such as the millage limits in Article IX Section 6. Finally, its unequal taxation of similar parcels may not pass federal constitutional scrutiny.
HJR H, passed by the House and Senate on the 18th of April, 1991, placed on the 1992 general election ballot a constitutional amendment that would accomplish the following:
Provide an exception to
the "uniformity clause" in Article IX, section 3, which currently requires that
the legislature provide for "uniform general ad valorem taxation."
Under the exception, the
state equalized value of "each parcel of homestead property" would not increase
each year by more than the rate of inflation or five percent, whichever is less,
unless the parcel is sold. "Homestead" is currently defined in the income tax
code as, generally, an owner-occupied or rented dwelling.[14] This provision
would effectively change the method of assessing homestead property from a
market-value system to an acquisition-value system.
Modify the current
limitation on property tax increases caused by assessment growth.
The constitution currently limits tax increases caused by assessment growth on existing property to no more than the rate of inflation over the past
year. Assessment increases greater than the rate of inflation force a
reduction in the millage rate, so the total tax bill on existing property grows
only at the rate of inflation. The reduction in the millage rate is known as a "Headlee
rollback."
The proposal would modify
this such that:
(i) In 1993, the allowable
increase in property tax revenue would be the "combined increase in the general
price level in 1991 and 1992;" and
(ii) Beginning in 1993, the
"Headlee rollback" calculation would be done separately for two categories of
property: residential and agricultural, and all other classes, resulting in two
separate millage rates.
The complete text of the
proposal is contained in Appendix V.
Uniformity Clause Exception
HJR H would create an exception to one of the most important and enduring principles in property taxation: uniformity. This exception will allow different taxation rates to emerge, for two reasons:
Limitation on annual
assessment increases on homestead property.
Since the assessed
valuation of "homestead" parcels could not increase more than the rate of
inflation or 5%, whichever is less, the SEV of many of these parcels would lag
behind 50% of the market value, until they are sold.
The unusual nature of HJR H
stems from its combination of an assessment growth cap on some parcels with a
split "Headlee" millage rollback. The pros and cons of an assessment growth cap
alone are discussed in the section on Cut and Cap, page 19.
Split "Headlee"
rollback calculations
Under the "Headlee"
amendment, if the assessed value of one class of property grows at the rate of
inflation, and that of another grows faster, the millage rate on the latter
class alone will be rolled back. This will create two millage rates for each
current millage authorization.
Since "homestead"
assessment growth is capped, the class including homesteads will often show a
slower rate of growth in value. This will result in fewer and smaller rollbacks
for residential and agricultural property.
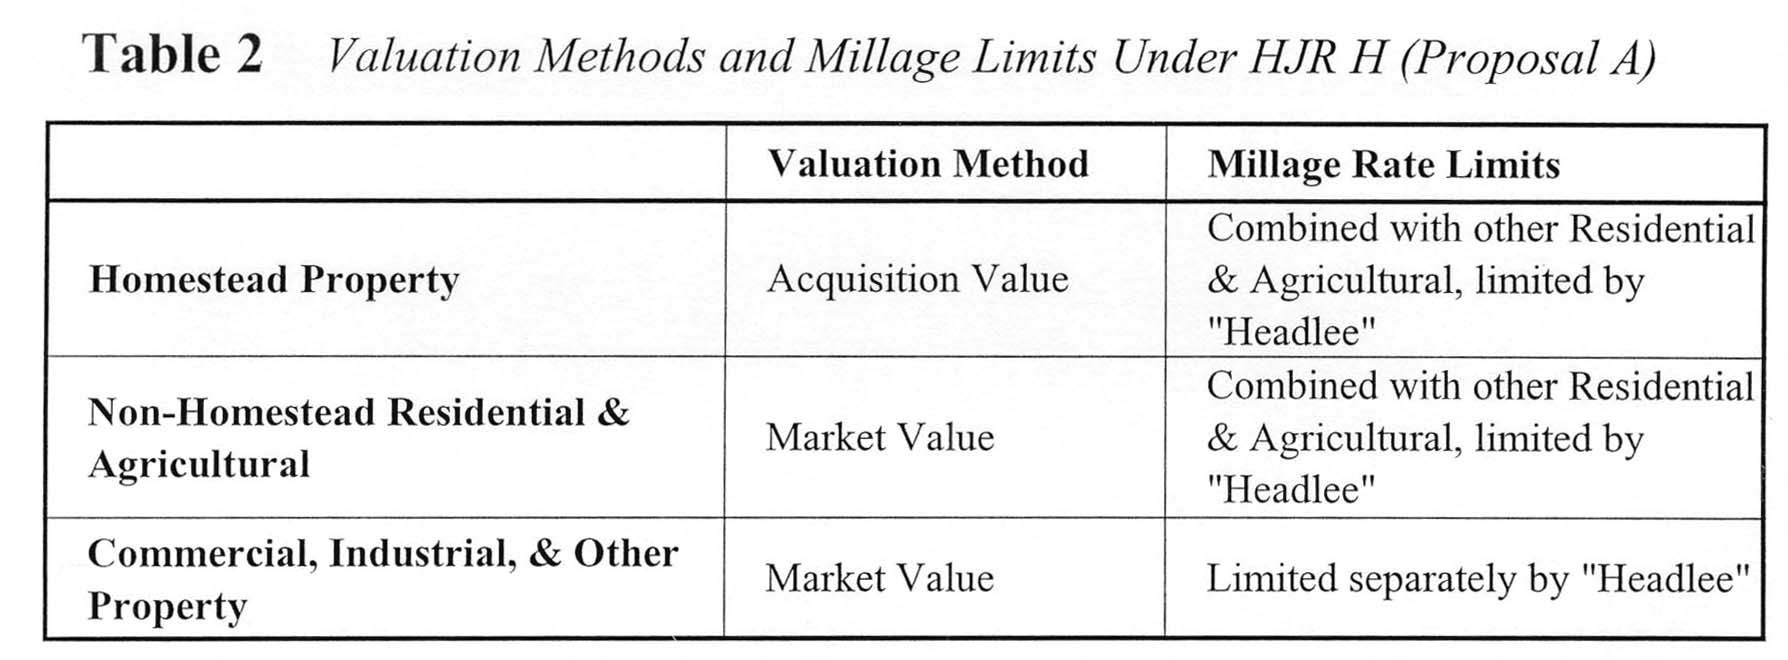
HJR H Creates Three Classes of Property
HJR H would actually create three classes of property:
Homestead property;
Non-homestead Residential and Agricultural property; and
Other property, including Commercial, Industrial, Timber-Cutover, and Developmental. Commercial and Industrial property would comprise the majority of these classes, and they are often lumped together as "business" property. [15]
Each of these would face a different combination of valuation methods and millage rate limits. See Table Two.
Split-Headlee Rollbacks vs. Homestead Assessment Cap
One of the primary motivations for HJR H was to protect homeowners from assessment increases that, some felt, would often be larger than those on commercial and industrial property. The drafters inserted two elements to ameliorate this: an assessment growth cap on homesteads only, and Headlee rollbacks by class. Unfortunately, the two elements work directly against each other, and would often result in the very group HJR H is designed to protect – homeowners – paying higher millage rates!
This occurs because the Headlee rollback provisions of Article IX Section 31 of the Constitution depend directly on the SEV calculated according to Article IX Section 3. Since HJR H would amend section 3 to limit the SEV growth on homesteads, the residential and agricultural class will appear to have slower SEV growth than actually occurred. Thus, when calculating the required rollbacks in millage rates for the two classes, "business" property would often show higher SEV growth, and therefore would have millage rates reduced by the Headlee amendment. However, residential and agricultural property, of which the majority will often be homestead parcels, would have SEV growth artificially capped, and hence would see fewer and smaller Headlee rollbacks.
The results in different communities would vary widely, and would depend on the difference between the actual inflation rate and the arbitrary 5% growth cap contained in RJR H. If inflation – and therefore the expected increases in property values – was higher than 5%, millage rates on "business" property would trend below that of residential and agricultural property in many communities.
Interaction with Millage Limits
HJR H would not change the Constitution's limits on property tax millage, but would open the door to significant mischief with the limits.
Under HJR H, different classes of property would face different millage rates. Article IX Section 6 limits "the total amount of general ad valorem taxes imposed on real and tangible personal property for all purposes" to certain limits, notably the 50-mill limit for counties, townships, and school districts. The section further allows separate limits for charter authorities, and exempts voter-approved debt millage. Under HJR H, the multiplicity of millage rates would complicate the limit calculation. With probably two millage rates for every level of government, how do you add them up?[16]
The Constitution clearly attempts to limit the highest possible sum of millage rates, and the best interpretation would be the same under HJR H.[17] However, HJR H would admit the possibility of imaginative ways to exceed the limit, by creatively adding up millage rates.
Tax Increases on One Class of Property
Although the proposal does not state so explicitly, the HJR H could allow increases in millage rates on one class of property alone. Such a single-class tax increase – impossible under the current constitution's uniformity requirement – could come about through a variety of ways:
Split "Headlee" Rollup
Should millage rates have been previously rolled back on one class, but remain at their voted rates for another, local governments could perform a "Headlee rollup" on just the rolled-back class.
For example, assume a voted school millage rate of 35 mills. Under HJR H, if inflation is 5%, and "business" property grows at 8% for three years, the "Headlee" rollback would reduce its maximum rate to about 32 mills. If the SEV of residential and agricultural property grew at or below 5% – homesteads are limited to 5% annual assessment growth unless sold – they would receive no rollback. This would result in a millage rate of 32 for "business" property, and 35 for residential.
However, if in the following year assessments for all classes did not grow, and inflation was above 9%, the school board could directly increase millage rates on just the "business" property through a simple vote of the board.[18]
Increase by Equalization
If a county or state equalization board were to determine that a jurisdiction's assessments were too low, and order an increase in the SEV for the whole jurisdiction, such an increase could fall only on non-homestead property.
For example, assume that a jurisdiction had its homestead parcels all increase at the maximum 5%, and calculated the Headlee rollbacks based on these figures. Subsequently, the county or state equalization board orders the jurisdiction to increase its SEV through a simple factor of say, 1%. However, since the Constitution (as amended by HJR H) would override the equalization statute, the increased factor could only be applied to non-homestead properties. If homesteads were 50% of the tax base, that would mean a nominal 1% increase would be transformed into a 2% increase in SEV – and therefore in effective tax rates – for all non-homestead property.
State and county equalization boards could partially avoid this by ordering only equalization adjustments on classes other than residential. However, this would still leave non-homestead residential parcels without equalization.
This problem begs the question: what equalization could occur under HJR H?[19] This would be largely left to implementation by the legislature. Because of the uncertainties involved, the effect of implementation would be large.
Voted Increase on One Class
After Headlee rollbacks on one class of property reduce that class's millage rate, an attempt could be made to vote a higher millage rate on just that class. This could be either a new authorization, or a "Headlee override" vote. Since "business" property would likely receive more Headlee rollbacks than residential, many local governments may find it easy to attain voter approval of higher tax rates on businesses, since businesses cannot vote.
Pre-emptive Tax Increase
If local units of government subject to the 50-mill limit vote more than 50 mills, then the last voted millage must be reduced to comply with the limit.[20] Under RJR H, a municipality would be tempted to vote higher millage rates even though they exceed the limit and could not be immediately levied. Subsequently, when the split-Headlee rollback provision of HJR H results in reductions in millage rates for one or more classes, the previously-voted mills would then be levied – without any vote of the people. This could occur soon, or years later, and just residential & agricultural, just "business" property, or both.
The overall property tax burden would change only slightly under HJR H. It is likely that property taxes would be slightly higher under HJR H in 1993, and could be slightly higher or lower after that.
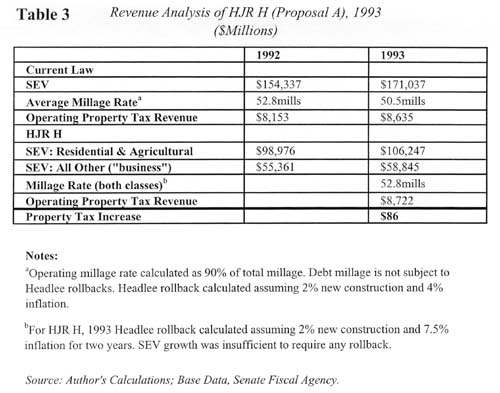
Table Three outlines projected property taxes under current law and HJR H in 1993. Under current law, the Headlee amendment would roll back the average millage rate by a significant amount in 1993. HJR H, on the other hand, would not require a reduction in average millage rate, as its special 1993 provision allows assessment increases to raise property tax revenue by the equivalent of two years' inflation, before triggering a Headlee rollback.[21] Even with a slightly lower SEV due to the assessment growth cap on "homesteads," this would result in property taxes being about 1% higher under HJR H than under current law.
In subsequent years, the assessment growth cap might cause property tax burdens to decline to slightly below current law. However, the creation of split millage rates, and the possibility of direct tax increases on only one class of property, might result in overall tax burdens higher under HJR H than under current law. With the considerable uncertainty as to how HJR H would actually be implemented, one cannot predict with much confidence the relative tax burdens more than a year or two out.
Why No Tax Savings?
The lack of any tax savings under HJR H, and the likelihood that taxes would actually increase slightly compared with current law, are mostly explained by the following three factors:
HJR H does not promise any direct reduction in millage rates or the assessment ratio.
Whatever relief results would frequently come to one class of property owners at the expense of another. Since the Headlee rollbacks would occur by class, rather than as a whole, a larger rollback in one class simply means a smaller rollback in another. Similarly, the assessment growth cap on homesteads means a smaller Headlee rollback for other residential & agricultural property.
In 1993 HJR H would allow tax revenue to increase by a rate of two years' inflation, setting a higher base to begin with.
Comparison With Other Revenue Analyses
This study directly calculated Headlee rollback factors to determine millage rates under both current law and HJR H. The reduction in millage rates under current law, compared with no reduction under HJR H, resulted in slightly higher 1993 property taxes under HJR H.
By comparison, Senate Fiscal Agency revenue analysis of HJR H assumed a slight increase in overall millage rates under HJR H, and somewhat lower millage rates under current law. They project a very slight decline in property tax burden in the first few years, growing to about 2% by 1997. Business taxes were projected to increase slightly, with residential tax burdens declining slightly.[22]
As explained above, HJR H would create three classes of property, each with a different combination of assessment method and millage rates. Such a system is bound to produce large disparities in the taxation of similar properties. Could such a system pass muster under the U.S. Constitution's guarantee of equal protection under the laws?
While the U.S. Supreme Court recently decided that an acquisition-value assessment method does not, by itself, deprive citizens of equal protection, HJR H goes far beyond the disparities caused by such a method alone. Its mix of assessment methods, and the explicit levy of different tax rates on neighboring property, would create a bizarre mixture of higher and lower taxes, with little apparent rational basis. This is especially likely if the implementing legislation leaves the many avenues for disparate tax treatment open.
For these reasons, explained at length in Appendix I, HJR H would be subject to a strong challenge in Federal Court. In our opinion, the disparities caused by HJR H do not serve a clear rational purpose, and it may ultimately be declared unconstitutional should it pass this November.
Proposal C, also known as "Cut and Cap," would reduce property taxes by constitutionally exempting a flat percentage of the value of a11 parcels from school operating property taxes. The exemption grows to 30% by 1997, and with school operating millage at about 60% of total millage, Cut and Cap would mean a permanent reduction in total property tax rates of about 18%. After adjustingfor higher tax payments . and lower tax credits, Cut and Cap would save taxpayers over $500 million in 1993, growing to $2 billion in 1997. Local school districts would be reimbursed from the state treasury for the direct reduction in property tax revenue from the exemption.
This permanent reduction in property tax rates would also result in a large increase in the value of property across the state, increasing the wealth of Michigan home and business owners by roughly $19 billion by 1997 – well over $2;000 for every Michigan resident. This combination of $2 billion in additional disposable income, and $19 billion in additional wealth, would provide a tremendous stimulus to the Michigan economy. This stimulus would result in higher per-capita income, an increase in employment, and the attraction of more businesses to the state.
Cut and Cap also limits assessment increases on individual parcels. The Headlee amendment currently limits tax increases caused by assessment growth to the rate-of-inflation, but applies the limit to all existing property, taken as a group. Cut and Cap would place a limit of 3% or the rate of inflation; whichever is less, on individual parcels. This would create more predictability in the assessments of property owners, addressing a frustrating weakness in the current property tax system. However, it would also cause identical parcels, to be taxed at different effective rates, as long-held property became increasingly under-assessed compared with recently-purchased property. California's "Proposition 13" constitutional tax limitation has a similar feature; which was upheld by both the California and the U.S. Supreme Court as constitutional.
"Cut & Cap" is a constitutional amendment, placed on the 1992 ballot by a petition drive headed by Governor John Engler. It would do the following:
Reduce the effective rate of property taxation by exempting 30% of the value of property from school operating property taxes, with the exemption phased in over five years. School operating property taxes comprise about 60% of property tax revenue in the state, so a 30% reduction results in an average reduction in total property tax rates of about 18%.
Limit the annual increase in the assessed value of each parcel of property to 3% a year or the rate of inflation, whichever is less. until the parcel is sold, at which time it would be reassessed based on market value.
Reimburse local school districts for the reduction in operating revenue due to the exemption from school operating property taxes. The reimbursement would conic from the state treasury, and would be limited to that due to millage rates levied in 1991 or the then-current year, whichever is less.
Reimburse units of local government to insure that contractual obligations for certain Tax Increment Financing Authorities (TIFA's) and other authorities are not impaired.
The complete text of the proposal is contained in Appendix V.
The Exemption as a Property Tax Cut
The exemption for school operating property taxes would act as a simple reduction in the overall property tax rate. As. detailed below in the revenue analysis, at would result in a gross reduction in property taxes beginning at three-quarters of a billion dollars in 1993, and ultimately reaching over 2 1/2 billion dollars in 1997.
Such an increase in disposable income would also directly result in higher revenues from existing income, sales, SBT, and other taxes, and lower tax credits, which are also incorporated in the revenue analysis. However, the magnitude of the property tax reduction far outweighs that of the higher revenue and reduction in outlays. For example, adjusting the gross tax cut of three-quarters of a billion dollars in 1993 for increases in sales, income, and SBT taxes, and reductions in tax credits, leaves a net tax cut of over a half-billion dollars.
Reduction in Property Tag Rates and the Michigan Economy
By reducing property tax burdens significantly, Cut and Cap would give a powerful boost to the state's economy. The permanent reductions in tax burden would result in greater disposable income available to Michigan consumers, increases in wealth due to tax capitalization, and better incentives to entrepreneurs to locate in Michigan. As detailed in the introduction to this study, page 2, such a reduction in tax burden would increase employment and improve per-capita income. This would provide additional revenue to state and local governments as well as reductions in outlays which are not incorporated into the revenue analysis.
Tax Capitalization
A lower tax rate directly increases the value of an economic asset, through the phenomenon known as "tax capitalization." Whenever the cost of holding an asset declines, its value increases, since the owner now will be required to pay less each year. This improvement of the owner's cash flow is capitalized into the price of the asset. Tax capitalization in property values is well established in commercial practice, the law of taxation and assessment, and the financing of homes.
The permanent reduction in property taxes would result in a large increase in the wealth of Michigan property owners, on the order of $19 billion when fully implemented. This would be over $2000 for every Michigan resident in real, spendable wealth – a further stimulus to the Michigan economy. Examples are provided below for both typical households and selected Michigan cities and counties.
The revenue analysis in this study explicitly includes estimates of tax capitalization To not include tax capitalization would be to ignore fiscal reality, as well as Michigan law. Further explanation of the commercial, legal, and financial aspects of tax capitalization is in Appendix II.
The second main feature of Cut and Cap is a limit on assessment increases for individual parcels. The Headlee amendment currently limits tax increases caused by assessment growth to the rate of inflation, but applies the limit to all existing property, taken as a group.Cut and Cap would place a limit of 3% or the rate of inflation, whichever is less, and apply it to individual parcels. This limit on assessment growth would add to the tax savings created by the exemption, although it could be offset by millage rate increases.
In addition, the cap on assessment increases would result in less "Headlee" rollbacks in millage rates, since SEV would not grow as fast as actual values. Thus, millage rates would be higher under Cut and Cap than under current law, although property tax burdens would be significantly lower because of the 30% exemption for school operating millage.
Market Value Versus Acquisition Value Assessment
The cap on individual parcel assessment growth would change the current assessment scheme from a market-value system to an acquisition-value system. Rather that attempting to estimate the current market value of all parcels, assessors would rely on the cost of acquiring the property, even if it was years ago, in determining the current assessment. Since the annual adjustment is capped at 3%, which is less than the average inflation rate of the past couple decades, the acquisition-value system would almost certainly result in systematic under-valuation of most properties.
An acquisition-value assessment system creates disparities in effective tax rates, because most assessments do not reflect true market values. Those parcels that have been recently purchased are assessed based on full market value, while those purchased years ago are often significantly underassessed. This has raised the question of whether such a system violates the U. S. Constitution's guarantee of equal protection under the laws. This question was answered conclusively in a case involving a provision similar to Cut and Cap in the California constitution.
The U.S. Supreme Court, in Nordlinger v Hahn[23] ruled that the California Constitution's "Proposition 13" assessment growth cap does not violate the equal protection clause of the U. S. Constitution. The court ruled that the legitimate interests of preserving neighborhoods and maintaining predictable and affordable property taxes gave an acquisition-value assessment system a rational basis, and that it did not violate the U.S. Constitution. Cut and Cap would almost certainly pass federal constitutional muster under the Nordlinger decision.
Cut and Cap vs. RJR H: Assessment Growth Caps
The assessment growth cap in Cut and Cap is different from that contained in HJR H. Cut and Cap applies a 3% limit on all parcels, while HJR H applies a 5% limit on homestead parcels only. While any assessment growth cap introduces disparities in effective tax rates, Cut and Cap uniformly applies the cap, while HJR H applies it to only certain parcels. Furthermore, HJR H allows different millage rates to emerge, partially because of the limited scope of its assessment growth cap. Thus, while Cut and Cap would cause some disparities, they would not be as severe or as explicit as those in HIR H.
Appendix I outlines the reasons why the disparities created by HJR H might result in it eventually being ruled contrary to the equal protection clause of the U.S. Constitution.
Pros and Cons of an Assessment Growth Cap
An assessment growth cap has both advantages and disadvantages.
Pros
Predictability in Taxation
With an assessment growth cap, taxpayers can better predict the future burden of taxation on their property. Although millage rates still could increase, assessment shock would be eliminated. This is especially important given the sad history of widespread abuses and inequities in assessing practices, vividly recounted each spring in angry meetings of taxpayers and local Boards of Review.
Affordability
Property buyers normally go through a rigorous screening to ensure that, barring unforeseen financial setbacks, they will be able to support the payments of mortgage principal and interest, property taxes, and insurance within a reasonable share of their income. Banks and other lending institutions, federally-chartered institutions supporting secondary markets in mortgages, and purchasers of mortgage-backed securities all support these standards. However, while mortgage payments are normally fixed, or at least limited in amount, no such limit exists for property taxes. It is not unusual in this state for monthly property tax burdens to exceed the mortgage payments on a home purchased some years ago.
An assessment growth cap limits the annual increase in property taxes due to assessment growth. This is particularly important to senior citizens, retirees, and others on fixed incomes.[24]
Neighborhood Preservation
A limit on annual assessment growth helps preserve neighborhoods, by allowing long-time residents to remain even if their property taxes, if based on market value, would be prohibitively expensive. Again, senior citizens and retirees are especially vulnerable to being "taxed out of their homes."
No Taxation of Unrealized Gains
While an increase in the market value of a home is a real increase in wealth, it is typically an "unrealized gain," meaning an increase in value that has not been converted to cash. Unrealized gains on other assets, for example stocks and bonds, are not subject to federal or state income taxation. Proponents of assessment growth caps, such as Hillsdale College economics professor and Mackinac Center analyst Gary Wolfram, have argued that property, taxation should not be based on unrealized gain.[25]
Reduction of Assessment Abuses
Under an acquisition-value assessment system, assessments are made when there is strong, solid evidence of true market value: when a parcel is sold. At other times, when the current assessment system is rife with inequities, it does not attempt to estimate true market value.
Reduction of Assessment Administrative Burden
By eliminating the need to assess the market value of every parcel of property each year, an assessment growth cap also eliminates much of the need for the expensive, time consuming, and frustrating assessment bureaucracy and appeals system.
Cons
Disparities
The obvious drawback is the creation of disparities in effective tax rates, as discussed previously. An example is presented on page 28.
Lock-in Incentive
An assessment growth cap also creates an incentive to remain in a house long after it serves an efficient function, since the sale of an existing home and purchase of a new one carries an implicit penalty of increased taxation. This is the downside of the "neighborhood preservation" argument.
No Taxation of Unrealized Gains
The argument that unrealized gains should not be taxed has strong appeal, when discussing income taxes, since "gains" are income. The argument does not have the same weight when discussing asset or wealth taxes, such as property taxes. All asset taxes require payment of money that cannot be made out of the value of the asset, unless it is sold. To a great extent, the argument that unrealized gains in assets should not be taxed is an argument against any tax on assets, especially the property tax. Of course, given the high property tax burden in Michigan, an assessment cap can be seen as a reduction in the high rate of asset taxation.
Regressive Nature
The benefits of an assessment growth cap accrue mostly to stable property owners in desirable areas. Renters, transient movers, younger people, and owners of property in less desirable areas receive less of a benefit. However, that is not to say they receive no benefit. Furthermore, the overall economic benefits of a tax cut are likely to help exactly this latter group of people the most, since they have the most to gain from a more vibrant Michigan economy.
What is a "Sale?"
Over time, an assessment cap creates a strong incentive not to sell a current property. Individuals who nonetheless wish to move will create imaginative financial arrangements designed to give almost all the benefits of a sale, without being a sale for tax purposes. Long-term leasebacks, leases-to-purchase, land contracts, intra-family transfers, and other arrangements blur the distinction between sold and owned, and would be used to give physical possession to one individual, while retaining an assessment growth cap based on the purchase long ago of another.
This incentive to avoid a "sale" would create a new legal and administrative burden. On the other hand, the cap would also eliminate much of the large existing burden of annual assessment and review. The addition of new burdens must be weighed against the reduction in old ones.
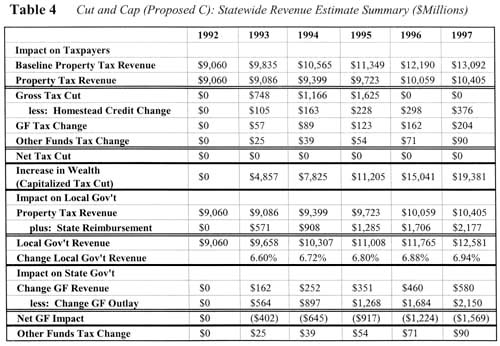
Table Four summarizes the revenue analysis of Cut and Cap, based on a tax model developed by the author for the Mackinac Center. The model uses base data on SEV, millage rates, inflation, new construction, and other factors from the Senate Fiscal Agency. The model's innovations are the explicit recognition of both tax capitalization and the other tax revenues gained from increasing disposable income and wealth. The model is described in Appendix IV.
Using the same methndology adapted to local and specific examples, the succeeding sections analyze the effect of Cut and Cap on individual properties and major Michigan Cities and Counties.
Cut and Cap Statewide Projections
The following are the key statewide revenue projections for Cut and Cap:
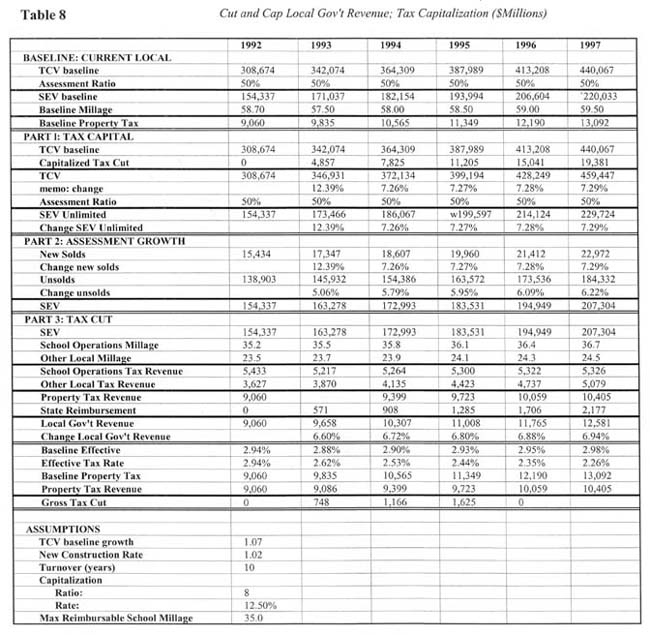
Current-law baseline property tax revenue grows from $9.0 billion in 1992 to $13.0 billion in 1997. Under Cut and Cap, property tax revenue grows more slowly, to $10.4 billion in 1997. The difference is a gross tax cut starting at $748 million in 1993 and growing to $2.7 billion in 1997.
Increases in other taxes – sales, income, and SBT – and reductions in income tax credits make the net tax cut start at $562 million in 1993 and grow to $2.0 billion in 1997.
School districts receive reimbursement for the exemption starting at $571 million in 1993 and growing to $2.2 billion in 1997. However, given reductions in outlays and increases in tax revenues, the net effect on the state's general fund is a smaller amount, ($402 million) in 1993 growing to ($1.6 billion) in 1997.
Property tax revenue to local governments, as augmented by reimbursement to local schools, grows from $9.0 billion in 1992 to $9.6 billion in 1993, a 6.6% increase. Local Government revenue reaches $12.6 billion in 1997, with annual growth rates increasing to almost 7%. This represents continuous real increases in revenue for local units of government, assuming that inflation remains around 4% per year.
SEV, as limited by the assessment growth cap on unsold properties, grows from $171 billion in 1993 to $207 billion in 1997. This is a 34% increase in five years over the 1992 SEV of $154 billion. SEV unlimited by the assessment cap would reach $229.7 billion in 1997. Such increases occur even with the 3% annual assessment cap on unsold property, because newly sold property adds to SEV substantially, and because new construction is immediately added to SEV according to its market value.
The true value of property increases by $19.4 billion in 1997 due to tax capitalization, with a steadily growing portion incorporated into SEV.
The effective tax rate on Michigan property declines from 2.94% in 1992 to 2.26% in 1997, compared with a baseline effective tax rate that increases slightly to 2.95% by 1997.
Comparison With Other Revenue Analyses
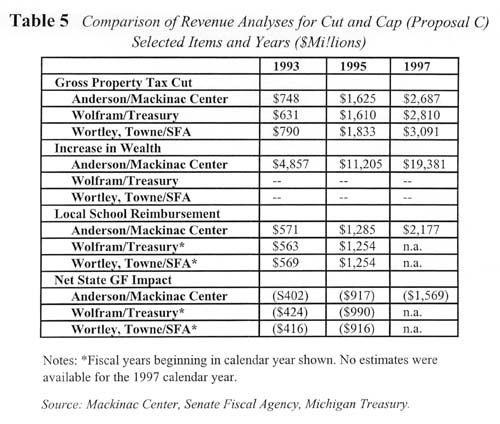
Table Five compares this revenue analysis with two others, done by Gary Wolfram for the Department of Treasury, and Jay Wortley and George Towne for the Senate Fiscal Agency.[26] The estimates for gross tax cut, local school reimbursement, and net impact to the general fund are very similar among the three studies. Appendix IV discusses the methodological differences among the three studies.
Table Six presents three representative examples of homeowners. The examples were chosen to reflect the range of outcomes for typical Michigan homeowners. The urban example assumes the higher millage rates, slower growth in value, and lower home values that are common in Michigan cities. The two suburban examples differ only in the year of purchase of the property, to reflect the differences in property taxes caused by the assessment growth cap.
Case I: Urban Homeowner
The representative urban homeowner's property is assessed at $25,000 SEV in 1992, and pays 37 mills in school operating taxes. With property values growing at 4.5% a year, and school millage rates increasing one mill, the homeowner could expect his SEV to grow to $32,556 in 1997, and school operating property taxes to grow from $925 in 1992 to $1,237 in 1997.
Under Cut and Cap, the SEV growth would be capped at 3% a year, limiting the 1997 SEV to $28,982. Although the school millage rate grows an extra half mill, the 30% exemption reduces the school property tax bite by $456. In addition, the value of the home would increase by $2,969.
Case II: Suburban Homeowner
The representative suburban homeowner's property is assessed at $50,000 SEV in 1992, and pays 33 mills in school operating taxes. With property values growing at 5.5% a year, and school millage rates increasing one mill, the homeowner could expect his SEV to grow to $71,755 in 1997, and school operating property taxes to grow from $1,650 in 1992 to $2,344 in 1997.
Under Cut and Cap, the SEV growth would be capped at 3% a year, limiting the 1997 SEV to $57,950. Although the school millage rate grows an extra half mill, the 30% exemption reduces the school property tax bite by $945. In addition, the value of the home would increase by $5,626.
Case III: Suburban Homeowner Purchasing Property in 1997
This case illustrates the effect of the assessment growth cap on relative tax burdens. The value of the home and millage rate are the same as in Case II; but the home is purchased in 1997 and reassessed based on full market value.
The new purchaser finds her home reassessed at $71,755 SEV, and pays school property taxes of $1,733. Both these figures are 24% higher than the next-door neighbor profiled in Case II. However, even with these disparities, she is still better off in two respects: she saved $611 in property taxes compared with current law, and her home is valued $5,625 higher.[27]
This example illustrates a larger disparity than typically would be the case. It assumes a high-valued property, in a fast-growing area, and a full reassessment in the year of purchase.[28] Most disparities would be smaller, but some would be larger. The example also illustrates the fact that, even when paying more property taxes than a neighbor, a new purchaser under Cut and Cap would still enjoy considerable savings in property taxes, and increases in homeowner's equity, when compared with current law.
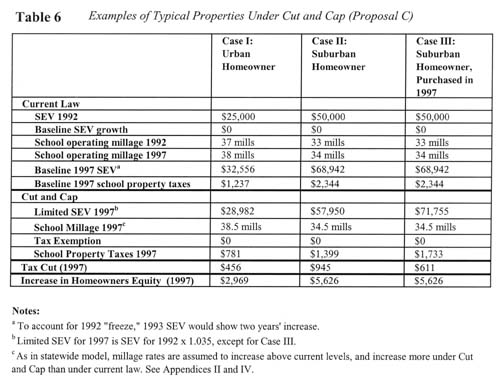
Table Seven contains projections of tax savings and wealth increases for property owners in the ten largest Michigan cities and counties. These projections are based on 1992 average school operating millage rates and SEV for each municipality, using the same methodology as the statewide model outlined in Appendices II and IV. SEV and millage rates are assumed to grow in each municipality at the same rate as statewide, both under current law and Cut and Cap.
In Michigan cities, the owner of a typical home assessed at $50,000 in 1992 could expect to receive a 1997 tax cut of $921 in Detroit, $911 in Grand Rapids, and $671 in Ann Arbor. In Michigan counties, the owner of a typical home assessed at $50,000 could expect to receive a 1997 tax cut of $850 in Wayne, $786 in Oakland, $890 in Macomb, and $835 in Kent.
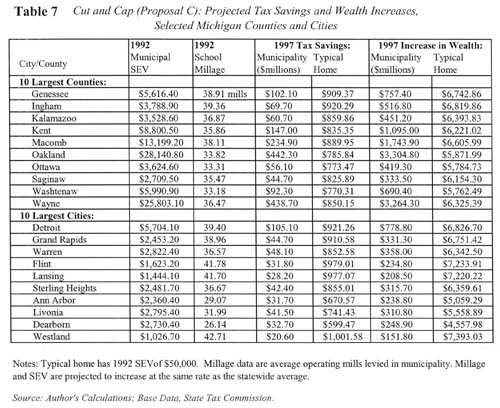
These tax cuts would increase the 1997 property values, and hence the homeowners' equity, in a typical home by amounts ranging from $5,059 in Ann Arbor to $6,820 in Ingham County. Such increases in wealth could be converted into spendable dollars by selling the property, leasing it, or obtaining a home equity loan.
The typical home in each municipality is defined as one having a 1992 SEV of $50,000, meaning that its approximate current market value would be $100,000, This is done for ease of comparison, and does not reflect an average home value for each municipality. To adjust the projections for properties of greater or lesser value, simply increase or decrease the amounts by the same percentage as the property differs in market value from $100,000. For example, a home with a current market value of $120,000 would be expected to receive a tax cut and an increase in value 20% higher than the typical home for each municipality.
The SEV of the typical home is assumed to increase at the same rate as statewide SEV, reflecting a mix of newly-sold and unsold parcels, as well as new construction. This is different from the three examples shown in Table Six. These have no new construction, and either remain owned by the same person, or (Case III) are purchased and reassessed in 1997. Actual increases in market value could vary considerably among municipalities across the state.
Effects on Schools and Local Governments
Cut and Cap would reimburse school districts for the exempted property tax. The proposal properly limits the reimbursement to the millage rate approved by the voters in 1991, so there is no incentive to raise millage rates further.[29] However, this does create a disincentive to lowering millage rates below 1992 levels. The revenue analysis assumes increases in school operating millage rates under current law, and larger increases under Cut and Cap, and limits the reimbursement from the state to that calculated with the 1991 millage rate.
Under Cut and Cap, revenue to local units of government from property taxes and state reimbursement to local schools is projected to increase at annual rates increasing from 6.6% in 1993 to 6.9% in 1997. Local government revenue increases from $9.0 billion in 1992 property tax revenue alone to $12.6 billion in combined property tax and reimbursement revenue in 1997.
This strong revenue growth occurs even with the assessment growth cap and limits on the reimbursable millage rate. A number of factors contribute to this:
Even with the assessment growth cap, SEV is projected to grow from $154 billion in 1992 to $207 billion in 1997, a 34% increase over five years.
The "cap" would reduce the number and amount of Headlee rollbacks, thus allowing higher millage rates. The actual reduction in revenue due to the assessment cap is not the growth rate of property less 3%, but a much smaller rate.
Tax capitalization would generate a large increase in the actual value of property, which will gradually work its way into SEV as property is sold. This expands the tax base on which millage is levied.
Citizens would still have the ability to vote higher millage, within constitutional limits.
Furthermore, local governments would benefit from the tremendous economic stimulus of the tax cut. Thus, the overall effect of Cut and Cap on local governments, at least over the long term, would be similar to that on the overall economy of the state.
Effects on Local Governments: Local Share of State Revenue under the "Headlee" Amendment
Under Article IX Section 30 of the Michigan Constitution, added by the "Headlee" amendment, the state is required to allocate a minimum share of its spending to local units of government, taken as a group. The state, through a complicated scheme, violated this provision of the Constitution in the 1980's, and Oakland County sought relief from the court. After losing in the Circuit and Appeals courts, and facing an adverse Supreme Court ruling, the state settled in June 1991.[30] The settlement forces the state to begin allocating over $400 million in state spending to local units of government beginning in Fiscal Year 1993. This requirement will be difficult to meet without constant policing of state spending.
The state's reimbursement payments to local schools under Cut and Cap would count towards its obligations to local governments under section 30 of the Headlee amendment. Should Cut and Cap pass, and the state not enter into any new prohibited maneuvers, the required reimbursements should move it into easy compliance with the Section 30 requirement. This does create the risk that the state would reduce its support of other local government services. However, Article IX section 29 of the Michigan Constitution, also added by the Headlee amendment, requires the state to fully fund any individual activity or service provided by local governments that is mandated by the state.[31] This will limit, though not eliminate, the risk of state reductions in local government support.[32]
Cut and Cap is not a school finance reform proposal. It would cut property taxes in the same proportion across the state, and reimburse school districts in the same proportion. Thus, it is primarily neutral in its distributive effects, with three redistributive effects of smaller magnitude.
Tax Cut and Reimbursement
Cut and Cap would reduce taxes, and reimburse, the largest amount in districts which levy high school millage rates. As shown previously in Table Seven, cities typically have high millage rates, and would receive heavy tax cuts and large reimbursements from the state. Many near-urban districts close to major cities also spend relatively large amounts on schools, with high millage rates and property values close to average for the region. These areas would also benefit significantly, as would affluent suburban districts that spend heavily on public schools, generally through high property values and close-to-average millage rates.
Given the economic burden of high property taxes in many Michigan cities, Cut and Cap would give a powerful stimulus to urban economies. For example, the Detroit School District would probably be the largest recipient of reimbursement dollars in the state, as well as probably receiving the largest tax cut of any city or township in the state.
Assessment Growth Cap
The assessment growth cap would cause a redistributive effect within taxing jurisdictions. This would occur as the cap limits SEV growth in areas with more rapidly growing property values. The strongest effect would be within those jurisdictions with the highest tax rates, namely schools. However, these also tend to be geographically small, and therefore would tend to have the least amount of variance in property value growth rates. Large municipalities, such as counties, would have greater variation in growth rates, but also tend to have lower millage rates.
A third redistributive effect would be caused by the lower revenue received by school districts in fast-growing areas because of the assessment growth cap, compared with less of an effect on school districts with less-rapid property value growth. This effect would be very small for three reasons: First, the assessment cap would only lower revenue on unsold properties by the difference between 3% and the inflation rate, which lately has been about 4%. Second, both the Headlee amendment and "Cut and Cap" allow new construction to pass through without limitation. Third, voters are still free to approve higher millage rates. Districts with the most rapidly growing property values tend to have lower millage rates than high-millage urban areas.
To the extent that spending growth in high-growth areas is held back by this effect, it would tend to reduce the current disparity in spending among the state's school districts. However, this effect will probably be very small.
Conclusion: Distributive Effects of Cut and Cap
Cut and Cap is primarily neutral, cutting taxes and reimbursing school districts in the same proportion statewide. To the extent that there are smaller, second-order-of-magnitude redistributive effects, they tend to favor high-tax, urban and near-urban school districts.
Acquisition-Value Assessment and the US Constitution
The US Supreme Court, in Nordlinger v Hahn,[33] ruled that states may limit assessment growth on individual parcels, and thus create different effective taxation rates, without violating the US Constitution's guarantee of equal protection under the laws. The court ruled that a state may establish an acquisition-cost system of assessment, since it had at least two rational bases: The preservation of neighborhoods, and the predictability and affordability ("reliance interests") of future property taxation.
Both HJR H and Cut and Cap limit assessment growth (HJR H on "homesteads" only), and thus both seem to be protected under Nordlinger against federal constitutional challenge. However, HJR H would still be vulnerable to federal challenge because it goes beyond the assessment-growth cap in California's Proposition 13 and in Michigan's Cut and Cap proposal, and explicitly discriminates by class-..
The US Supreme Court, in the prior case Allegheny Pittsburgh Coal v Webster[34] had ruled that arbitrary differences in tax rates, when those differences were contrary to state constitutions directing uniform taxation, violated the equal protection clause of the U.S. Constitution. The court noted in the Nordlinger decision the rational bases for the California constitution's assessment-growth cap contrasted with the facts in Allegheny, which "precluded any plausible inference that the reason for the unequal assessment practice was to achieve the benefits of an acquisition-value tax scheme."[35] HJR H would create a system where some properties ("homesteads") would be assessed on an acquisition-cost basis, and others assessed on a current value basis. Furthermore, whereas in both Allegheny and Nordlinger all property owners within each jurisdiction paid the same tax (millage) rate, under HJR H property owners would pay explicitly different tax rates. In Nordlinger, all property was assessed on a acquisition-costmethod, whereas under HJR H different property would face different assessment methods, as did property, in Allegheny.[36]
Equalization and HJR H
Equalization would be difficult, if not impossible, under HJR H. Equalization is necessary under a market-value assessment system; rudimentary under a acquisition-value assessment system. How do you equalize when some parcels are assessed by acquisition value, and others by market value?
This study previously detailed how taxes could be raised on single classes through the equalization process, under some possible HJR H equalization schemes. Equalization that forces some properties to pay higher taxes than other similar properties was previously found to unconstitutionally violate the equal protection clauses of both the U.S. and New York Constitutions, in the interesting Foss v Rochester case.[37]
In this case, the New York supreme court found a state law unconstitutional because it placed disparate tax burdens on similar parcels. The parallels with HJR H are striking, because the law was passed to correct a de facto dual taxation system that taxed non-homestead property at higher rates than homestead property, but attempted to preserve the lower rates on homestead property. However, equalization had the effect of causing similar parcels in the same class to pay different tax rates to the same unit of government. The same situation could occur under HJR H.
A Rational Basis for HJR H?
A future challenge to HJR H would come down to this question: What is the rational basis for RJR H? The court in Nordlinger ruled:
"Accordingly, this Court's cases are clear that, unless a classification warrants some form of heightened review because it jeopardizes exercise of a fundamental right or categorizes on the basis of an inherently suspect interest, the Equal Protection Clause requires only, that the classification rationally further a legitimate state interest."[38]
Proposition 13, and Cut and Cap, share a clear rational basis. HJR H, while motivated apparently by a desire to protect homeowners, in fact creates three classes of property, in which it is not clear who is favored, or why. HJR H explicitly discriminates, in both its assessment-growth cap and its split-Headlee-rollback provisions, between property owners based on the use of the property. HJR H arguably jeopardizes exercise of fundamental rights, such as to engage in an occupation, by subjecting residents to higher taxes if they do so.
Given the almost incomprehensible nature of the disparities created by HJR H, and the lack of a clear rational basis, it would likely be challenged in federal court, and may very well be found unconstitutional.
Tax Capitalization
A lower tax rate directly increases the value of an economic asset, through the phenomenon known as "tax capitalization." Whenever the cost of holding an asset declines, its value increases, since the owner now will be required to pay less each year. This improvement of the owner's cash flow is capitalized into the price of the asset. Tax capitalization in property values is well established in commercial practice, the law of taxation and assessment, and the financing of homes.
The revenue analysis in this study explicitly includes estimates of tax capitalization. To not include tax capitalization would be to ignore fiscal reality, as well as Michigan law.
Commercial, Legal, Financial Use of Tax Capitalization
Investors in commercial properties, such as apartment and office buildings, routinely capitalize the expense and revenue streams predicted for a property when estimating its market value. For example, if an apartment building returned $12,000 a month in rent, and cost $10,000 a month in expenses and taxes, the margin of $2000 a month would be capitalized to estimate the market value of a property. To "capitalize" an income stream means to project out the cash flows into the future, and then add up the net present value (the value after discounting for the time value of money) of those flows. In the example, an income stream of $2000 a month or $24,000 a year might be capitalized at 10:1 to reach an estimated value of $240,000.[39]
Michigan taw relies on the capitalization of revenues and expenses, including property taxes, as one of three recognized methods of assessing property.[40]
Mortgage lenders use this principle in determining how much a home buyer can borrow.[41]
Thus, law, economic theory, and current practice ensure that a reduction in property taxes willresult in an increase in the value of property.
Tax Capitalization and Tax Revenue
Cut and Cap would reduce the tax expenses of holding a parcel of property, and therefore increase its value. The increased value will result in higher tax revenue than would have occurred without the increase in value. In this case, a 30% reduction in school operating tax rates would be capitalized into the true cash value of property across the state. This higher true cash value will then be taxed at the lower rate. Because of the higher true cash value, the change in tax revenue will be less than the 30% reduction in tax rate.
An Example of Tax Capitalization
For example, take a property with a true cash value (TCV) of $200,000, assessed at the SO% ratio at $100,000, and paying school operating property taxes of $3300 at the approximate statewide average of 33 operating mills. A straight 30% reduction in taxes would be .30 x $3300 = $990. Capitalizing this into the market value of the property, using a 10:1 capitalization ratio, yields additional TCV of $9,900, for a total TCV on the property of $209,900, assessed at 50% at $104,950. School property taxes of 53 mills (with the 30% exemption) would be .033 x 104,950 x (1-.30) = $2,424.[42] Other examples of tax capitalization, for representative properties and for typical properties in major Michigan municipalities, are given in Tables Six and Seven, beginning on page 25.
Comparing this with the original tax bill of $3300 shows how tax capitalization does two important things: First, it increases the value of the property. In this example, the property owner experienced an increase in wealth of $9,900. The property owner could recognize that immediately, through a home-equity loan or the sale of the property, or wait until later.
Second, the nominal reduction in property taxes is slightly smaller than the reduction in the tax rate. In this case, the actual tax cut was 73% of the rate cut. As a percentage of the value of the property, school taxes went down by the full 30%. However, the value of the property increased slightly, so the nominal dollar tax cut was smaller than 30%.
Tax Capitalization and the Assessment Growth Cap
In the simplified example above, we ignored the effect of the assessment growth cap on the individual parcel. Under Cut and Cap, the assessment cap would prevent much of the increased value from being taxed, until sold. However, the increased value could be tapped by a home-equity loan, or simply become part of the wealth of the homeowner.
What If Both Pass?
Both HJR H and Cut and Cap are constitutional amendments on the November 1992 ballot, and it is conceivable that both could pass. In such a case, the governing provision of the Michigan Constitution would be Article XII, section 2, which states:
If two or more amendments approved by the electors at the same election conflict, that amendment receiving the highest affirmative vote shall prevail.
Since both proposals amend Article IX, section 3 of the Constitution, HJR H and Cut and Cap would clearly "conflict." Thus, the one with the highest number of affirmative votes would prevail.
Although HJR H also amends Article IX, Section 31, the Michigan Supreme Court has previously interpreted Article XII, Section 2 to rule out piecemeal incorporation of two proposals that conflict in some areas but not others.[43] Thus, whichever proposal passes with the most affirmative votes will prevail in its entirety.
Baseline Assumptions
The baseline assumptions for SEV, millage rates, new construction rates, and some other variables were taken from the SFA study by Jay Wortley and George Towne, Property Tax Reform Proposals in Michigan, along with some additional nonpublished data supplied by the authors. These key assumptions include:
Baseline SEV growing 10.8% in 1993, and 6.5% afterwards;
New construction accounting for 2% of SEV growth annually; and
Millage rates which grow under current law, but grow higher under Cut and Cap.
Other assumptions and features of the model were:
Turnover (sales of property) of 10% a year – a faster rate than in the SFA study;
For HJR H, directly calculated 1993 millage rates, based on application of the Headlee amendment, and using a conservative 7.5% inflation rate for 1991 and 1992 combined;
A Capitalization Ratio of 8, equivalent to about an 12% cap rate, which is quite conservative; and
Tax multipliers of 7.6% for the General Fund, 14% for the Homestead Income Tax Credit, 3.35% for Other Funds; and (1%) for Outlays. These are described below.
Dynamic Effects
The model used for revenue analysis of Cut and Cap attempts to incorporate some dynamic effects normally left out of revenue models. The first is tax capitalization. A provisional tax cut is calculated, using a simple static analysis. In the case of Cut and Cap, the provisional tax cut in 1997 would be 30% of the school operating tax, based on the baseline estimates of school millage and SEV. The provisional tax cut is then capitalized, by multiplying it by the capitalization ratio. This capitalized tax cut is then added to the baseline True Cash Value (TCV), and, multiplied by the assessment ratio, becomes the (unlimited) SEV for the Cut and Cap projection. This SEV will be larger than for current law, so the gross tax cut – the difference between current law and projected tax revenue – will be smaller than a straight 30% share.
A second area of dynamic influence is the projection of additional tax revenue from other taxes. This is simply a factor multiplied by the gross tax cut. In addition, a reduction in outlays for social programs is also incorporated, driven by a simple factor.
The capitalization ratio and other dynamic factors used in the model are extremely conservative. A true, full dynamic model would attempt to include changes in employment, investment, and other factors. The modest effects in this model indicate the direction of dynamic change more than its magnitude.
SEV Algorithm
The assessment growth cap presents a difficult modeling problem. The algorithm used here to project SEV under the assessment cap works as follows:
An unlimited SEV series is created, based on the True Cash Value, as augmented by tax capitalization.
A share of the current year SEV, equal to 1/T where T = the turnover period, is calculated as equal to the same share of unlimited SEV. This accounts for the newly sold parcels.
The remaining (T-1)/T share is projected from last year's SEV, by adding new construction and increasing it at the limited (3%) rate.
Since we have no experience with an assessment growth cap in Michigan, actual results may prove quite different.
School Reimbursement
School Reimbursement was calculated using a limiting factor of 35 mills, the approximate average school operating millage in 1992.
Aggregation Problem
This, and all models, suffers from the fact that averages and totals were used, rather than truly aggregating all the various local units of government. This will always introduce some error.
Comparison With Other Revenue Analyses
One methodological difference between this study and those by Treasury and SFA is the inclusion of tax capitalization and larger state tax revenues from the additional disposable income of Michigan property owners. These factors did not cause the estimates of gross tax, school reimbursement, or net impact on the general fund to be significantly different, for the following reasons:
The assessment growth cap allows increases in property values to affect SEV only as property is sold, delaying its effect on property tax revenue; and
The additional revenue from other taxes was offset by larger estimates of income tax credits in the SFA and Treasury studies.
However, these studies did not incorporate tax capitalization.
A summary of the different revenue projections is given in Table Five on page 23.
STATE OF MICHIGAN
86TH LEGISLATURE
REGULAR SESSION OF 1991
Introduced by Reps. Harder, Bartnik, Olshove, Gire, DeBeaussaert, Byrum, Baade,
Dobronski, Yokich, Profit, Weeks, Niederstadt, Hoffman, Ciaramitaro and Palamara
Rep. Rocca named co-sponsor
ENROLLED HOUSE
JOINT RESOLUTION H
A joint resolution proposing an amendment to the state constitution of 1963, by amending sections 3 and 31 of article IX, to limit the increase each year in the state equalized valuation of homestead property.
Resolved by the Senate and House of Representatives of the state of Michigan, That the following amendment to the state constitution of 1963, to limit the increase each year in the state equalized valuation of homestead property, is proposed, agreed to. and submitted to the people of the state:
ARTICLE IX
Sec. 3. The legislature shall provide for the uniform general ad valorem taxation of real and tangible personal property not exempt by law. The legislature shall provide for the determination of true cash value of such property; the proportion of true cash value at which such property shall be uniformly assessed, which shall not, after January 1. 1966, exceed 50 percent; and for a system of equalization of assessments. However, beginning December 31, 1992, the legislature shall provide that the state equalized valuation of each parcel of homestead property, as defined by law, adjusted for additions and losses, as defined by law, shall not increase each year by more than the increase in the general price level, as defined in section 33 of this article, in the prior year or 596, whichever is less. unless the homestead property is sold. The legislature may provide for alternative means of taxation of designated real and tangible personal property in lieu of general ad valorem taxation. Every tax other than the general ad valorem property tax shall be uniform upon the class or classes on which it operates.
Sec. 31. Units of Local Government are hereby prohibited from levying any tax not authorized by law or charter when this section is ratified or from increasing the rate of an existing tax above that rate authorized by law or charter when this section is ratified. without the approval of a majority of the qualified electors of that unit of Local Government voting thereon. If the definition of the base of an existing tax is broadened. the maximum authorized rate of taxation on the new base in each unit of Local Government shall be reduced to yield the same estimated gross revenue as on the prior base. If the assessed valuation of property as finally equalized. excluding the value of new construction and improvements, increases by a larger percentage than the increase in the General Price Level from the previous year, the maximum authorized rate applied thereto in each unit of Local Government shall be reduced to yield the same gross revenue from existing property, adjusted for changes in the General Price Level, as could have been collected at the existing authorized rate on the prior assessed value. However, the increase in the General Price Level used for the calculation of the maximum authorized rate for 1993 shall be the combined increase in the General Price Level in 1991 and 1992. Beginning with ad valorem property taxes levied in 1993, in determining the maximum authorized rate required by this section as a result of the increased assessed valuation of property, one calculation shall be made for and applied to property classified as residential and agricultural and one calculation shall be made for and applied to the remaining classifications of property.
The limitations of this section shall not apply to taxes imposed for the payment of principal and interest on bonds or other evidence of indebtedness or for the payment of assessments on contract obligations in anticipation of which bonds are issued which were authorized prior to the effective date of this amendment.
Resolved further, That the foregoing amendment shall be submitted to the people of the state at the next general election in the manner provided by law.
I hereby certify that on the seventh day of March, nineteen hundred ninety one, the foregoing joint resolution was agreed to by the House of Representatives, by a two-thirds vote of all the Representatives-elect.
(Signature)
Clerk
of the House of Representatives.
I hereby certify that on the eighteenth day of April: nineteen hundred ninety one, the foregoing joint resolution was agreed to by the Senate, by a two-thirds vote of all the Senators-elect.
(Signature)
Secretary of the Senate.
Proposed constitutional amendment to amend Article IX, Section 3.
Article IX of the Michigan Constitution is hereby amended by amending Section 3, such amendment to read as follows: (NEW LANGUAGE CAPITALIZED)
ARTICLE IX
Section 3. EXCEPT AS PROVIDED IN THIS SECTION, the legislature shall provide for the uniform general ad valorem taxation of real and tangible personal property not exempt by law. The legislature shall provide for the determination of true cash value of such property: the proportion of true cash value at which such property shall be uniformly assessed, which shall not after January 1, 1966, exceed 50 percent; and for a system of equalization of assessments. BEGINNING DECEMBER 31, 1992, THE LEGISLATURE SHALL PROVIDE THAT THE STATE EQUALIZED VALUE OF EACH PARCEL OF PROPERTY ADJUSTED FOR ADDITIONS AND LOSSES, SHALL NOT INCREASE EACH YEAR BY MORE THAN THE INCREASE IN THE GENERAL PRICE LEVEL, AS DEFINED IN SECTION 33 OF THIS ARTICLE, FROM THE PRIOR YEAR OR 3 PERCENT WHICHEVER IS LESS, UNLESS THE PROPERTY IS SOLD. WHEN A PARCEL OF PROPERTY IS SOLD, IT SHALL BE ASSESSED AT THE THEN APPLICABLE PROPORTION OF TRUE CASH VALUE. PROPERTY IS EXEMPT FROM THE FOLLOWING PERCENTAGE OF GENERAL AD VALOREM TAXES LEVIED FOR OPERATING PURPOSES BY A SCHOOL DISTRICT: 10 PERCENT OF TAXES LEVIED IN 1993; 15 PERCENT OF TAXES LEVIED IN 1994; 20 PERCENT OF TAXES LEVIED IN 1995; 25 PERCENT OF TAXES LEVIED IN 1996; AND 30 PERCENT OF TAXES LEVIED IN 1997 AND EACH YEAR THEREAFTER. THE LEGISLATURE SHALL APPROPRIATE AND THE STATE TREASURER SHALL REIMBURSE EACH SCHOOL DISTRICT AN AMOUNT EQUAL TO THE GENERAL AD VALOREM TAX REDUCTIONS RESULTING FROM THE PERCENTAGE OPERATING TAX EXEMPTION 1N THIS SECTION. THE REIMBURSEMENT SHALL BE CALCULATED USING THE SCHOOL DISTRICT MILLAGE RATE FOR OPERATING PURPOSES LEVIED IN THE THEN CURRENT YEAR OR LEVIED IN 1991, WHICHEVER IS LESS. The legislature may provide for alternative means of taxation of designated real and tangible personal property in lieu of general ad valorem taxation. Every tax other than the general ad valorem property tax shall be uniform upon the class or classes on which it operates.
THE LEGISLATURE SHALL APPROPRIATE AND THE STATE TREASURER SHALL REIMBURSE UNITS OF LOCAL GOVERNMENT OR AUTHORITIES AN AMOUNT NECESSARY TO INSURE THAT CONTRACTUAL OBLIGATIONS ENTERED INTO BEFORE SEPTEMBER 1, 1991, PURSUANT TO A TAX INCREMENT FINANCING PLAN UNDER THE LOCAL DEVELOPMENT FINANCING ACT, ACT NO. 281 OF THE PUBLIC ACTS OF 1986, THE TAX INCREMENT FINANCE AUTHORITY ACT, ACT NO. 450 OF THE PUBLIC ACTS OF 1980, OR ACT NO. 197 OF THE PUBLIC ACTS OF 1975, ARE NOT IMPAIRED DUE TO THE PERCENTAGE OPERATING TAX EXEMPTION IN THIS SECTION.
Provisions of existing constitution altered or abrogated by such proposal if adopted.
ARTICLE IX
Section 3. The legislature shall provide for the uniform general ad valorem taxation of real and tangible personal property not exempt by law The legislature shall provide for the determination of true cash value of such property; the proportion of true cash value at which such property shall be uniformly assessed, which shall not after January 1, 1966, exceed 50 percent; and for a system of equalization of assessments. The legislature may provide for alternative means of taxation of designated real and tangible personal property in lieu of general ad valorem taxation. Every tax other than the general ad valorem property tax shall be uniform upon the class or classes on which it operates.
Patrick L. Anderson, a Senior Policy Advisor for the Mackinac Center for Public Policy, is the author of monographs on the Michigan economy, the Detroit economy, the Michigan Single Business Tax, and the "Headlee" amendment to the Michigan constitution, and has contributed articles on economic policy to the The Detroit News, The Wall Street Journal and Crain's Detroit Business. Previously a graduate fellow for the Central Intelligence Agency and an economist for Manufacturers National Bank of Detroit, Mr. Anderson is currently an Assistant Vice President at Alexander Hamilton Life Insurance Company of America in Farmington Hills, Michigan.
Mr. Anderson received a Bachelor's degree in Political Science and a Master's degree in Public Policy, both from the University of Michigan in Ann Arbor. Mr. Anderson was the Vice Chairman of the Michigan Consumers Council from 1985 through 1988, and is currently a director of Taxpayers United for the Michigan Constitution and a member of the Detroit Area Economic Forum and the National Association of Business Economists. He lives in Farmington with his wife Madhu and son Neal.
A fragment of this revenue goes to the state, for utility property.
Jay Wortley and George Towne, Property Tax Reform Proposals in Michigan, Lansing, MI, Senate Fiscal Agency, July 1992. The base data is from US Department of Commerce, Bureau of the Census, Government Finances, 1989-90, and Advisory Commission on Intergovernmental Relations, State Fiscal Capacity and Effort, 1988, both published in Washington, D.C.
While this is a common practice among Michigan analysts, it is not completely correct. The "Homestead" or "Circuit Breaker" income tax credit is only allowed on some property, and within certain income parameters. Furthermore, age and disability status affect the credit. This income tax credit does not reduce the direct tax burden on the owner of. the property, but instead may allow a later, partial, indirect reduction in other taxes.
The average effective property tax rate on single family homes with FHA-insured mortgages was 2.10%, the fourth highest among the states and the District of Columbia, and almost double the U.S. average of 1.15%. See Significant Features of Fiscal Federalism, Washington, D. C., Advisory Commission on Intergovernmental Relations, 1989.
Government of the District of Columbia, Department of Revenue and Finance, Tax Rates and Tax Burdens in the District of Columbia: A Nationwide Comparison, June 1990. Detroit's effective property tax rate was 4.4%. This extremely high property tax burden helped Detroit earn the dubious distinction of also having the lowest property values among the S I cities in the survey. See the discussion of Tax Capitalization in Appendix II for a discussion of how high property tax rates force property values low.
For further discussion of the effect of the tax burden on the Detroit economy, see Patrick L. Anderson, ed., Detroit Economic Development Plan, Detroit, MI, Economic Enterprise Foundation of Detroit, December 1988; and Fiscal Trends of the City of Detroit, Detroit, MI, Citizens Research Council, June 1991, report no. 300.
In addition to the references on state tax burdens cited above, see also Scott Mackey, "State and Local Tax Levels: Fiscal Year 1981," State Tax Notes, March 30, 1992; and Citizens Research Council of Michigan, Income, Spending, and Taxation – Michigan Compared to the US Average, Detroit, MI, report no. 997, April 1991 and 1991 Michigan Tax Climate, report no. 301, June 1991.
Patrick L. Anderson, Michigan in the Current Recovery: A Historical Perspective, Chicago, IL, The Heartland Institute, 1986, outlines this case, and includes evidence that high-tax states have seen slower job growth than low-tax states. See also Gene Heck, Michigan in Perspective, report to the Michigan Senate, February 1988, for an exhaustive detailing of the economic decline of Michigan, and its relatively high tax and regulatory burdens.
The pioneering work was probably that of Robert Genetski and Young Chin, "The Impact of State and Local Taxes on Economic Growth," Chicago, IL, Hams Trust and Savings Bank, November 1978, and its December 1982 followup by Robert Genetski and Lynn Ludlow, "The Impact of State and Local Taxes on Economic Growth,1963-1980." Other studies of tax burdens and state economic growth include Joseph Bast et al., Coming out of the Ice: A Plan to Make the 1990's Illinois' Decade, Chicago, IL, The Heartland Institute, 1989, which summarizes and compares the results of24 separate studies; Stephen Moore, "Taxes, Economic Growth, and Budget Deficits: What Washington Can Learn From the States," Washington D.C., Heritage Foundation, February1990, Backgrounder no. 722/S, which cites additional research results; and Richard Vedder, Do Tax Increases Harm Economic Growth and Development?, Flagstaff, AZ, Barry Goldwater Institute, report no. 106, September 1989, which contains a lengthy annotated bibliography.
National Conference of State Legislatures, "Interstate Tax Comparisons and How They Have Changed Over Time, " Denver, Colorado, Legislative Finance Paper No. 66, 1989; quoted in "Taxes, Economic Growth, and Budget Deficits: What Washington Can Learn From the States," cited above. The five "tax increase" states were Ohio, Wyoming, Utah, North Carolina, and Iowa; the five "tax cut" states were California, Massachusetts, North Dakota, Montana, and Arizona. Alaska was excluded from the survey.
Appendix II, on Tax Capitalization, includes a short discussion of the three commonly used methods of assessing property.
Millage other than voted debt millage is called "operating" millage, since it is intended for the operation of government rather than capital expenditures.
"Special assessments" also appear on many tax bills, but these are levied to finance physical improvements that benefit the property, and are not taxes. Unfortunately, this category has been abused. See Citizens Research Council, The Misuse and Abuse of Special Assessments in Michigan, Detroit MI, October 1983, report no. 944.
An excellent historical and legal overview of the 50-mill limit is Local Property Tax Limitations in Michigan, Detroit MI, Citizens Research Council, September 1989, report no. 295.
Millage data are from Property Tax Reform Proposals in Michigan, cited above.
For a complete explanation of all sections of the Headlee amendment, see Patrick L. Anderson, How the Headlee Amendment Protects Michigan Taxpayers, (4th ed.) Farmington Hills, MI, Taxpayers United for the Michigan Constitution, September 1991. Single copies are available free from PO Box 1776, Farmington Hills MI 48334.
Section 508 of the Michigan Income Tax Act of 1967; MCL 206.508. The Legislature is required by HJR H to implement the assessment cap, and could define "homestead" differently for the purpose of the assessment-growth cap. The income tax definition is broad enough to include, for those who have lived in the same place for 10 years or more, up to 10 acres as a "homestead" parcel.
In 1990, Residential property comprised about 59% of all real and personal property in the state. Commercial and Industrial comprised almost 33%. Agricultural comprised about 4%, Utility property about 3%, and Developmental and Timber less than 1%.
A 1978 study of Michigan's property tax estimated there were 264 cities, 270 villages, 1,200 townships, 83 counties, and 624 local and intermediate school districts, many of which overlap, and each of which have a separate property tax. See Mike Addonizio, The Property Tax in Michigan: a Primer, Lansing, MI, Senate Fiscal Agency, February 1987, p. 4.
There are already problems enforcing the 50-mill limit; a 1989 study found four counties where aggregate operating millages exceeded the limit. See Local Property Tax Limitations in Michigan, report no. 295, September 1989, and Enforcement of the 50 Mill Limitation, report no. 1001, October 1991; Detroit, MI, Citizens Research Council.
The Attorney General, in Opinion No. 6654 of 1990, addressed the question of which millages must be reduced to comply with the 50-mill limit, if multiple municipalities had millage authorizations which, in total, exceeded the limit. The opinion stated that the millage last authorized by voters must be reduced, which has been called the "last in, first out (LIFO)" rule. In addition, the millage rates limited are those rates after reductions required by the Headlee amendment. See the discussion below on possible ways HJR H would allow tax increases on one class of property.
In our opinion, Headlee rollups are already, unconstitutional. However, they remain in statute and are now used by local governments. See How the Headlee Amendment Protects Michigan Taxpayers, cited above.
For a more thorough discussion of the inequalities that could result, see Appendix I.
1990 Opinion of the Attorney General no. 6654.
In fact, the millage rollback factors estimated for 1993 under HJR H would allow "Headlee rollups" under current state law, opening the possibility that millage rates would actually increase in 1993 under HJR H.
Property Tax Reform Proposals in Michigan, cited above, p. 4.
Supreme Court of the United States, No. 90-1912, decided June 18, 1992; 1992 US Lexis 3688.
Michigan already has a relatively large program of income tax credits, commonly called "Circuit Breaker" or "Homestead" credits, designed to ensure that senior citizens are not placed in financial duress by growing property taxes. For senior citizens, the credit can reach 100% of property taxes above a certain amount, in certain income classes.
"Analysis of Citizens to Cut and Cap Your Property Taxes Petition," Lansing, MI, Department of Treasury, August 1991.
Jay Wortley and George Towne, Property Tax Reform Proposals in Michigan, Lansing, MI, Senate Fiscal Agency, July 1992; Gary Wolfram, "Analysis of Citizens to Cut and Cap Your Property Taxes Petition," Lansing, Ml, Department of Treasury, August 1991 (revenue analysis February 1992).
Actually, the home she owned previously would have increased in value, and she would have received a higher sale price for it. The lower taxes on the home in the example would have been capitalized into the sale price. The example assumes the increases in value for the two homes are the same.
Depending on how Cut and Cap was implemented, the assessment would probably not reflect full market value until the year after it was sold, and even then may be limited to 3% over the market value shown by the sale price the year before.
The incentive would arise from the ability to vote an additional mill's revenue, but only have to directly pay 70% of it.
County of Oakland v State of Michigan, 178 Mich. App. 48, 443 NW2d 805 (1989), appeal granted in part, 453 NW2d 256.
For discussion of this and other aspects of the Headlee amendment, see Patrick L. Anderson, How the Headlee Amendment Protects Michigan Taxpayers, (4th ed.) Farmington Hills, MI, Taxpayers United for the Michigan Constitution, September 1991. Single copies are available free from PO Box 1776, Farmington Hills MI 48334.
The drafters of the Headlee amendment anticipated future constitutional amendments. Article IX Section 26 concludes: "If responsibility for funding a program or programs is transferred from one level of government to another, as a consequence of constitutional amendment, the state revenue and spending limits may be adjusted to accommodate such change, provided that the total revenue authorized for collection by both state and local governments does not exceed that amount which would have been authorized without such change." Should Cut and Cap pass, this provision will be reviewed closely. The Section 30 local share requirement is a "spending limit," as it refers to the "proportion of total state spending paid to all units of local government, taken as a group."
Supreme Court of the United States, No. 90-1912, decided June 18, 1992; 1992 US Lexis 3688.
Allegheny Pittsburgh Coal v Webster, Sup. Ct. Nos. 87-1303, 87-1310; 488 U.S. 336 (1989); 1989 US Lexis 433. This case concerned the practice of a West Virginia county tax assessor of assessing recently purchased property on its purchase price, but only making minor adjustments in subsequent years. This had the effect of creating large disparities in effective tax rates, since the adjustments laggedfar behind actual market values. However, the West Virginia constitution, like the current Michigan constitution, requires uniform property taxation based on current market value. Also discussed in Nordlinger v Hahn, IA, citing also the California Court of Appeals decision upholding Proposition 13, Nordlinger v Lynch, 225 Cal.App.3d 1277.
Another example of state courts invalidating a scheme allowing disparate taxation is Drugman v Board of Assessors of Atlantic Beach (NY) (1988), 141 A.D.2d, 533 NY S.2d 495. Here, the Appellate division of the New York Supreme Court held that a village assessor's "practice of selective reassessment of only those properties in the village which were sold during the prior year contravenes statutory and constitutional mandates." (Quoted from State and Local Tax Insights, San Francisco, Morrison & Foerster, March 1989.)
Further discussions of Proposition 13 include Ellen Worcester, "If Proposition 13 Is Invalidated, What Next?" Journal of California Taxation, Winter 1992, and Carlyle W. Hall, Jr., "It's Time For a Change," Los Angeles Lawyer (unknown date). Both are reprinted in State Tax Notes, February 17, 1992, Arlington VA, Tax Analysts.
Nordlinger v Hahn, IIB.
In the Allegheny case, the assessor for one county used an acquisition-value method, while the rest of the state used the market-value method prescribed by the West Virginia constitution. In ruling this unconstitutional, the court quoted with approval the following decisions:
"[I]ntentional systematic undervaluation by state officials of other taxable property in the same class contravenes the constitutional right of one taxed upon the full value of his property." Sunday Lake Iron Co [v Wakefield, 247 U.S. 352-53 (1918)]; Sioux City Bridge Co. v Dakota County, 260 U.S. 441, 445446 (1923); Cumberland Coal Co. v Board of Revision of Tax Assessments in Greene County, Pa, 284 U.S. 23, 28-29 (1931). "The equal protection clause ... protects the individual from state action which selects him out for discriminatory treatment by subjecting him to taxes not imposed on others of the same class." Hillsborough v Cromwell, 326 U.S. 620, 623 (1946).
Under HJR H, residential and agricultural property would be taxed at different rates depending on whether it was "homestead" property, and residential and agricultural property would be explicitly taxed at different millage rates from business property.
Foss v Rochester (1985) 65 NY2d 247, 491 NYS2d 128, 480 NE2d 717.
Nordlinger v Hahn, II.
A more precise evaluation would also include taxation of the income stream, risks, and the resale value of the property.
The capitalization ratio is commonly inverted, so that a 10: I ratio is equivalent to a 1/10, or 10%, capitalization rate or "cap rate." Cap rates vary with the economic climate and other factors, but 10% is a good approximation. The model used for revenue analysis of Cut and Cap used a more conservative 8:1 cap ratio.
Section 27 of the General Property Tax Act states: "In determining the value the assessor shall also consider ... present economic income ..." The capitalization method is also explicitly recognized as a valid method for determining true cash value in case law and attorney general opinions: "The true cash value of property for ad valorem taxation purposes may be determined by any of the three acceptable tests, namely (1) the sales method, (2) the reproduction cost method, or (3) the capitalization of income method." OAG 1982, No. 6092. All three approaches should be used whenever possible. Meadowlanes Ltd. Dividend Housing Assn v City of Holland, (1991) 473 NW2d 636, 437 Mich 473, rehearing denied. Expenses are explicitly recognized as elements of net income to be utilized in determining net economic income. Northwood Apartments v. City of Royal Oak (1980) 296 NW 2d 639, 98 Mich. App. 721.
Mortgage lenders typically assume that a percentage of income – often around 28% – will be available for house expenditures, including mortgage, property taxes, and insurance. Therefore, a $1 reduction in property taxes means an additional $1 is available to pay mortgage payments. Using a 10% 30-year mortgage as an example, each $100 reduction in monthly property taxes allows a homeowner to borrow an additional $11,395, with the same income and total monthly payment.
This is a simplified algorithm for estimating tax capitalization. There are other factors that would be involved in each individual parcel.
Michigan State Chamber of Commerce v State of Michigan (1983) 417 Mich. 419, concerned the passage of two partially conflicting proposals, both of which passed. The court ruled that: "The voters exercised a choice between Proposals H and D as whole proposals and chose Proposal H. Any piecemeal integration of nonconflicting provisions of Proposal D would be in derogation of that choice."
The Mackinac Center for Public Policy is a nonprofit research and educational institute that advances the principles of free markets and limited government. Through our research and education programs, we challenge government overreach and advocate for a free-market approach to public policy that frees people to realize their potential and dreams.
Please consider contributing to our work to advance a freer and more prosperous state.