Proposal 5 would increase funding to Michigan public schools, colleges and universities; reduce funding differences between districts; and shift part of the costs of school employee pensions from local districts to the state. Before analyzing Proposal 5, it is worth reviewing what has actually happened to education funding and school employee pension liabilities in the years since Proposal A went into effect. These areas are discussed in turn below.
Both the funding of Michigan school districts and the overall state budget underwent a major restructuring after 1994, when the passage of Proposal A shifted much of the responsibility for financing primary and secondary public education from local property taxes levied by public school districts to sales and property taxes levied by the state.
Since 1995, the Michigan economy and the state budget have experienced a roller-coaster ride of prosperity and decline. These trends have had a pronounced impact on the state government’s "general fund," which is the main source of discretionary tax revenue used to finance part or all of a number of state programs, including state universities and community colleges.† Proposal 5 would require the general fund to finance the proposal’s mandated additional education spending. Taxes placed in the general fund include all or part of the Single Business Tax; personal income taxes; the state sales tax; cigarette and alcohol taxes; and a variety of other specialized taxes.
From 1995 to 2000, a strong state and national economy led to large tax revenues for the general fund. Annual spending from the general fund was almost 18 percent higher in 2000 than it was in 1995, comfortably outpacing total inflation for the period.
This trend reversed abruptly after the 2001 national recession. The loss of jobs and the flight of capital from Michigan between 2001 and 2005 resulted in a substantial decline in tax collection, affecting spending for many state programs. Had general fund revenue from 2001 to 2005 kept pace with inflation, it would have been about $1 billion higher in 2005 than it was in 2001. Instead, general fund revenue was more than $1 billion lower than it was in 2001 — a decline of nearly 11 percent.[7]
The general fund is the source for state spending on community colleges and universities, and the fund sometimes supplements state spending on primary and secondary schools (see "Local School District Funding After Proposal A" below). The impact of the general fund revenues on state education spending is one impetus for the drafting and submission of Proposal 5. The K-16 Coalition, the primary political sponsor of Proposal 5, has noted on its Web site, "For the last three years, K-12 school districts saw no increase in State Aid and Michigan’s community colleges and universities had budgets slashed 15%."[8]‡ The language of Proposal 5 would prevent the state Legislature from making such decisions — an outcome that involves trade-offs that will be analyzed below under "Analysis of Proposal 5: Budget Effects."
|
† Most public school education money is provided by the state’s school aid fund, which is financed partly by a constitutionally dedicated portion of state sales and property taxes. |
|
‡The Web site was later updated, and the language was changed to read, “In school years 2001-2002, 2002-2003 and 2003-2004, K-12 schools received no increase in State Aid and Michigan’s community colleges and universities had budgets slashed 15%.” The years cited do not appear to correspond to the fiscal years in which state aid to primary and secondary schools essentially remained flat. As indicated in the text of this study, the three years in which funding remained effectively unchanged were fiscal 2003, 2004 and 2005. Regardless, the statement is essentially true. |
The major budget source for state primary and secondary education spending is the state’s "school aid fund." Since the advent of Proposal A, the monies in this fund have typically comprised at least 90 percent of the state’s spending on primary and secondary education, with any additional spending coming from the state’s general fund.
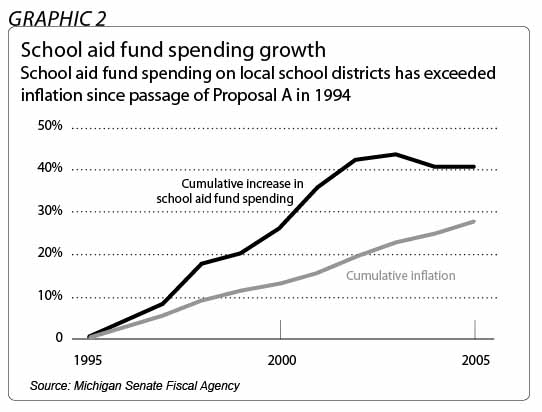
Since passage of Proposal A, the aggregate annual state funding for local schools has grown faster than the rate of inflation. State school aid fund spending in 2005 would have been 27 percent higher than in 1995 if spending had increased only at the inflation rate; in actuality, state school aid fund spending in 2005 was more than 40 percent higher than in 1995 — about $1 billion above the inflation rate.[9]
Within that decade, there have been years in which the growth in annual state spending on local schools fell to essentially zero (and in one year, very slightly below zero). Like the general fund, the school aid fund did not keep pace with inflation from 2001 through 2005, the period in which the national recession drove a decline in tax revenues. As suggested above, the state’s basic per-pupil foundation allowance to local school districts remained substantially unchanged in fiscal 2003, 2004 and 2005.
Michigan’s public universities and community colleges have the constitutional authority autonomously to raise money from tuition and other sources. Unlike public school districts, higher education institutions derive more funding from tuition and other sources than they do from direct state government aid. Almost all of the state aid that public universities and community colleges do receive comes from the general fund budget. Appropriations to support the state’s universities constitute nearly 21 percent of the state’s general fund expenditures.
Prior to the sharp decline in general fund tax revenue after 2001, state spending on community colleges and universities increased significantly. Taken together, state appropriations for community colleges and universities were nearly 37 percent higher in 2001 than in 1995, while inflation increased by about 15 percent during the same period. Spending for higher education in Michigan was also high relative to other states: According to the Nelson A. Rockefeller Institute of Government Fiscal Studies Program, spending per capita by Michigan’s public institutions of higher education ranked ninth highest in the nation for 2002 — nearly 33 percent above the national average.[10]
State funding of higher education was reduced, however, following the post-2001 decrease in state general fund revenues. State higher education expenditures in 2005 were nearly 10 percent lower than they had been in 2001. As will be discussed below, this reduction was not quite as large as the overall decline in general fund tax revenues.
In a comprehensive 2004 report, "Financing Michigan Retired Teacher Pension and Health Care Benefits," the nonprofit Citizens Research Council of Michigan predicted that the annual contribution rate paid by local school districts into MPSERS would increase from 14.87 percent of payroll in 2005 to 32 percent by 2020.[11] The CRC projection is both plausible and widely accepted, even though the school districts’ MPSERS contribution rate has fluctuated at or below 15 percent for more than a decade.
Several reasons account for the projected hike. Some of the projected cost increase is due to a disproportionately large number of retirees entering the system, while some arises from the need to make up for recent stock market losses. Another major factor is a substantial projected increase in the cost of retiree health care benefits. While the retiree health care benefit represented less than 45 percent of MPSERS costs in 2005, the CRC report predicted that it will account for more than 62 percent of total costs in 2020.[12]
The financial implications are troubling. The increases in the MPSERS contribution rate have already begun to consume a large percentage of each additional dollar sent to Michigan’s public school districts. The Michigan Senate Fiscal Agency calculates that the total retirement fund contribution increases from 2004 through 2006 cost the average school district an additional $178 per pupil, exceeding the state’s per-pupil foundation allowance increase during the period by $3 per pupil.[13]
The Michigan Senate Fiscal Agency estimates the MPSERS contribution rate will be 17.74 percent in the 2006-2007 school year. These rates would be the highest ever paid since local schools assumed cost obligation for MPSERS, even though the MSFA estimates are about 1 percentage point lower than the CRC’s projections. If the actual MPSERS rate increases remain within 1 percentage point of the CRC’s estimates for the next 10 years, MPSERS contribution costs will increase more than 94 percent by 2016. In contrast, the MPSERS contribution cost increase from 1996 to 2006 was about 50 percent.[14]±
The MSFA’s estimates tend to confirm the CRC projection of a steep upward climb in MPSERS contribution rates in coming decades. Absent unprecedented increases in state aid for local school districts, there is a significant possibility that MPSERS spending will consume nearly all of each additional taxpayer dollar taken for local schools over this time and possibly much more. Assessing the implications of its prediction, the Citizens Research Council stated: "The outlook for MPSERS contributions and the effect on school district budgets is decidedly gloomy."[15]
Concern over the impact on school districts appears to be a significant reason that supporters of Proposal 5 would like to shift responsibility for prospective MPSERS hikes from school districts to state government. For instance, Tom White, current chair of the K-16 Coalition and executive director of the Michigan Association of School Business Officers, was recently quoted in the Detroit Free Press addressing the MPSERS cost issue: "This is killing us. We could be spending $1,200 per pupil on retirement costs by 2008." He added, "We have to begin addressing these costs."[16]
Indeed, these costs will need to be addressed. As discussed below, however, transferring partial responsibility for MPSERS contributions to the state is not likely to achieve the goal of cost containment.
|
± The Citizens Research Council assumes 2 percent annual growth through 2016 in the wage base on which MPSERS contributions are calculated. This projection employs the same assumption. Estimated contribution rates from 2008 through 2016 are the CRC estimates minus 1 percentage point. Historical MPSERS data are taken from the Michigan Senate Fiscal Agency. |